| Multiple Linear Regression - Estimated Regression Equation |
| AKW[t] = + 110.055899257576 -0.038009298269539AKB[t] -0.174770514728344M1[t] -0.285363474701875M2[t] + 0.0732185403524886M3[t] + 0.299697191177373M4[t] + 0.336207016778144M5[t] + 0.0638871977515323M6[t] + 0.0184703036138447M7[t] + 0.0764184642465924M8[t] + 0.199242753311017M9[t] + 0.295251074336222M10[t] + 0.25339064685611M11[t] + 0.125505490971034t + e[t] |
| Multiple Linear Regression - Ordinary Least Squares | |||||
| Variable | Parameter | S.D. | T-STAT H0: parameter = 0 | 2-tail p-value | 1-tail p-value |
| (Intercept) | 110.055899257576 | 0.745913 | 147.5452 | 0 | 0 |
| AKB | -0.038009298269539 | 0.006538 | -5.8133 | 1e-06 | 0 |
| M1 | -0.174770514728344 | 0.273445 | -0.6391 | 0.525832 | 0.262916 |
| M2 | -0.285363474701875 | 0.28765 | -0.9921 | 0.326253 | 0.163126 |
| M3 | 0.0732185403524886 | 0.286692 | 0.2554 | 0.799536 | 0.399768 |
| M4 | 0.299697191177373 | 0.28629 | 1.0468 | 0.300532 | 0.150266 |
| M5 | 0.336207016778144 | 0.286672 | 1.1728 | 0.246789 | 0.123394 |
| M6 | 0.0638871977515323 | 0.286451 | 0.223 | 0.824479 | 0.412239 |
| M7 | 0.0184703036138447 | 0.285883 | 0.0646 | 0.94876 | 0.47438 |
| M8 | 0.0764184642465924 | 0.285887 | 0.2673 | 0.790405 | 0.395203 |
| M9 | 0.199242753311017 | 0.28619 | 0.6962 | 0.489739 | 0.244869 |
| M10 | 0.295251074336222 | 0.287662 | 1.0264 | 0.309965 | 0.154982 |
| M11 | 0.25339064685611 | 0.286609 | 0.8841 | 0.381143 | 0.190571 |
| t | 0.125505490971034 | 0.004867 | 25.7864 | 0 | 0 |
| Multiple Linear Regression - Regression Statistics | |
| Multiple R | 0.978580216162726 |
| R-squared | 0.957619239465087 |
| Adjusted R-squared | 0.945896901444792 |
| F-TEST (value) | 81.6918295486061 |
| F-TEST (DF numerator) | 13 |
| F-TEST (DF denominator) | 47 |
| p-value | 0 |
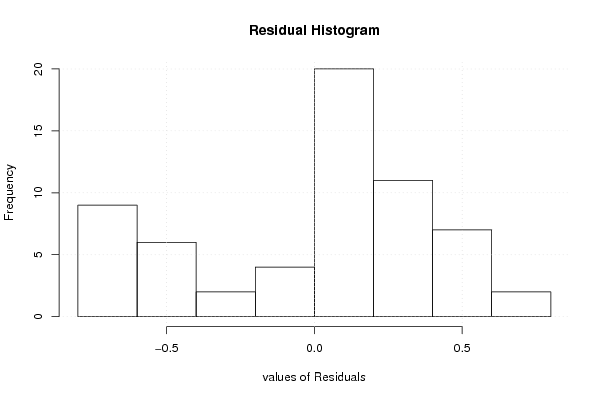
| Multiple Linear Regression - Residual Statistics | |
| Residual Standard Deviation | 0.450700805243576 |
| Sum Squared Residuals | 9.54716714481878 |
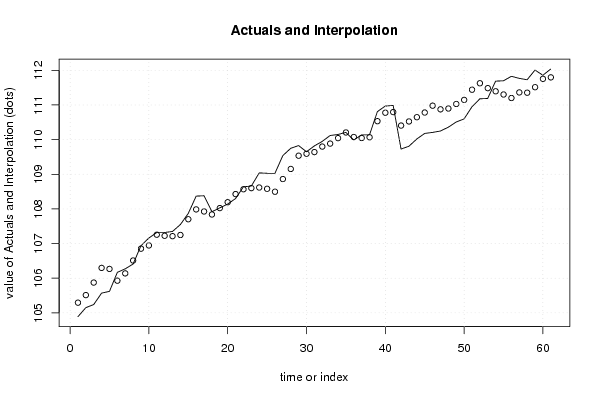
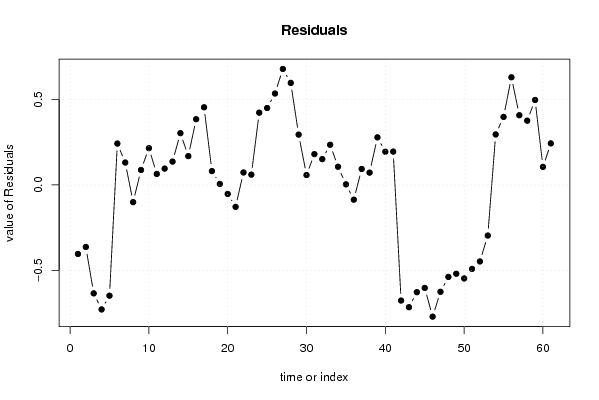
| Multiple Linear Regression - Actuals, Interpolation, and Residuals | |||
| Time or Index | Actuals | Interpolation Forecast | Residuals Prediction Error |
| 1 | 104.89 | 105.293481248395 | -0.403481248395319 |
| 2 | 105.15 | 105.512503711100 | -0.36250371110043 |
| 3 | 105.24 | 105.873821183715 | -0.633821183715225 |
| 4 | 105.57 | 106.297642899241 | -0.727642899240572 |
| 5 | 105.62 | 106.267331166569 | -0.6473311665685 |
| 6 | 106.17 | 105.928189789269 | 0.241810210730943 |
| 7 | 106.27 | 106.139030372150 | 0.130969627850375 |
| 8 | 106.41 | 106.510630050188 | -0.100630050187622 |
| 9 | 106.94 | 106.852462703966 | 0.0875372960338539 |
| 10 | 107.16 | 106.945124994829 | 0.214875005171350 |
| 11 | 107.32 | 107.255685568989 | 0.0643144310112762 |
| 12 | 107.32 | 107.224344030708 | 0.0956559692917247 |
| 13 | 107.35 | 107.213468398203 | 0.136531601796802 |
| 14 | 107.55 | 107.247385578335 | 0.302614421664536 |
| 15 | 107.87 | 107.701445738728 | 0.168554261272077 |
| 16 | 108.37 | 107.985773329604 | 0.384226670395938 |
| 17 | 108.38 | 107.926194437264 | 0.453805562735537 |
| 18 | 107.92 | 107.839054707492 | 0.0809452925079438 |
| 19 | 108.03 | 108.024048967549 | 0.00595103245067025 |
| 20 | 108.14 | 108.192678992828 | -0.0526789928279927 |
| 21 | 108.3 | 108.428085611452 | -0.128085611451811 |
| 22 | 108.64 | 108.567119246203 | 0.072880753796853 |
| 23 | 108.66 | 108.599831850013 | 0.0601681499871106 |
| 24 | 109.04 | 108.617522306500 | 0.422477693499861 |
| 25 | 109.03 | 108.580420258189 | 0.449579741810914 |
| 26 | 109.03 | 108.495748427720 | 0.534251572279602 |
| 27 | 109.54 | 108.862007109110 | 0.677992890889782 |
| 28 | 109.75 | 109.153556466658 | 0.596443533342424 |
| 29 | 109.83 | 109.53564562021 | 0.294354379789987 |
| 30 | 109.65 | 109.592181037896 | 0.0578189621035373 |
| 31 | 109.82 | 109.639961731201 | 0.180038268799287 |
| 32 | 109.95 | 109.799089431912 | 0.150910568088020 |
| 33 | 110.12 | 109.885119508337 | 0.234880491663495 |
| 34 | 110.15 | 110.043537885205 | 0.106462114794691 |
| 35 | 110.21 | 110.206622382080 | 0.0033776179204208 |
| 36 | 109.99 | 110.076076575316 | -0.086076575315632 |
| 37 | 110.14 | 110.046576386658 | 0.0934236133415222 |
| 38 | 110.14 | 110.067950498362 | 0.072049501638196 |
| 39 | 110.81 | 110.531893076304 | 0.278106923695657 |
| 40 | 110.97 | 110.775930811015 | 0.194069188985225 |
| 41 | 110.99 | 110.795031166093 | 0.194968833906884 |
| 42 | 109.73 | 110.405717515078 | -0.675717515077871 |
| 43 | 109.81 | 110.524575596146 | -0.714575596146148 |
| 44 | 110.02 | 110.646834277536 | -0.626834277535977 |
| 45 | 110.18 | 110.781896348728 | -0.601896348728198 |
| 46 | 110.21 | 110.979844395797 | -0.769844395797338 |
| 47 | 110.25 | 110.874583246889 | -0.624583246888643 |
| 48 | 110.36 | 110.897595005134 | -0.537595005133638 |
| 49 | 110.51 | 111.028874148157 | -0.518874148156633 |
| 50 | 110.6 | 111.146411784482 | -0.546411784481903 |
| 51 | 110.95 | 111.440832892142 | -0.490832892142291 |
| 52 | 111.18 | 111.627096493483 | -0.447096493483015 |
| 53 | 111.19 | 111.485797609864 | -0.295797609863907 |
| 54 | 111.69 | 111.394856950265 | 0.295143049735447 |
| 55 | 111.7 | 111.302383332954 | 0.397616667045815 |
| 56 | 111.83 | 111.200767247536 | 0.629232752463572 |
| 57 | 111.77 | 111.362435827517 | 0.40756417248266 |
| 58 | 111.73 | 111.354373477966 | 0.375626522034444 |
| 59 | 112.01 | 111.513276952030 | 0.496723047969836 |
| 60 | 111.86 | 111.754462082342 | 0.105537917657683 |
| 61 | 112.04 | 111.797179560397 | 0.242820439602715 |
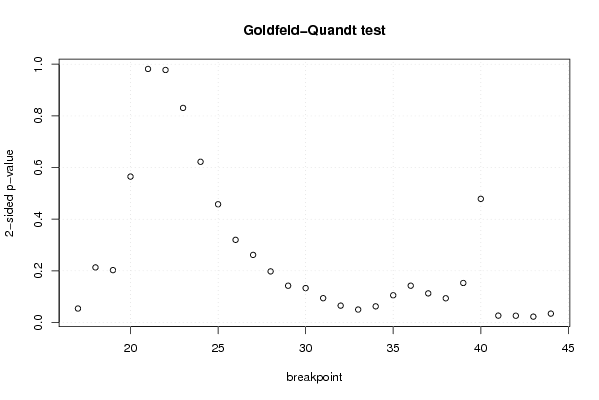
| Goldfeld-Quandt test for Heteroskedasticity | |||
| p-values | Alternative Hypothesis | ||
| breakpoint index | greater | 2-sided | less |
| 17 | 0.0270735384923653 | 0.0541470769847305 | 0.972926461507635 |
| 18 | 0.106658770337142 | 0.213317540674284 | 0.893341229662858 |
| 19 | 0.101461526905173 | 0.202923053810346 | 0.898538473094827 |
| 20 | 0.282488812757886 | 0.564977625515771 | 0.717511187242114 |
| 21 | 0.509113652546352 | 0.981772694907297 | 0.490886347453648 |
| 22 | 0.488935370969272 | 0.977870741938545 | 0.511064629030728 |
| 23 | 0.415402622498876 | 0.830805244997753 | 0.584597377501124 |
| 24 | 0.311184242022723 | 0.622368484045446 | 0.688815757977277 |
| 25 | 0.228933604988870 | 0.457867209977740 | 0.77106639501113 |
| 26 | 0.160067267947015 | 0.320134535894031 | 0.839932732052985 |
| 27 | 0.130906054367787 | 0.261812108735575 | 0.869093945632213 |
| 28 | 0.0989791019990597 | 0.197958203998119 | 0.90102089800094 |
| 29 | 0.071211158540358 | 0.142422317080716 | 0.928788841459642 |
| 30 | 0.0666476776975794 | 0.133295355395159 | 0.93335232230242 |
| 31 | 0.0471173624441003 | 0.0942347248882007 | 0.9528826375559 |
| 32 | 0.0326833912183891 | 0.0653667824367782 | 0.967316608781611 |
| 33 | 0.0250975600139592 | 0.0501951200279184 | 0.974902439986041 |
| 34 | 0.0312857971026515 | 0.062571594205303 | 0.968714202897349 |
| 35 | 0.0527302061992754 | 0.105460412398551 | 0.947269793800725 |
| 36 | 0.0712653675498066 | 0.142530735099613 | 0.928734632450193 |
| 37 | 0.0564113892288552 | 0.112822778457710 | 0.943588610771145 |
| 38 | 0.0469377782199335 | 0.093875556439867 | 0.953062221780066 |
| 39 | 0.076581219998753 | 0.153162439997506 | 0.923418780001247 |
| 40 | 0.239417801675653 | 0.478835603351306 | 0.760582198324347 |
| 41 | 0.986655704387136 | 0.0266885912257284 | 0.0133442956128642 |
| 42 | 0.986875856465775 | 0.0262482870684507 | 0.0131241435342253 |
| 43 | 0.988648297933655 | 0.0227034041326907 | 0.0113517020663453 |
| 44 | 0.982761488493878 | 0.0344770230122443 | 0.0172385115061221 |
| Meta Analysis of Goldfeld-Quandt test for Heteroskedasticity | |||
| Description | # significant tests | % significant tests | OK/NOK |
| 1% type I error level | 0 | 0 | OK |
| 5% type I error level | 4 | 0.142857142857143 | NOK |
| 10% type I error level | 10 | 0.357142857142857 | NOK |