Free Statistics

of Irreproducible Research!

Author's title

Author*The author of this computation has been verified*
R Software Modulerwasp_multipleregression.wasp
Title produced by softwareMultiple Regression
Date of computationSun, 22 Nov 2009 11:44:57 -0700
Cite this page as followsStatistical Computations at FreeStatistics.org, Office for Research Development and Education, URL https://freestatistics.org/blog/index.php?v=date/2009/Nov/22/t1258915556snxgpcn1o618rsf.htm/, Retrieved Sun, 28 Apr 2024 09:12:08 +0000
Statistical Computations at FreeStatistics.org, Office for Research Development and Education, URL https://freestatistics.org/blog/index.php?pk=58678, Retrieved Sun, 28 Apr 2024 09:12:08 +0000
QR Codes:

Original text written by user:
IsPrivate?No (this computation is public)
User-defined keywords
Estimated Impact128
Family? (F = Feedback message, R = changed R code, M = changed R Module, P = changed Parameters, D = changed Data)
-       [Multiple Regression] [WS73] [2009-11-22 18:44:57] [b406b824746c89e17d2637b66f6fb2ee] [Current]
Feedback Forum

Post a new message
Dataseries X:
104.89	124
105.15	118.63
105.24	121.86
105.57	119.97
105.62	125.03
106.17	130.09
106.27	126.65
106.41	121.7
106.94	119.24
107.16	122.63
107.32	116.66
107.32	114.12
107.35	113.11
107.55	112.61
107.87	113.4
108.37	115.18
108.38	121.01
107.92	119.44
108.03	116.68
108.14	117.07
108.3	117.41
108.64	119.58
108.66	120.92
109.04	117.09
109.03	116.77
109.03	119.39
109.54	122.49
109.75	124.08
109.83	118.29
109.65	112.94
109.82	113.79
109.95	114.43
110.12	118.7
110.15	120.36
110.21	118.27
109.99	118.34
110.14	117.82
110.14	117.65
110.81	118.18
110.97	121.02
110.99	124.78
109.73	131.16
109.81	130.14
110.02	131.75
110.18	134.73
110.21	135.35
110.25	140.32
110.36	136.35
110.51	131.6
110.6	128.9
110.95	133.89
111.18	138.25
111.19	146.23
111.69	144.76
111.7	149.3
111.83	156.8
111.77	159.08
111.73	165.12
112.01	163.14
111.86	153.43
112.04	151.01


Summary of computational transaction
Raw Inputview raw input (R code)
Raw Outputview raw output of R engine
Computing time3 seconds
R Server'Gwilym Jenkins' @ 72.249.127.135

\begin{tabular}{lllllllll}
\hline
Summary of computational transaction \tabularnewline
Raw Input & view raw input (R code)  \tabularnewline
Raw Output & view raw output of R engine  \tabularnewline
Computing time & 3 seconds \tabularnewline
R Server & 'Gwilym Jenkins' @ 72.249.127.135 \tabularnewline
\hline
\end{tabular}
%Source: https://freestatistics.org/blog/index.php?pk=58678&T=0

[TABLE]
[ROW][C]Summary of computational transaction[/C][/ROW]
[ROW][C]Raw Input[/C][C]view raw input (R code) [/C][/ROW]
[ROW][C]Raw Output[/C][C]view raw output of R engine [/C][/ROW]
[ROW][C]Computing time[/C][C]3 seconds[/C][/ROW]
[ROW][C]R Server[/C][C]'Gwilym Jenkins' @ 72.249.127.135[/C][/ROW]
[/TABLE]
Source: https://freestatistics.org/blog/index.php?pk=58678&T=0

Globally Unique Identifier (entire table): ba.freestatistics.org/blog/index.php?pk=58678&T=0

As an alternative you can also use a QR Code:  

The GUIDs for individual cells are displayed in the table below:

Summary of computational transaction
Raw Inputview raw input (R code)
Raw Outputview raw output of R engine
Computing time3 seconds
R Server'Gwilym Jenkins' @ 72.249.127.135


Multiple Linear Regression - Estimated Regression Equation
AKW[t] = + 110.055899257576 -0.038009298269539AKB[t] -0.174770514728344M1[t] -0.285363474701875M2[t] + 0.0732185403524886M3[t] + 0.299697191177373M4[t] + 0.336207016778144M5[t] + 0.0638871977515323M6[t] + 0.0184703036138447M7[t] + 0.0764184642465924M8[t] + 0.199242753311017M9[t] + 0.295251074336222M10[t] + 0.25339064685611M11[t] + 0.125505490971034t + e[t]

\begin{tabular}{lllllllll}
\hline
Multiple Linear Regression - Estimated Regression Equation \tabularnewline
AKW[t] =  +  110.055899257576 -0.038009298269539AKB[t] -0.174770514728344M1[t] -0.285363474701875M2[t] +  0.0732185403524886M3[t] +  0.299697191177373M4[t] +  0.336207016778144M5[t] +  0.0638871977515323M6[t] +  0.0184703036138447M7[t] +  0.0764184642465924M8[t] +  0.199242753311017M9[t] +  0.295251074336222M10[t] +  0.25339064685611M11[t] +  0.125505490971034t  + e[t] \tabularnewline
\hline
\end{tabular}
%Source: https://freestatistics.org/blog/index.php?pk=58678&T=1

[TABLE]
[ROW][C]Multiple Linear Regression - Estimated Regression Equation[/C][/ROW]
[ROW][C]AKW[t] =  +  110.055899257576 -0.038009298269539AKB[t] -0.174770514728344M1[t] -0.285363474701875M2[t] +  0.0732185403524886M3[t] +  0.299697191177373M4[t] +  0.336207016778144M5[t] +  0.0638871977515323M6[t] +  0.0184703036138447M7[t] +  0.0764184642465924M8[t] +  0.199242753311017M9[t] +  0.295251074336222M10[t] +  0.25339064685611M11[t] +  0.125505490971034t  + e[t][/C][/ROW]
[/TABLE]
Source: https://freestatistics.org/blog/index.php?pk=58678&T=1

Globally Unique Identifier (entire table): ba.freestatistics.org/blog/index.php?pk=58678&T=1

As an alternative you can also use a QR Code:  

The GUIDs for individual cells are displayed in the table below:

Multiple Linear Regression - Estimated Regression Equation
AKW[t] = + 110.055899257576 -0.038009298269539AKB[t] -0.174770514728344M1[t] -0.285363474701875M2[t] + 0.0732185403524886M3[t] + 0.299697191177373M4[t] + 0.336207016778144M5[t] + 0.0638871977515323M6[t] + 0.0184703036138447M7[t] + 0.0764184642465924M8[t] + 0.199242753311017M9[t] + 0.295251074336222M10[t] + 0.25339064685611M11[t] + 0.125505490971034t + e[t]


Multiple Linear Regression - Ordinary Least Squares
VariableParameterS.D.T-STATH0: parameter = 02-tail p-value1-tail p-value
(Intercept)110.0558992575760.745913147.545200
AKB-0.0380092982695390.006538-5.81331e-060
M1-0.1747705147283440.273445-0.63910.5258320.262916
M2-0.2853634747018750.28765-0.99210.3262530.163126
M30.07321854035248860.2866920.25540.7995360.399768
M40.2996971911773730.286291.04680.3005320.150266
M50.3362070167781440.2866721.17280.2467890.123394
M60.06388719775153230.2864510.2230.8244790.412239
M70.01847030361384470.2858830.06460.948760.47438
M80.07641846424659240.2858870.26730.7904050.395203
M90.1992427533110170.286190.69620.4897390.244869
M100.2952510743362220.2876621.02640.3099650.154982
M110.253390646856110.2866090.88410.3811430.190571
t0.1255054909710340.00486725.786400

\begin{tabular}{lllllllll}
\hline
Multiple Linear Regression - Ordinary Least Squares \tabularnewline
Variable & Parameter & S.D. & T-STATH0: parameter = 0 & 2-tail p-value & 1-tail p-value \tabularnewline
(Intercept) & 110.055899257576 & 0.745913 & 147.5452 & 0 & 0 \tabularnewline
AKB & -0.038009298269539 & 0.006538 & -5.8133 & 1e-06 & 0 \tabularnewline
M1 & -0.174770514728344 & 0.273445 & -0.6391 & 0.525832 & 0.262916 \tabularnewline
M2 & -0.285363474701875 & 0.28765 & -0.9921 & 0.326253 & 0.163126 \tabularnewline
M3 & 0.0732185403524886 & 0.286692 & 0.2554 & 0.799536 & 0.399768 \tabularnewline
M4 & 0.299697191177373 & 0.28629 & 1.0468 & 0.300532 & 0.150266 \tabularnewline
M5 & 0.336207016778144 & 0.286672 & 1.1728 & 0.246789 & 0.123394 \tabularnewline
M6 & 0.0638871977515323 & 0.286451 & 0.223 & 0.824479 & 0.412239 \tabularnewline
M7 & 0.0184703036138447 & 0.285883 & 0.0646 & 0.94876 & 0.47438 \tabularnewline
M8 & 0.0764184642465924 & 0.285887 & 0.2673 & 0.790405 & 0.395203 \tabularnewline
M9 & 0.199242753311017 & 0.28619 & 0.6962 & 0.489739 & 0.244869 \tabularnewline
M10 & 0.295251074336222 & 0.287662 & 1.0264 & 0.309965 & 0.154982 \tabularnewline
M11 & 0.25339064685611 & 0.286609 & 0.8841 & 0.381143 & 0.190571 \tabularnewline
t & 0.125505490971034 & 0.004867 & 25.7864 & 0 & 0 \tabularnewline
\hline
\end{tabular}
%Source: https://freestatistics.org/blog/index.php?pk=58678&T=2

[TABLE]
[ROW][C]Multiple Linear Regression - Ordinary Least Squares[/C][/ROW]
[ROW][C]Variable[/C][C]Parameter[/C][C]S.D.[/C][C]T-STATH0: parameter = 0[/C][C]2-tail p-value[/C][C]1-tail p-value[/C][/ROW]
[ROW][C](Intercept)[/C][C]110.055899257576[/C][C]0.745913[/C][C]147.5452[/C][C]0[/C][C]0[/C][/ROW]
[ROW][C]AKB[/C][C]-0.038009298269539[/C][C]0.006538[/C][C]-5.8133[/C][C]1e-06[/C][C]0[/C][/ROW]
[ROW][C]M1[/C][C]-0.174770514728344[/C][C]0.273445[/C][C]-0.6391[/C][C]0.525832[/C][C]0.262916[/C][/ROW]
[ROW][C]M2[/C][C]-0.285363474701875[/C][C]0.28765[/C][C]-0.9921[/C][C]0.326253[/C][C]0.163126[/C][/ROW]
[ROW][C]M3[/C][C]0.0732185403524886[/C][C]0.286692[/C][C]0.2554[/C][C]0.799536[/C][C]0.399768[/C][/ROW]
[ROW][C]M4[/C][C]0.299697191177373[/C][C]0.28629[/C][C]1.0468[/C][C]0.300532[/C][C]0.150266[/C][/ROW]
[ROW][C]M5[/C][C]0.336207016778144[/C][C]0.286672[/C][C]1.1728[/C][C]0.246789[/C][C]0.123394[/C][/ROW]
[ROW][C]M6[/C][C]0.0638871977515323[/C][C]0.286451[/C][C]0.223[/C][C]0.824479[/C][C]0.412239[/C][/ROW]
[ROW][C]M7[/C][C]0.0184703036138447[/C][C]0.285883[/C][C]0.0646[/C][C]0.94876[/C][C]0.47438[/C][/ROW]
[ROW][C]M8[/C][C]0.0764184642465924[/C][C]0.285887[/C][C]0.2673[/C][C]0.790405[/C][C]0.395203[/C][/ROW]
[ROW][C]M9[/C][C]0.199242753311017[/C][C]0.28619[/C][C]0.6962[/C][C]0.489739[/C][C]0.244869[/C][/ROW]
[ROW][C]M10[/C][C]0.295251074336222[/C][C]0.287662[/C][C]1.0264[/C][C]0.309965[/C][C]0.154982[/C][/ROW]
[ROW][C]M11[/C][C]0.25339064685611[/C][C]0.286609[/C][C]0.8841[/C][C]0.381143[/C][C]0.190571[/C][/ROW]
[ROW][C]t[/C][C]0.125505490971034[/C][C]0.004867[/C][C]25.7864[/C][C]0[/C][C]0[/C][/ROW]
[/TABLE]
Source: https://freestatistics.org/blog/index.php?pk=58678&T=2

Globally Unique Identifier (entire table): ba.freestatistics.org/blog/index.php?pk=58678&T=2

As an alternative you can also use a QR Code:  

The GUIDs for individual cells are displayed in the table below:

Multiple Linear Regression - Ordinary Least Squares
VariableParameterS.D.T-STATH0: parameter = 02-tail p-value1-tail p-value
(Intercept)110.0558992575760.745913147.545200
AKB-0.0380092982695390.006538-5.81331e-060
M1-0.1747705147283440.273445-0.63910.5258320.262916
M2-0.2853634747018750.28765-0.99210.3262530.163126
M30.07321854035248860.2866920.25540.7995360.399768
M40.2996971911773730.286291.04680.3005320.150266
M50.3362070167781440.2866721.17280.2467890.123394
M60.06388719775153230.2864510.2230.8244790.412239
M70.01847030361384470.2858830.06460.948760.47438
M80.07641846424659240.2858870.26730.7904050.395203
M90.1992427533110170.286190.69620.4897390.244869
M100.2952510743362220.2876621.02640.3099650.154982
M110.253390646856110.2866090.88410.3811430.190571
t0.1255054909710340.00486725.786400


Multiple Linear Regression - Regression Statistics
Multiple R0.978580216162726
R-squared0.957619239465087
Adjusted R-squared0.945896901444792
F-TEST (value)81.6918295486061
F-TEST (DF numerator)13
F-TEST (DF denominator)47
p-value0
Multiple Linear Regression - Residual Statistics
Residual Standard Deviation0.450700805243576
Sum Squared Residuals9.54716714481878

\begin{tabular}{lllllllll}
\hline
Multiple Linear Regression - Regression Statistics \tabularnewline
Multiple R & 0.978580216162726 \tabularnewline
R-squared & 0.957619239465087 \tabularnewline
Adjusted R-squared & 0.945896901444792 \tabularnewline
F-TEST (value) & 81.6918295486061 \tabularnewline
F-TEST (DF numerator) & 13 \tabularnewline
F-TEST (DF denominator) & 47 \tabularnewline
p-value & 0 \tabularnewline
Multiple Linear Regression - Residual Statistics \tabularnewline
Residual Standard Deviation & 0.450700805243576 \tabularnewline
Sum Squared Residuals & 9.54716714481878 \tabularnewline
\hline
\end{tabular}
%Source: https://freestatistics.org/blog/index.php?pk=58678&T=3

[TABLE]
[ROW][C]Multiple Linear Regression - Regression Statistics[/C][/ROW]
[ROW][C]Multiple R[/C][C]0.978580216162726[/C][/ROW]
[ROW][C]R-squared[/C][C]0.957619239465087[/C][/ROW]
[ROW][C]Adjusted R-squared[/C][C]0.945896901444792[/C][/ROW]
[ROW][C]F-TEST (value)[/C][C]81.6918295486061[/C][/ROW]
[ROW][C]F-TEST (DF numerator)[/C][C]13[/C][/ROW]
[ROW][C]F-TEST (DF denominator)[/C][C]47[/C][/ROW]
[ROW][C]p-value[/C][C]0[/C][/ROW]
[ROW][C]Multiple Linear Regression - Residual Statistics[/C][/ROW]
[ROW][C]Residual Standard Deviation[/C][C]0.450700805243576[/C][/ROW]
[ROW][C]Sum Squared Residuals[/C][C]9.54716714481878[/C][/ROW]
[/TABLE]
Source: https://freestatistics.org/blog/index.php?pk=58678&T=3

Globally Unique Identifier (entire table): ba.freestatistics.org/blog/index.php?pk=58678&T=3

As an alternative you can also use a QR Code:  

The GUIDs for individual cells are displayed in the table below:

Multiple Linear Regression - Regression Statistics
Multiple R0.978580216162726
R-squared0.957619239465087
Adjusted R-squared0.945896901444792
F-TEST (value)81.6918295486061
F-TEST (DF numerator)13
F-TEST (DF denominator)47
p-value0
Multiple Linear Regression - Residual Statistics
Residual Standard Deviation0.450700805243576
Sum Squared Residuals9.54716714481878


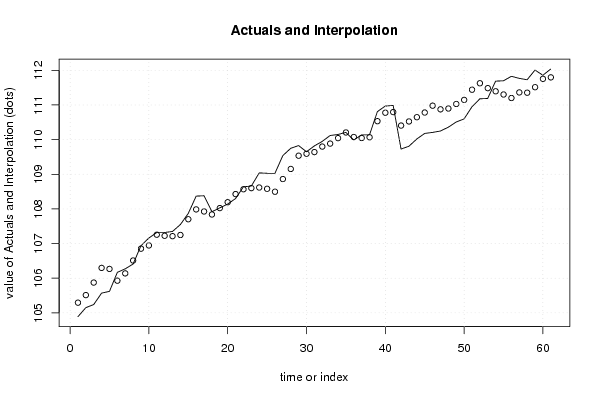
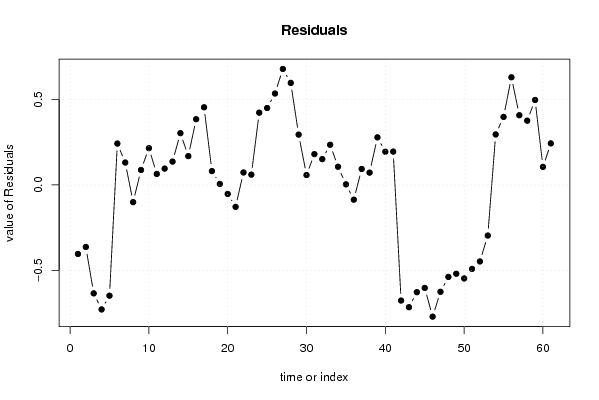
Multiple Linear Regression - Actuals, Interpolation, and Residuals
Time or IndexActualsInterpolationForecastResidualsPrediction Error
1104.89105.293481248395-0.403481248395319
2105.15105.512503711100-0.36250371110043
3105.24105.873821183715-0.633821183715225
4105.57106.297642899241-0.727642899240572
5105.62106.267331166569-0.6473311665685
6106.17105.9281897892690.241810210730943
7106.27106.1390303721500.130969627850375
8106.41106.510630050188-0.100630050187622
9106.94106.8524627039660.0875372960338539
10107.16106.9451249948290.214875005171350
11107.32107.2556855689890.0643144310112762
12107.32107.2243440307080.0956559692917247
13107.35107.2134683982030.136531601796802
14107.55107.2473855783350.302614421664536
15107.87107.7014457387280.168554261272077
16108.37107.9857733296040.384226670395938
17108.38107.9261944372640.453805562735537
18107.92107.8390547074920.0809452925079438
19108.03108.0240489675490.00595103245067025
20108.14108.192678992828-0.0526789928279927
21108.3108.428085611452-0.128085611451811
22108.64108.5671192462030.072880753796853
23108.66108.5998318500130.0601681499871106
24109.04108.6175223065000.422477693499861
25109.03108.5804202581890.449579741810914
26109.03108.4957484277200.534251572279602
27109.54108.8620071091100.677992890889782
28109.75109.1535564666580.596443533342424
29109.83109.535645620210.294354379789987
30109.65109.5921810378960.0578189621035373
31109.82109.6399617312010.180038268799287
32109.95109.7990894319120.150910568088020
33110.12109.8851195083370.234880491663495
34110.15110.0435378852050.106462114794691
35110.21110.2066223820800.0033776179204208
36109.99110.076076575316-0.086076575315632
37110.14110.0465763866580.0934236133415222
38110.14110.0679504983620.072049501638196
39110.81110.5318930763040.278106923695657
40110.97110.7759308110150.194069188985225
41110.99110.7950311660930.194968833906884
42109.73110.405717515078-0.675717515077871
43109.81110.524575596146-0.714575596146148
44110.02110.646834277536-0.626834277535977
45110.18110.781896348728-0.601896348728198
46110.21110.979844395797-0.769844395797338
47110.25110.874583246889-0.624583246888643
48110.36110.897595005134-0.537595005133638
49110.51111.028874148157-0.518874148156633
50110.6111.146411784482-0.546411784481903
51110.95111.440832892142-0.490832892142291
52111.18111.627096493483-0.447096493483015
53111.19111.485797609864-0.295797609863907
54111.69111.3948569502650.295143049735447
55111.7111.3023833329540.397616667045815
56111.83111.2007672475360.629232752463572
57111.77111.3624358275170.40756417248266
58111.73111.3543734779660.375626522034444
59112.01111.5132769520300.496723047969836
60111.86111.7544620823420.105537917657683
61112.04111.7971795603970.242820439602715

\begin{tabular}{lllllllll}
\hline
Multiple Linear Regression - Actuals, Interpolation, and Residuals \tabularnewline
Time or Index & Actuals & InterpolationForecast & ResidualsPrediction Error \tabularnewline
1 & 104.89 & 105.293481248395 & -0.403481248395319 \tabularnewline
2 & 105.15 & 105.512503711100 & -0.36250371110043 \tabularnewline
3 & 105.24 & 105.873821183715 & -0.633821183715225 \tabularnewline
4 & 105.57 & 106.297642899241 & -0.727642899240572 \tabularnewline
5 & 105.62 & 106.267331166569 & -0.6473311665685 \tabularnewline
6 & 106.17 & 105.928189789269 & 0.241810210730943 \tabularnewline
7 & 106.27 & 106.139030372150 & 0.130969627850375 \tabularnewline
8 & 106.41 & 106.510630050188 & -0.100630050187622 \tabularnewline
9 & 106.94 & 106.852462703966 & 0.0875372960338539 \tabularnewline
10 & 107.16 & 106.945124994829 & 0.214875005171350 \tabularnewline
11 & 107.32 & 107.255685568989 & 0.0643144310112762 \tabularnewline
12 & 107.32 & 107.224344030708 & 0.0956559692917247 \tabularnewline
13 & 107.35 & 107.213468398203 & 0.136531601796802 \tabularnewline
14 & 107.55 & 107.247385578335 & 0.302614421664536 \tabularnewline
15 & 107.87 & 107.701445738728 & 0.168554261272077 \tabularnewline
16 & 108.37 & 107.985773329604 & 0.384226670395938 \tabularnewline
17 & 108.38 & 107.926194437264 & 0.453805562735537 \tabularnewline
18 & 107.92 & 107.839054707492 & 0.0809452925079438 \tabularnewline
19 & 108.03 & 108.024048967549 & 0.00595103245067025 \tabularnewline
20 & 108.14 & 108.192678992828 & -0.0526789928279927 \tabularnewline
21 & 108.3 & 108.428085611452 & -0.128085611451811 \tabularnewline
22 & 108.64 & 108.567119246203 & 0.072880753796853 \tabularnewline
23 & 108.66 & 108.599831850013 & 0.0601681499871106 \tabularnewline
24 & 109.04 & 108.617522306500 & 0.422477693499861 \tabularnewline
25 & 109.03 & 108.580420258189 & 0.449579741810914 \tabularnewline
26 & 109.03 & 108.495748427720 & 0.534251572279602 \tabularnewline
27 & 109.54 & 108.862007109110 & 0.677992890889782 \tabularnewline
28 & 109.75 & 109.153556466658 & 0.596443533342424 \tabularnewline
29 & 109.83 & 109.53564562021 & 0.294354379789987 \tabularnewline
30 & 109.65 & 109.592181037896 & 0.0578189621035373 \tabularnewline
31 & 109.82 & 109.639961731201 & 0.180038268799287 \tabularnewline
32 & 109.95 & 109.799089431912 & 0.150910568088020 \tabularnewline
33 & 110.12 & 109.885119508337 & 0.234880491663495 \tabularnewline
34 & 110.15 & 110.043537885205 & 0.106462114794691 \tabularnewline
35 & 110.21 & 110.206622382080 & 0.0033776179204208 \tabularnewline
36 & 109.99 & 110.076076575316 & -0.086076575315632 \tabularnewline
37 & 110.14 & 110.046576386658 & 0.0934236133415222 \tabularnewline
38 & 110.14 & 110.067950498362 & 0.072049501638196 \tabularnewline
39 & 110.81 & 110.531893076304 & 0.278106923695657 \tabularnewline
40 & 110.97 & 110.775930811015 & 0.194069188985225 \tabularnewline
41 & 110.99 & 110.795031166093 & 0.194968833906884 \tabularnewline
42 & 109.73 & 110.405717515078 & -0.675717515077871 \tabularnewline
43 & 109.81 & 110.524575596146 & -0.714575596146148 \tabularnewline
44 & 110.02 & 110.646834277536 & -0.626834277535977 \tabularnewline
45 & 110.18 & 110.781896348728 & -0.601896348728198 \tabularnewline
46 & 110.21 & 110.979844395797 & -0.769844395797338 \tabularnewline
47 & 110.25 & 110.874583246889 & -0.624583246888643 \tabularnewline
48 & 110.36 & 110.897595005134 & -0.537595005133638 \tabularnewline
49 & 110.51 & 111.028874148157 & -0.518874148156633 \tabularnewline
50 & 110.6 & 111.146411784482 & -0.546411784481903 \tabularnewline
51 & 110.95 & 111.440832892142 & -0.490832892142291 \tabularnewline
52 & 111.18 & 111.627096493483 & -0.447096493483015 \tabularnewline
53 & 111.19 & 111.485797609864 & -0.295797609863907 \tabularnewline
54 & 111.69 & 111.394856950265 & 0.295143049735447 \tabularnewline
55 & 111.7 & 111.302383332954 & 0.397616667045815 \tabularnewline
56 & 111.83 & 111.200767247536 & 0.629232752463572 \tabularnewline
57 & 111.77 & 111.362435827517 & 0.40756417248266 \tabularnewline
58 & 111.73 & 111.354373477966 & 0.375626522034444 \tabularnewline
59 & 112.01 & 111.513276952030 & 0.496723047969836 \tabularnewline
60 & 111.86 & 111.754462082342 & 0.105537917657683 \tabularnewline
61 & 112.04 & 111.797179560397 & 0.242820439602715 \tabularnewline
\hline
\end{tabular}
%Source: https://freestatistics.org/blog/index.php?pk=58678&T=4

[TABLE]
[ROW][C]Multiple Linear Regression - Actuals, Interpolation, and Residuals[/C][/ROW]
[ROW][C]Time or Index[/C][C]Actuals[/C][C]InterpolationForecast[/C][C]ResidualsPrediction Error[/C][/ROW]
[ROW][C]1[/C][C]104.89[/C][C]105.293481248395[/C][C]-0.403481248395319[/C][/ROW]
[ROW][C]2[/C][C]105.15[/C][C]105.512503711100[/C][C]-0.36250371110043[/C][/ROW]
[ROW][C]3[/C][C]105.24[/C][C]105.873821183715[/C][C]-0.633821183715225[/C][/ROW]
[ROW][C]4[/C][C]105.57[/C][C]106.297642899241[/C][C]-0.727642899240572[/C][/ROW]
[ROW][C]5[/C][C]105.62[/C][C]106.267331166569[/C][C]-0.6473311665685[/C][/ROW]
[ROW][C]6[/C][C]106.17[/C][C]105.928189789269[/C][C]0.241810210730943[/C][/ROW]
[ROW][C]7[/C][C]106.27[/C][C]106.139030372150[/C][C]0.130969627850375[/C][/ROW]
[ROW][C]8[/C][C]106.41[/C][C]106.510630050188[/C][C]-0.100630050187622[/C][/ROW]
[ROW][C]9[/C][C]106.94[/C][C]106.852462703966[/C][C]0.0875372960338539[/C][/ROW]
[ROW][C]10[/C][C]107.16[/C][C]106.945124994829[/C][C]0.214875005171350[/C][/ROW]
[ROW][C]11[/C][C]107.32[/C][C]107.255685568989[/C][C]0.0643144310112762[/C][/ROW]
[ROW][C]12[/C][C]107.32[/C][C]107.224344030708[/C][C]0.0956559692917247[/C][/ROW]
[ROW][C]13[/C][C]107.35[/C][C]107.213468398203[/C][C]0.136531601796802[/C][/ROW]
[ROW][C]14[/C][C]107.55[/C][C]107.247385578335[/C][C]0.302614421664536[/C][/ROW]
[ROW][C]15[/C][C]107.87[/C][C]107.701445738728[/C][C]0.168554261272077[/C][/ROW]
[ROW][C]16[/C][C]108.37[/C][C]107.985773329604[/C][C]0.384226670395938[/C][/ROW]
[ROW][C]17[/C][C]108.38[/C][C]107.926194437264[/C][C]0.453805562735537[/C][/ROW]
[ROW][C]18[/C][C]107.92[/C][C]107.839054707492[/C][C]0.0809452925079438[/C][/ROW]
[ROW][C]19[/C][C]108.03[/C][C]108.024048967549[/C][C]0.00595103245067025[/C][/ROW]
[ROW][C]20[/C][C]108.14[/C][C]108.192678992828[/C][C]-0.0526789928279927[/C][/ROW]
[ROW][C]21[/C][C]108.3[/C][C]108.428085611452[/C][C]-0.128085611451811[/C][/ROW]
[ROW][C]22[/C][C]108.64[/C][C]108.567119246203[/C][C]0.072880753796853[/C][/ROW]
[ROW][C]23[/C][C]108.66[/C][C]108.599831850013[/C][C]0.0601681499871106[/C][/ROW]
[ROW][C]24[/C][C]109.04[/C][C]108.617522306500[/C][C]0.422477693499861[/C][/ROW]
[ROW][C]25[/C][C]109.03[/C][C]108.580420258189[/C][C]0.449579741810914[/C][/ROW]
[ROW][C]26[/C][C]109.03[/C][C]108.495748427720[/C][C]0.534251572279602[/C][/ROW]
[ROW][C]27[/C][C]109.54[/C][C]108.862007109110[/C][C]0.677992890889782[/C][/ROW]
[ROW][C]28[/C][C]109.75[/C][C]109.153556466658[/C][C]0.596443533342424[/C][/ROW]
[ROW][C]29[/C][C]109.83[/C][C]109.53564562021[/C][C]0.294354379789987[/C][/ROW]
[ROW][C]30[/C][C]109.65[/C][C]109.592181037896[/C][C]0.0578189621035373[/C][/ROW]
[ROW][C]31[/C][C]109.82[/C][C]109.639961731201[/C][C]0.180038268799287[/C][/ROW]
[ROW][C]32[/C][C]109.95[/C][C]109.799089431912[/C][C]0.150910568088020[/C][/ROW]
[ROW][C]33[/C][C]110.12[/C][C]109.885119508337[/C][C]0.234880491663495[/C][/ROW]
[ROW][C]34[/C][C]110.15[/C][C]110.043537885205[/C][C]0.106462114794691[/C][/ROW]
[ROW][C]35[/C][C]110.21[/C][C]110.206622382080[/C][C]0.0033776179204208[/C][/ROW]
[ROW][C]36[/C][C]109.99[/C][C]110.076076575316[/C][C]-0.086076575315632[/C][/ROW]
[ROW][C]37[/C][C]110.14[/C][C]110.046576386658[/C][C]0.0934236133415222[/C][/ROW]
[ROW][C]38[/C][C]110.14[/C][C]110.067950498362[/C][C]0.072049501638196[/C][/ROW]
[ROW][C]39[/C][C]110.81[/C][C]110.531893076304[/C][C]0.278106923695657[/C][/ROW]
[ROW][C]40[/C][C]110.97[/C][C]110.775930811015[/C][C]0.194069188985225[/C][/ROW]
[ROW][C]41[/C][C]110.99[/C][C]110.795031166093[/C][C]0.194968833906884[/C][/ROW]
[ROW][C]42[/C][C]109.73[/C][C]110.405717515078[/C][C]-0.675717515077871[/C][/ROW]
[ROW][C]43[/C][C]109.81[/C][C]110.524575596146[/C][C]-0.714575596146148[/C][/ROW]
[ROW][C]44[/C][C]110.02[/C][C]110.646834277536[/C][C]-0.626834277535977[/C][/ROW]
[ROW][C]45[/C][C]110.18[/C][C]110.781896348728[/C][C]-0.601896348728198[/C][/ROW]
[ROW][C]46[/C][C]110.21[/C][C]110.979844395797[/C][C]-0.769844395797338[/C][/ROW]
[ROW][C]47[/C][C]110.25[/C][C]110.874583246889[/C][C]-0.624583246888643[/C][/ROW]
[ROW][C]48[/C][C]110.36[/C][C]110.897595005134[/C][C]-0.537595005133638[/C][/ROW]
[ROW][C]49[/C][C]110.51[/C][C]111.028874148157[/C][C]-0.518874148156633[/C][/ROW]
[ROW][C]50[/C][C]110.6[/C][C]111.146411784482[/C][C]-0.546411784481903[/C][/ROW]
[ROW][C]51[/C][C]110.95[/C][C]111.440832892142[/C][C]-0.490832892142291[/C][/ROW]
[ROW][C]52[/C][C]111.18[/C][C]111.627096493483[/C][C]-0.447096493483015[/C][/ROW]
[ROW][C]53[/C][C]111.19[/C][C]111.485797609864[/C][C]-0.295797609863907[/C][/ROW]
[ROW][C]54[/C][C]111.69[/C][C]111.394856950265[/C][C]0.295143049735447[/C][/ROW]
[ROW][C]55[/C][C]111.7[/C][C]111.302383332954[/C][C]0.397616667045815[/C][/ROW]
[ROW][C]56[/C][C]111.83[/C][C]111.200767247536[/C][C]0.629232752463572[/C][/ROW]
[ROW][C]57[/C][C]111.77[/C][C]111.362435827517[/C][C]0.40756417248266[/C][/ROW]
[ROW][C]58[/C][C]111.73[/C][C]111.354373477966[/C][C]0.375626522034444[/C][/ROW]
[ROW][C]59[/C][C]112.01[/C][C]111.513276952030[/C][C]0.496723047969836[/C][/ROW]
[ROW][C]60[/C][C]111.86[/C][C]111.754462082342[/C][C]0.105537917657683[/C][/ROW]
[ROW][C]61[/C][C]112.04[/C][C]111.797179560397[/C][C]0.242820439602715[/C][/ROW]
[/TABLE]
Source: https://freestatistics.org/blog/index.php?pk=58678&T=4

Globally Unique Identifier (entire table): ba.freestatistics.org/blog/index.php?pk=58678&T=4

As an alternative you can also use a QR Code:  

The GUIDs for individual cells are displayed in the table below:

Multiple Linear Regression - Actuals, Interpolation, and Residuals
Time or IndexActualsInterpolationForecastResidualsPrediction Error
1104.89105.293481248395-0.403481248395319
2105.15105.512503711100-0.36250371110043
3105.24105.873821183715-0.633821183715225
4105.57106.297642899241-0.727642899240572
5105.62106.267331166569-0.6473311665685
6106.17105.9281897892690.241810210730943
7106.27106.1390303721500.130969627850375
8106.41106.510630050188-0.100630050187622
9106.94106.8524627039660.0875372960338539
10107.16106.9451249948290.214875005171350
11107.32107.2556855689890.0643144310112762
12107.32107.2243440307080.0956559692917247
13107.35107.2134683982030.136531601796802
14107.55107.2473855783350.302614421664536
15107.87107.7014457387280.168554261272077
16108.37107.9857733296040.384226670395938
17108.38107.9261944372640.453805562735537
18107.92107.8390547074920.0809452925079438
19108.03108.0240489675490.00595103245067025
20108.14108.192678992828-0.0526789928279927
21108.3108.428085611452-0.128085611451811
22108.64108.5671192462030.072880753796853
23108.66108.5998318500130.0601681499871106
24109.04108.6175223065000.422477693499861
25109.03108.5804202581890.449579741810914
26109.03108.4957484277200.534251572279602
27109.54108.8620071091100.677992890889782
28109.75109.1535564666580.596443533342424
29109.83109.535645620210.294354379789987
30109.65109.5921810378960.0578189621035373
31109.82109.6399617312010.180038268799287
32109.95109.7990894319120.150910568088020
33110.12109.8851195083370.234880491663495
34110.15110.0435378852050.106462114794691
35110.21110.2066223820800.0033776179204208
36109.99110.076076575316-0.086076575315632
37110.14110.0465763866580.0934236133415222
38110.14110.0679504983620.072049501638196
39110.81110.5318930763040.278106923695657
40110.97110.7759308110150.194069188985225
41110.99110.7950311660930.194968833906884
42109.73110.405717515078-0.675717515077871
43109.81110.524575596146-0.714575596146148
44110.02110.646834277536-0.626834277535977
45110.18110.781896348728-0.601896348728198
46110.21110.979844395797-0.769844395797338
47110.25110.874583246889-0.624583246888643
48110.36110.897595005134-0.537595005133638
49110.51111.028874148157-0.518874148156633
50110.6111.146411784482-0.546411784481903
51110.95111.440832892142-0.490832892142291
52111.18111.627096493483-0.447096493483015
53111.19111.485797609864-0.295797609863907
54111.69111.3948569502650.295143049735447
55111.7111.3023833329540.397616667045815
56111.83111.2007672475360.629232752463572
57111.77111.3624358275170.40756417248266
58111.73111.3543734779660.375626522034444
59112.01111.5132769520300.496723047969836
60111.86111.7544620823420.105537917657683
61112.04111.7971795603970.242820439602715


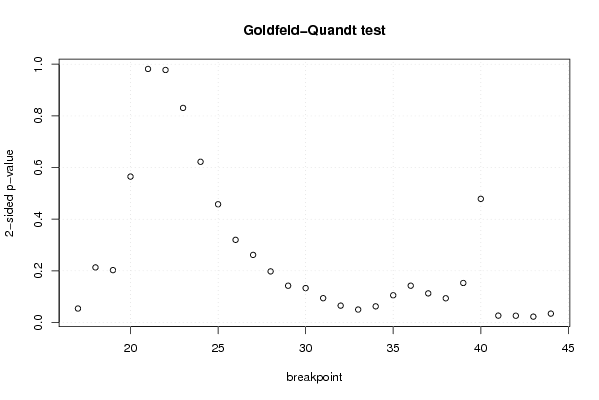
Goldfeld-Quandt test for Heteroskedasticity
p-valuesAlternative Hypothesis
breakpoint indexgreater2-sidedless
170.02707353849236530.05414707698473050.972926461507635
180.1066587703371420.2133175406742840.893341229662858
190.1014615269051730.2029230538103460.898538473094827
200.2824888127578860.5649776255157710.717511187242114
210.5091136525463520.9817726949072970.490886347453648
220.4889353709692720.9778707419385450.511064629030728
230.4154026224988760.8308052449977530.584597377501124
240.3111842420227230.6223684840454460.688815757977277
250.2289336049888700.4578672099777400.77106639501113
260.1600672679470150.3201345358940310.839932732052985
270.1309060543677870.2618121087355750.869093945632213
280.09897910199905970.1979582039981190.90102089800094
290.0712111585403580.1424223170807160.928788841459642
300.06664767769757940.1332953553951590.93335232230242
310.04711736244410030.09423472488820070.9528826375559
320.03268339121838910.06536678243677820.967316608781611
330.02509756001395920.05019512002791840.974902439986041
340.03128579710265150.0625715942053030.968714202897349
350.05273020619927540.1054604123985510.947269793800725
360.07126536754980660.1425307350996130.928734632450193
370.05641138922885520.1128227784577100.943588610771145
380.04693777821993350.0938755564398670.953062221780066
390.0765812199987530.1531624399975060.923418780001247
400.2394178016756530.4788356033513060.760582198324347
410.9866557043871360.02668859122572840.0133442956128642
420.9868758564657750.02624828706845070.0131241435342253
430.9886482979336550.02270340413269070.0113517020663453
440.9827614884938780.03447702301224430.0172385115061221

\begin{tabular}{lllllllll}
\hline
Goldfeld-Quandt test for Heteroskedasticity \tabularnewline
p-values & Alternative Hypothesis \tabularnewline
breakpoint index & greater & 2-sided & less \tabularnewline
17 & 0.0270735384923653 & 0.0541470769847305 & 0.972926461507635 \tabularnewline
18 & 0.106658770337142 & 0.213317540674284 & 0.893341229662858 \tabularnewline
19 & 0.101461526905173 & 0.202923053810346 & 0.898538473094827 \tabularnewline
20 & 0.282488812757886 & 0.564977625515771 & 0.717511187242114 \tabularnewline
21 & 0.509113652546352 & 0.981772694907297 & 0.490886347453648 \tabularnewline
22 & 0.488935370969272 & 0.977870741938545 & 0.511064629030728 \tabularnewline
23 & 0.415402622498876 & 0.830805244997753 & 0.584597377501124 \tabularnewline
24 & 0.311184242022723 & 0.622368484045446 & 0.688815757977277 \tabularnewline
25 & 0.228933604988870 & 0.457867209977740 & 0.77106639501113 \tabularnewline
26 & 0.160067267947015 & 0.320134535894031 & 0.839932732052985 \tabularnewline
27 & 0.130906054367787 & 0.261812108735575 & 0.869093945632213 \tabularnewline
28 & 0.0989791019990597 & 0.197958203998119 & 0.90102089800094 \tabularnewline
29 & 0.071211158540358 & 0.142422317080716 & 0.928788841459642 \tabularnewline
30 & 0.0666476776975794 & 0.133295355395159 & 0.93335232230242 \tabularnewline
31 & 0.0471173624441003 & 0.0942347248882007 & 0.9528826375559 \tabularnewline
32 & 0.0326833912183891 & 0.0653667824367782 & 0.967316608781611 \tabularnewline
33 & 0.0250975600139592 & 0.0501951200279184 & 0.974902439986041 \tabularnewline
34 & 0.0312857971026515 & 0.062571594205303 & 0.968714202897349 \tabularnewline
35 & 0.0527302061992754 & 0.105460412398551 & 0.947269793800725 \tabularnewline
36 & 0.0712653675498066 & 0.142530735099613 & 0.928734632450193 \tabularnewline
37 & 0.0564113892288552 & 0.112822778457710 & 0.943588610771145 \tabularnewline
38 & 0.0469377782199335 & 0.093875556439867 & 0.953062221780066 \tabularnewline
39 & 0.076581219998753 & 0.153162439997506 & 0.923418780001247 \tabularnewline
40 & 0.239417801675653 & 0.478835603351306 & 0.760582198324347 \tabularnewline
41 & 0.986655704387136 & 0.0266885912257284 & 0.0133442956128642 \tabularnewline
42 & 0.986875856465775 & 0.0262482870684507 & 0.0131241435342253 \tabularnewline
43 & 0.988648297933655 & 0.0227034041326907 & 0.0113517020663453 \tabularnewline
44 & 0.982761488493878 & 0.0344770230122443 & 0.0172385115061221 \tabularnewline
\hline
\end{tabular}
%Source: https://freestatistics.org/blog/index.php?pk=58678&T=5

[TABLE]
[ROW][C]Goldfeld-Quandt test for Heteroskedasticity[/C][/ROW]
[ROW][C]p-values[/C][C]Alternative Hypothesis[/C][/ROW]
[ROW][C]breakpoint index[/C][C]greater[/C][C]2-sided[/C][C]less[/C][/ROW]
[ROW][C]17[/C][C]0.0270735384923653[/C][C]0.0541470769847305[/C][C]0.972926461507635[/C][/ROW]
[ROW][C]18[/C][C]0.106658770337142[/C][C]0.213317540674284[/C][C]0.893341229662858[/C][/ROW]
[ROW][C]19[/C][C]0.101461526905173[/C][C]0.202923053810346[/C][C]0.898538473094827[/C][/ROW]
[ROW][C]20[/C][C]0.282488812757886[/C][C]0.564977625515771[/C][C]0.717511187242114[/C][/ROW]
[ROW][C]21[/C][C]0.509113652546352[/C][C]0.981772694907297[/C][C]0.490886347453648[/C][/ROW]
[ROW][C]22[/C][C]0.488935370969272[/C][C]0.977870741938545[/C][C]0.511064629030728[/C][/ROW]
[ROW][C]23[/C][C]0.415402622498876[/C][C]0.830805244997753[/C][C]0.584597377501124[/C][/ROW]
[ROW][C]24[/C][C]0.311184242022723[/C][C]0.622368484045446[/C][C]0.688815757977277[/C][/ROW]
[ROW][C]25[/C][C]0.228933604988870[/C][C]0.457867209977740[/C][C]0.77106639501113[/C][/ROW]
[ROW][C]26[/C][C]0.160067267947015[/C][C]0.320134535894031[/C][C]0.839932732052985[/C][/ROW]
[ROW][C]27[/C][C]0.130906054367787[/C][C]0.261812108735575[/C][C]0.869093945632213[/C][/ROW]
[ROW][C]28[/C][C]0.0989791019990597[/C][C]0.197958203998119[/C][C]0.90102089800094[/C][/ROW]
[ROW][C]29[/C][C]0.071211158540358[/C][C]0.142422317080716[/C][C]0.928788841459642[/C][/ROW]
[ROW][C]30[/C][C]0.0666476776975794[/C][C]0.133295355395159[/C][C]0.93335232230242[/C][/ROW]
[ROW][C]31[/C][C]0.0471173624441003[/C][C]0.0942347248882007[/C][C]0.9528826375559[/C][/ROW]
[ROW][C]32[/C][C]0.0326833912183891[/C][C]0.0653667824367782[/C][C]0.967316608781611[/C][/ROW]
[ROW][C]33[/C][C]0.0250975600139592[/C][C]0.0501951200279184[/C][C]0.974902439986041[/C][/ROW]
[ROW][C]34[/C][C]0.0312857971026515[/C][C]0.062571594205303[/C][C]0.968714202897349[/C][/ROW]
[ROW][C]35[/C][C]0.0527302061992754[/C][C]0.105460412398551[/C][C]0.947269793800725[/C][/ROW]
[ROW][C]36[/C][C]0.0712653675498066[/C][C]0.142530735099613[/C][C]0.928734632450193[/C][/ROW]
[ROW][C]37[/C][C]0.0564113892288552[/C][C]0.112822778457710[/C][C]0.943588610771145[/C][/ROW]
[ROW][C]38[/C][C]0.0469377782199335[/C][C]0.093875556439867[/C][C]0.953062221780066[/C][/ROW]
[ROW][C]39[/C][C]0.076581219998753[/C][C]0.153162439997506[/C][C]0.923418780001247[/C][/ROW]
[ROW][C]40[/C][C]0.239417801675653[/C][C]0.478835603351306[/C][C]0.760582198324347[/C][/ROW]
[ROW][C]41[/C][C]0.986655704387136[/C][C]0.0266885912257284[/C][C]0.0133442956128642[/C][/ROW]
[ROW][C]42[/C][C]0.986875856465775[/C][C]0.0262482870684507[/C][C]0.0131241435342253[/C][/ROW]
[ROW][C]43[/C][C]0.988648297933655[/C][C]0.0227034041326907[/C][C]0.0113517020663453[/C][/ROW]
[ROW][C]44[/C][C]0.982761488493878[/C][C]0.0344770230122443[/C][C]0.0172385115061221[/C][/ROW]
[/TABLE]
Source: https://freestatistics.org/blog/index.php?pk=58678&T=5

Globally Unique Identifier (entire table): ba.freestatistics.org/blog/index.php?pk=58678&T=5

As an alternative you can also use a QR Code:  

The GUIDs for individual cells are displayed in the table below:

Goldfeld-Quandt test for Heteroskedasticity
p-valuesAlternative Hypothesis
breakpoint indexgreater2-sidedless
170.02707353849236530.05414707698473050.972926461507635
180.1066587703371420.2133175406742840.893341229662858
190.1014615269051730.2029230538103460.898538473094827
200.2824888127578860.5649776255157710.717511187242114
210.5091136525463520.9817726949072970.490886347453648
220.4889353709692720.9778707419385450.511064629030728
230.4154026224988760.8308052449977530.584597377501124
240.3111842420227230.6223684840454460.688815757977277
250.2289336049888700.4578672099777400.77106639501113
260.1600672679470150.3201345358940310.839932732052985
270.1309060543677870.2618121087355750.869093945632213
280.09897910199905970.1979582039981190.90102089800094
290.0712111585403580.1424223170807160.928788841459642
300.06664767769757940.1332953553951590.93335232230242
310.04711736244410030.09423472488820070.9528826375559
320.03268339121838910.06536678243677820.967316608781611
330.02509756001395920.05019512002791840.974902439986041
340.03128579710265150.0625715942053030.968714202897349
350.05273020619927540.1054604123985510.947269793800725
360.07126536754980660.1425307350996130.928734632450193
370.05641138922885520.1128227784577100.943588610771145
380.04693777821993350.0938755564398670.953062221780066
390.0765812199987530.1531624399975060.923418780001247
400.2394178016756530.4788356033513060.760582198324347
410.9866557043871360.02668859122572840.0133442956128642
420.9868758564657750.02624828706845070.0131241435342253
430.9886482979336550.02270340413269070.0113517020663453
440.9827614884938780.03447702301224430.0172385115061221


Meta Analysis of Goldfeld-Quandt test for Heteroskedasticity
Description# significant tests% significant testsOK/NOK
1% type I error level00OK
5% type I error level40.142857142857143NOK
10% type I error level100.357142857142857NOK

\begin{tabular}{lllllllll}
\hline
Meta Analysis of Goldfeld-Quandt test for Heteroskedasticity \tabularnewline
Description & # significant tests & % significant tests & OK/NOK \tabularnewline
1% type I error level & 0 & 0 & OK \tabularnewline
5% type I error level & 4 & 0.142857142857143 & NOK \tabularnewline
10% type I error level & 10 & 0.357142857142857 & NOK \tabularnewline
\hline
\end{tabular}
%Source: https://freestatistics.org/blog/index.php?pk=58678&T=6

[TABLE]
[ROW][C]Meta Analysis of Goldfeld-Quandt test for Heteroskedasticity[/C][/ROW]
[ROW][C]Description[/C][C]# significant tests[/C][C]% significant tests[/C][C]OK/NOK[/C][/ROW]
[ROW][C]1% type I error level[/C][C]0[/C][C]0[/C][C]OK[/C][/ROW]
[ROW][C]5% type I error level[/C][C]4[/C][C]0.142857142857143[/C][C]NOK[/C][/ROW]
[ROW][C]10% type I error level[/C][C]10[/C][C]0.357142857142857[/C][C]NOK[/C][/ROW]
[/TABLE]
Source: https://freestatistics.org/blog/index.php?pk=58678&T=6

Globally Unique Identifier (entire table): ba.freestatistics.org/blog/index.php?pk=58678&T=6

As an alternative you can also use a QR Code:  

The GUIDs for individual cells are displayed in the table below:

Meta Analysis of Goldfeld-Quandt test for Heteroskedasticity
Description# significant tests% significant testsOK/NOK
1% type I error level00OK
5% type I error level40.142857142857143NOK
10% type I error level100.357142857142857NOK


Parameters (Session):
par1 = 1 ; par2 = Include Monthly Dummies ; par3 = Linear Trend ;
Parameters (R input):
par1 = 1 ; par2 = Include Monthly Dummies ; par3 = Linear Trend ;
R code (references can be found in the software module):
library(lattice)
library(lmtest)
n25 <- 25 #minimum number of obs. for Goldfeld-Quandt test
par1 <- as.numeric(par1)
x <- t(y)
k <- length(x[1,])
n <- length(x[,1])
x1 <- cbind(x[,par1], x[,1:k!=par1])
mycolnames <- c(colnames(x)[par1], colnames(x)[1:k!=par1])
colnames(x1) <- mycolnames #colnames(x)[par1]
x <- x1
if (par3 == 'First Differences'){
x2 <- array(0, dim=c(n-1,k), dimnames=list(1:(n-1), paste('(1-B)',colnames(x),sep='')))
for (i in 1:n-1) {
for (j in 1:k) {
x2[i,j] <- x[i+1,j] - x[i,j]
}
}
x <- x2
}
if (par2 == 'Include Monthly Dummies'){
x2 <- array(0, dim=c(n,11), dimnames=list(1:n, paste('M', seq(1:11), sep ='')))
for (i in 1:11){
x2[seq(i,n,12),i] <- 1
}
x <- cbind(x, x2)
}
if (par2 == 'Include Quarterly Dummies'){
x2 <- array(0, dim=c(n,3), dimnames=list(1:n, paste('Q', seq(1:3), sep ='')))
for (i in 1:3){
x2[seq(i,n,4),i] <- 1
}
x <- cbind(x, x2)
}
k <- length(x[1,])
if (par3 == 'Linear Trend'){
x <- cbind(x, c(1:n))
colnames(x)[k+1] <- 't'
}
x
k <- length(x[1,])
df <- as.data.frame(x)
(mylm <- lm(df))
(mysum <- summary(mylm))
if (n > n25) {
kp3 <- k + 3
nmkm3 <- n - k - 3
gqarr <- array(NA, dim=c(nmkm3-kp3+1,3))
numgqtests <- 0
numsignificant1 <- 0
numsignificant5 <- 0
numsignificant10 <- 0
for (mypoint in kp3:nmkm3) {
j <- 0
numgqtests <- numgqtests + 1
for (myalt in c('greater', 'two.sided', 'less')) {
j <- j + 1
gqarr[mypoint-kp3+1,j] <- gqtest(mylm, point=mypoint, alternative=myalt)$p.value
}
if (gqarr[mypoint-kp3+1,2] < 0.01) numsignificant1 <- numsignificant1 + 1
if (gqarr[mypoint-kp3+1,2] < 0.05) numsignificant5 <- numsignificant5 + 1
if (gqarr[mypoint-kp3+1,2] < 0.10) numsignificant10 <- numsignificant10 + 1
}
gqarr
}
bitmap(file='test0.png')
plot(x[,1], type='l', main='Actuals and Interpolation', ylab='value of Actuals and Interpolation (dots)', xlab='time or index')
points(x[,1]-mysum$resid)
grid()
dev.off()
bitmap(file='test1.png')
plot(mysum$resid, type='b', pch=19, main='Residuals', ylab='value of Residuals', xlab='time or index')
grid()
dev.off()
bitmap(file='test2.png')
hist(mysum$resid, main='Residual Histogram', xlab='values of Residuals')
grid()
dev.off()
bitmap(file='test3.png')
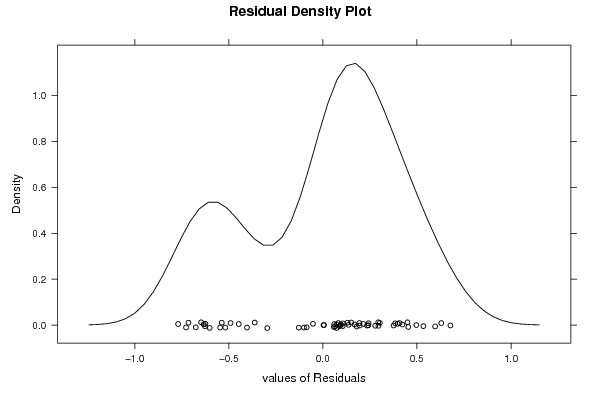
densityplot(~mysum$resid,col='black',main='Residual Density Plot', xlab='values of Residuals')
dev.off()
bitmap(file='test4.png')
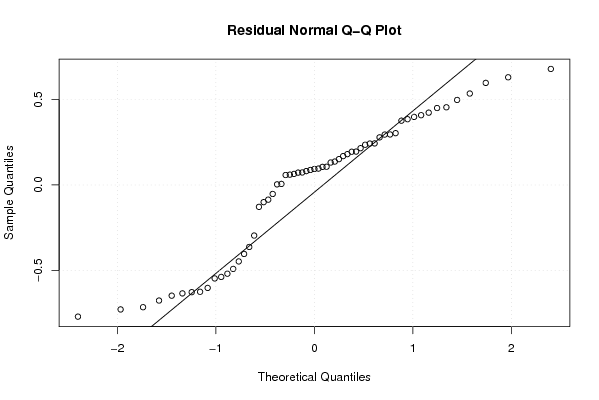
qqnorm(mysum$resid, main='Residual Normal Q-Q Plot')
qqline(mysum$resid)
grid()
dev.off()
(myerror <- as.ts(mysum$resid))
bitmap(file='test5.png')
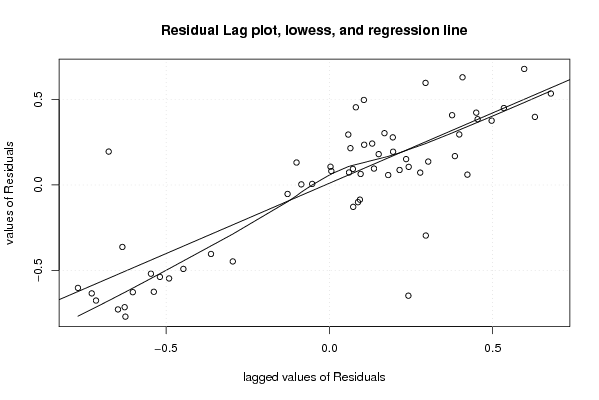
dum <- cbind(lag(myerror,k=1),myerror)
dum
dum1 <- dum[2:length(myerror),]
dum1
z <- as.data.frame(dum1)
z
plot(z,main=paste('Residual Lag plot, lowess, and regression line'), ylab='values of Residuals', xlab='lagged values of Residuals')
lines(lowess(z))
abline(lm(z))
grid()
dev.off()
bitmap(file='test6.png')
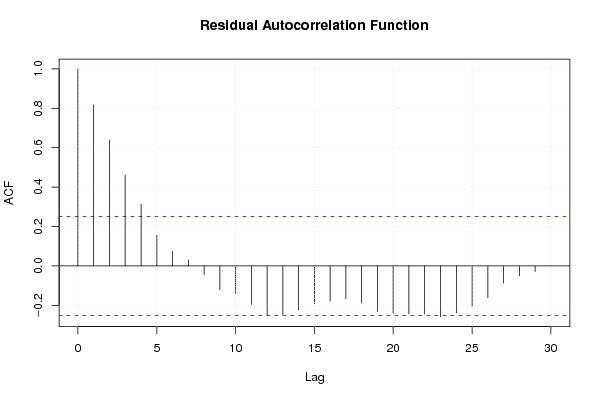
acf(mysum$resid, lag.max=length(mysum$resid)/2, main='Residual Autocorrelation Function')
grid()
dev.off()
bitmap(file='test7.png')
pacf(mysum$resid, lag.max=length(mysum$resid)/2, main='Residual Partial Autocorrelation Function')
grid()
dev.off()
bitmap(file='test8.png')
opar <- par(mfrow = c(2,2), oma = c(0, 0, 1.1, 0))
plot(mylm, las = 1, sub='Residual Diagnostics')
par(opar)
dev.off()
if (n > n25) {
bitmap(file='test9.png')
plot(kp3:nmkm3,gqarr[,2], main='Goldfeld-Quandt test',ylab='2-sided p-value',xlab='breakpoint')
grid()
dev.off()
}
load(file='createtable')
a<-table.start()
a<-table.row.start(a)
a<-table.element(a, 'Multiple Linear Regression - Estimated Regression Equation', 1, TRUE)
a<-table.row.end(a)
myeq <- colnames(x)[1]
myeq <- paste(myeq, '[t] = ', sep='')
for (i in 1:k){
if (mysum$coefficients[i,1] > 0) myeq <- paste(myeq, '+', '')
myeq <- paste(myeq, mysum$coefficients[i,1], sep=' ')
if (rownames(mysum$coefficients)[i] != '(Intercept)') {
myeq <- paste(myeq, rownames(mysum$coefficients)[i], sep='')
if (rownames(mysum$coefficients)[i] != 't') myeq <- paste(myeq, '[t]', sep='')
}
}
myeq <- paste(myeq, ' + e[t]')
a<-table.row.start(a)
a<-table.element(a, myeq)
a<-table.row.end(a)
a<-table.end(a)
table.save(a,file='mytable1.tab')
a<-table.start()
a<-table.row.start(a)
a<-table.element(a,hyperlink('ols1.htm','Multiple Linear Regression - Ordinary Least Squares',''), 6, TRUE)
a<-table.row.end(a)
a<-table.row.start(a)
a<-table.element(a,'Variable',header=TRUE)
a<-table.element(a,'Parameter',header=TRUE)
a<-table.element(a,'S.D.',header=TRUE)
a<-table.element(a,'T-STAT
H0: parameter = 0',header=TRUE)
a<-table.element(a,'2-tail p-value',header=TRUE)
a<-table.element(a,'1-tail p-value',header=TRUE)
a<-table.row.end(a)
for (i in 1:k){
a<-table.row.start(a)
a<-table.element(a,rownames(mysum$coefficients)[i],header=TRUE)
a<-table.element(a,mysum$coefficients[i,1])
a<-table.element(a, round(mysum$coefficients[i,2],6))
a<-table.element(a, round(mysum$coefficients[i,3],4))
a<-table.element(a, round(mysum$coefficients[i,4],6))
a<-table.element(a, round(mysum$coefficients[i,4]/2,6))
a<-table.row.end(a)
}
a<-table.end(a)
table.save(a,file='mytable2.tab')
a<-table.start()
a<-table.row.start(a)
a<-table.element(a, 'Multiple Linear Regression - Regression Statistics', 2, TRUE)
a<-table.row.end(a)
a<-table.row.start(a)
a<-table.element(a, 'Multiple R',1,TRUE)
a<-table.element(a, sqrt(mysum$r.squared))
a<-table.row.end(a)
a<-table.row.start(a)
a<-table.element(a, 'R-squared',1,TRUE)
a<-table.element(a, mysum$r.squared)
a<-table.row.end(a)
a<-table.row.start(a)
a<-table.element(a, 'Adjusted R-squared',1,TRUE)
a<-table.element(a, mysum$adj.r.squared)
a<-table.row.end(a)
a<-table.row.start(a)
a<-table.element(a, 'F-TEST (value)',1,TRUE)
a<-table.element(a, mysum$fstatistic[1])
a<-table.row.end(a)
a<-table.row.start(a)
a<-table.element(a, 'F-TEST (DF numerator)',1,TRUE)
a<-table.element(a, mysum$fstatistic[2])
a<-table.row.end(a)
a<-table.row.start(a)
a<-table.element(a, 'F-TEST (DF denominator)',1,TRUE)
a<-table.element(a, mysum$fstatistic[3])
a<-table.row.end(a)
a<-table.row.start(a)
a<-table.element(a, 'p-value',1,TRUE)
a<-table.element(a, 1-pf(mysum$fstatistic[1],mysum$fstatistic[2],mysum$fstatistic[3]))
a<-table.row.end(a)
a<-table.row.start(a)
a<-table.element(a, 'Multiple Linear Regression - Residual Statistics', 2, TRUE)
a<-table.row.end(a)
a<-table.row.start(a)
a<-table.element(a, 'Residual Standard Deviation',1,TRUE)
a<-table.element(a, mysum$sigma)
a<-table.row.end(a)
a<-table.row.start(a)
a<-table.element(a, 'Sum Squared Residuals',1,TRUE)
a<-table.element(a, sum(myerror*myerror))
a<-table.row.end(a)
a<-table.end(a)
table.save(a,file='mytable3.tab')
a<-table.start()
a<-table.row.start(a)
a<-table.element(a, 'Multiple Linear Regression - Actuals, Interpolation, and Residuals', 4, TRUE)
a<-table.row.end(a)
a<-table.row.start(a)
a<-table.element(a, 'Time or Index', 1, TRUE)
a<-table.element(a, 'Actuals', 1, TRUE)
a<-table.element(a, 'Interpolation
Forecast', 1, TRUE)
a<-table.element(a, 'Residuals
Prediction Error', 1, TRUE)
a<-table.row.end(a)
for (i in 1:n) {
a<-table.row.start(a)
a<-table.element(a,i, 1, TRUE)
a<-table.element(a,x[i])
a<-table.element(a,x[i]-mysum$resid[i])
a<-table.element(a,mysum$resid[i])
a<-table.row.end(a)
}
a<-table.end(a)
table.save(a,file='mytable4.tab')
if (n > n25) {
a<-table.start()
a<-table.row.start(a)
a<-table.element(a,'Goldfeld-Quandt test for Heteroskedasticity',4,TRUE)
a<-table.row.end(a)
a<-table.row.start(a)
a<-table.element(a,'p-values',header=TRUE)
a<-table.element(a,'Alternative Hypothesis',3,header=TRUE)
a<-table.row.end(a)
a<-table.row.start(a)
a<-table.element(a,'breakpoint index',header=TRUE)
a<-table.element(a,'greater',header=TRUE)
a<-table.element(a,'2-sided',header=TRUE)
a<-table.element(a,'less',header=TRUE)
a<-table.row.end(a)
for (mypoint in kp3:nmkm3) {
a<-table.row.start(a)
a<-table.element(a,mypoint,header=TRUE)
a<-table.element(a,gqarr[mypoint-kp3+1,1])
a<-table.element(a,gqarr[mypoint-kp3+1,2])
a<-table.element(a,gqarr[mypoint-kp3+1,3])
a<-table.row.end(a)
}
a<-table.end(a)
table.save(a,file='mytable5.tab')
a<-table.start()
a<-table.row.start(a)
a<-table.element(a,'Meta Analysis of Goldfeld-Quandt test for Heteroskedasticity',4,TRUE)
a<-table.row.end(a)
a<-table.row.start(a)
a<-table.element(a,'Description',header=TRUE)
a<-table.element(a,'# significant tests',header=TRUE)
a<-table.element(a,'% significant tests',header=TRUE)
a<-table.element(a,'OK/NOK',header=TRUE)
a<-table.row.end(a)
a<-table.row.start(a)
a<-table.element(a,'1% type I error level',header=TRUE)
a<-table.element(a,numsignificant1)
a<-table.element(a,numsignificant1/numgqtests)
if (numsignificant1/numgqtests < 0.01) dum <- 'OK' else dum <- 'NOK'
a<-table.element(a,dum)
a<-table.row.end(a)
a<-table.row.start(a)
a<-table.element(a,'5% type I error level',header=TRUE)
a<-table.element(a,numsignificant5)
a<-table.element(a,numsignificant5/numgqtests)
if (numsignificant5/numgqtests < 0.05) dum <- 'OK' else dum <- 'NOK'
a<-table.element(a,dum)
a<-table.row.end(a)
a<-table.row.start(a)
a<-table.element(a,'10% type I error level',header=TRUE)
a<-table.element(a,numsignificant10)
a<-table.element(a,numsignificant10/numgqtests)
if (numsignificant10/numgqtests < 0.1) dum <- 'OK' else dum <- 'NOK'
a<-table.element(a,dum)
a<-table.row.end(a)
a<-table.end(a)
table.save(a,file='mytable6.tab')
}