| Multiple Linear Regression - Estimated Regression Equation |
| AKW[t] = + 109.731009518592 -0.0343479895600967AKB[t] + 0.123957829007378t + e[t] |
| Multiple Linear Regression - Ordinary Least Squares | |||||
| Variable | Parameter | S.D. | T-STAT H0: parameter = 0 | 2-tail p-value | 1-tail p-value |
| (Intercept) | 109.731009518592 | 0.696526 | 157.5405 | 0 | 0 |
| AKB | -0.0343479895600967 | 0.006265 | -5.4828 | 1e-06 | 0 |
| t | 0.123957829007378 | 0.004774 | 25.9647 | 0 | 0 |
| Multiple Linear Regression - Regression Statistics | |
| Multiple R | 0.973918245314072 |
| R-squared | 0.948516748555642 |
| Adjusted R-squared | 0.946741464023078 |
| F-TEST (value) | 534.289986285004 |
| F-TEST (DF numerator) | 2 |
| F-TEST (DF denominator) | 58 |
| p-value | 0 |
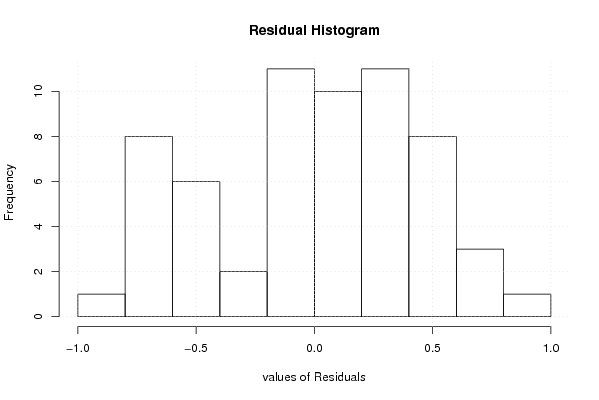
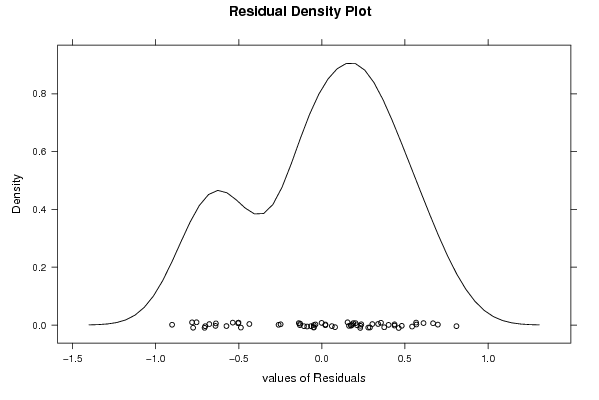
| Multiple Linear Regression - Residual Statistics | |
| Residual Standard Deviation | 0.44716919389781 |
| Sum Squared Residuals | 11.5976967023306 |
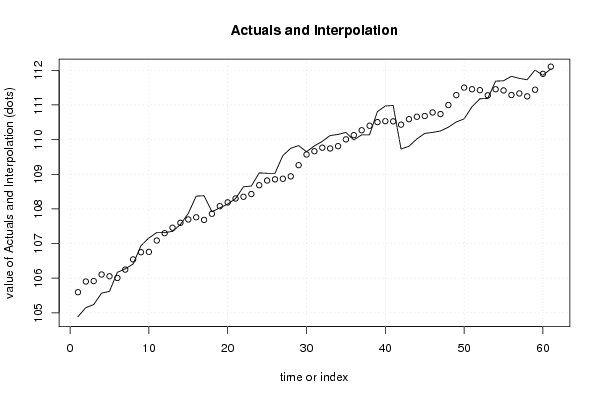
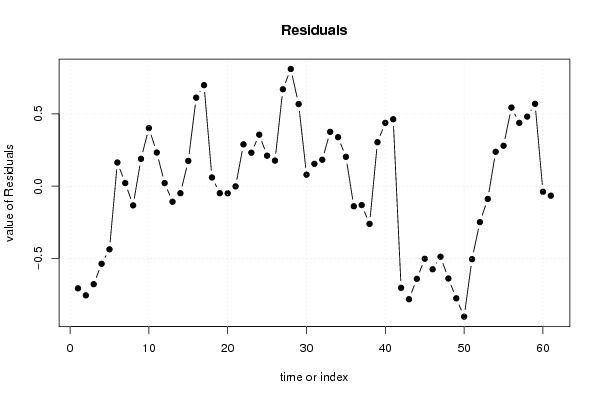
| Multiple Linear Regression - Actuals, Interpolation, and Residuals | |||
| Time or Index | Actuals | Interpolation Forecast | Residuals Prediction Error |
| 1 | 104.89 | 105.595816642147 | -0.705816642147231 |
| 2 | 105.15 | 105.904223175093 | -0.754223175092508 |
| 3 | 105.24 | 105.917236997821 | -0.677236997820783 |
| 4 | 105.57 | 106.106112527097 | -0.536112527096747 |
| 5 | 105.62 | 106.05626952893 | -0.436269528930024 |
| 6 | 106.17 | 106.006426530763 | 0.163573469236684 |
| 7 | 106.27 | 106.248541443857 | 0.0214585561425686 |
| 8 | 106.41 | 106.542521821187 | -0.132521821187287 |
| 9 | 106.94 | 106.750975704512 | 0.189024295487498 |
| 10 | 107.16 | 106.758493848911 | 0.401506151088847 |
| 11 | 107.32 | 107.087509175592 | 0.232490824407689 |
| 12 | 107.32 | 107.298710898082 | 0.0212891019176655 |
| 13 | 107.35 | 107.457360196545 | -0.107360196545409 |
| 14 | 107.55 | 107.598492020333 | -0.0484920203328324 |
| 15 | 107.87 | 107.695314937588 | 0.174685062412274 |
| 16 | 108.37 | 107.758133345178 | 0.611866654821868 |
| 17 | 108.38 | 107.681842395050 | 0.698157604949845 |
| 18 | 107.92 | 107.859726567667 | 0.060273432333121 |
| 19 | 108.03 | 108.078484847860 | -0.048484847860124 |
| 20 | 108.14 | 108.189046960939 | -0.0490469609390653 |
| 21 | 108.3 | 108.301326473496 | -0.00132647349601354 |
| 22 | 108.64 | 108.350749165158 | 0.289250834842022 |
| 23 | 108.66 | 108.428680688155 | 0.23131931184517 |
| 24 | 109.04 | 108.684191317177 | 0.355808682822631 |
| 25 | 109.03 | 108.819140502844 | 0.210859497156017 |
| 26 | 109.03 | 108.853106599204 | 0.176893400796093 |
| 27 | 109.54 | 108.870585660575 | 0.66941433942502 |
| 28 | 109.75 | 108.939930186182 | 0.81006981381819 |
| 29 | 109.83 | 109.262762874742 | 0.567237125257851 |
| 30 | 109.65 | 109.570482447896 | 0.0795175521039623 |
| 31 | 109.82 | 109.665244485777 | 0.154755514222655 |
| 32 | 109.95 | 109.767219601466 | 0.182780398533748 |
| 33 | 110.12 | 109.744511515052 | 0.375488484947985 |
| 34 | 110.15 | 109.811451681390 | 0.338548318610368 |
| 35 | 110.21 | 110.007196808578 | 0.202803191422377 |
| 36 | 109.99 | 110.128750278316 | -0.138750278315793 |
| 37 | 110.14 | 110.270569061894 | -0.130569061894416 |
| 38 | 110.14 | 110.400366049127 | -0.26036604912701 |
| 39 | 110.81 | 110.506119443668 | 0.303880556332466 |
| 40 | 110.97 | 110.532528982324 | 0.437471017675758 |
| 41 | 110.99 | 110.527338370586 | 0.46266162941434 |
| 42 | 109.73 | 110.432156026200 | -0.702156026199612 |
| 43 | 109.81 | 110.591148804558 | -0.781148804558290 |
| 44 | 110.02 | 110.659806370374 | -0.639806370373918 |
| 45 | 110.18 | 110.681407190492 | -0.501407190492198 |
| 46 | 110.21 | 110.784069265972 | -0.574069265972329 |
| 47 | 110.25 | 110.737317586866 | -0.48731758686602 |
| 48 | 110.36 | 110.997636934427 | -0.637636934426982 |
| 49 | 110.51 | 111.284747713845 | -0.774747713844813 |
| 50 | 110.6 | 111.501445114664 | -0.901445114664462 |
| 51 | 110.95 | 111.454006475767 | -0.50400647576695 |
| 52 | 111.18 | 111.428207070292 | -0.248207070292302 |
| 53 | 111.19 | 111.278067942610 | -0.0880679426101177 |
| 54 | 111.69 | 111.452517316271 | 0.237482683729163 |
| 55 | 111.7 | 111.420535272675 | 0.279464727324629 |
| 56 | 111.83 | 111.286883179982 | 0.543116820017972 |
| 57 | 111.77 | 111.332527592792 | 0.437472407207611 |
| 58 | 111.73 | 111.249023564857 | 0.480976435143226 |
| 59 | 112.01 | 111.440990413193 | 0.569009586806857 |
| 60 | 111.86 | 111.898467220829 | -0.0384672208290643 |
| 61 | 112.04 | 112.105547184572 | -0.0655471845718699 |
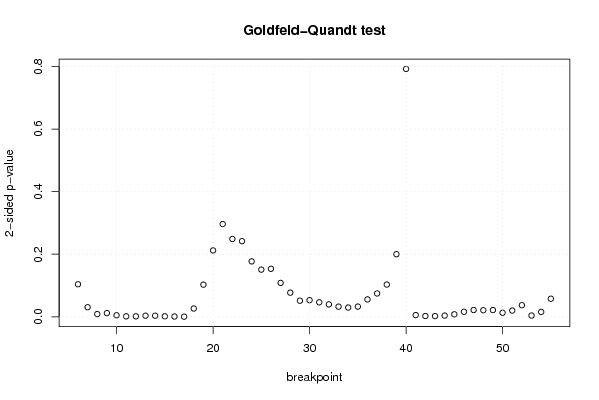
| Goldfeld-Quandt test for Heteroskedasticity | |||
| p-values | Alternative Hypothesis | ||
| breakpoint index | greater | 2-sided | less |
| 6 | 0.052001162738918 | 0.104002325477836 | 0.947998837261082 |
| 7 | 0.0153089586708070 | 0.0306179173416139 | 0.984691041329193 |
| 8 | 0.00436935562053882 | 0.00873871124107763 | 0.99563064437946 |
| 9 | 0.00593000818568103 | 0.0118600163713621 | 0.994069991814319 |
| 10 | 0.00244536509717063 | 0.00489073019434126 | 0.99755463490283 |
| 11 | 0.000736655965447165 | 0.00147331193089433 | 0.999263344034553 |
| 12 | 0.000759462453610602 | 0.00151892490722120 | 0.99924053754639 |
| 13 | 0.00177622226027771 | 0.00355244452055542 | 0.998223777739722 |
| 14 | 0.00174240001777443 | 0.00348480003554885 | 0.998257599982226 |
| 15 | 0.00081407208301982 | 0.00162814416603964 | 0.99918592791698 |
| 16 | 0.000427656445507792 | 0.000855312891015584 | 0.999572343554492 |
| 17 | 0.000251675429203963 | 0.000503350858407926 | 0.999748324570796 |
| 18 | 0.0132807213352121 | 0.0265614426704242 | 0.986719278664788 |
| 19 | 0.0513832772586011 | 0.102766554517202 | 0.948616722741399 |
| 20 | 0.106056278300795 | 0.212112556601589 | 0.893943721699205 |
| 21 | 0.148225362639775 | 0.296450725279550 | 0.851774637360225 |
| 22 | 0.124368979275466 | 0.248737958550932 | 0.875631020724534 |
| 23 | 0.120859639214345 | 0.241719278428689 | 0.879140360785655 |
| 24 | 0.0885585991780521 | 0.177117198356104 | 0.911441400821948 |
| 25 | 0.0753837672491183 | 0.150767534498237 | 0.924616232750882 |
| 26 | 0.0766753704776331 | 0.153350740955266 | 0.923324629522367 |
| 27 | 0.0541794047251646 | 0.108358809450329 | 0.945820595274835 |
| 28 | 0.0385551327242827 | 0.0771102654485654 | 0.961444867275717 |
| 29 | 0.0257146571441168 | 0.0514293142882337 | 0.974285342855883 |
| 30 | 0.0265950858361949 | 0.0531901716723898 | 0.973404914163805 |
| 31 | 0.0231689960488151 | 0.0463379920976302 | 0.976831003951185 |
| 32 | 0.0198376277432300 | 0.0396752554864599 | 0.98016237225677 |
| 33 | 0.0162152467819164 | 0.0324304935638328 | 0.983784753218084 |
| 34 | 0.0147705492908951 | 0.0295410985817901 | 0.985229450709105 |
| 35 | 0.0162989992320634 | 0.0325979984641268 | 0.983701000767937 |
| 36 | 0.0277625199995066 | 0.0555250399990131 | 0.972237480000493 |
| 37 | 0.0373084828935053 | 0.0746169657870105 | 0.962691517106495 |
| 38 | 0.0515280839599898 | 0.103056167919980 | 0.94847191604001 |
| 39 | 0.100041437105112 | 0.200082874210223 | 0.899958562894889 |
| 40 | 0.395983923505107 | 0.791967847010215 | 0.604016076494893 |
| 41 | 0.99724763040462 | 0.00550473919076133 | 0.00275236959538067 |
| 42 | 0.998762002823673 | 0.00247599435265345 | 0.00123799717632673 |
| 43 | 0.9988491605804 | 0.0023016788391994 | 0.0011508394195997 |
| 44 | 0.998036295648763 | 0.00392740870247357 | 0.00196370435123678 |
| 45 | 0.99595237394728 | 0.00809525210544047 | 0.00404762605272023 |
| 46 | 0.991945242775261 | 0.0161095144494779 | 0.00805475722473897 |
| 47 | 0.989148761259929 | 0.0217024774801422 | 0.0108512387400711 |
| 48 | 0.989487638366013 | 0.0210247232679731 | 0.0105123616339866 |
| 49 | 0.989218079717433 | 0.0215638405651334 | 0.0107819202825667 |
| 50 | 0.99352716237443 | 0.0129456752511382 | 0.00647283762556909 |
| 51 | 0.99000608522291 | 0.0199878295541820 | 0.00999391477709102 |
| 52 | 0.981431988031493 | 0.0371360239370138 | 0.0185680119685069 |
| 53 | 0.997980072122548 | 0.00403985575490325 | 0.00201992787745162 |
| 54 | 0.992160737833225 | 0.0156785243335508 | 0.00783926216677538 |
| 55 | 0.971079792632564 | 0.0578404147348727 | 0.0289202073674363 |
| Meta Analysis of Goldfeld-Quandt test for Heteroskedasticity | |||
| Description | # significant tests | % significant tests | OK/NOK |
| 1% type I error level | 15 | 0.3 | NOK |
| 5% type I error level | 31 | 0.62 | NOK |
| 10% type I error level | 37 | 0.74 | NOK |