Free Statistics

of Irreproducible Research!

Author's title

Author*The author of this computation has been verified*
R Software Modulerwasp_multipleregression.wasp
Title produced by softwareMultiple Regression
Date of computationSun, 22 Nov 2009 10:57:53 -0700
Cite this page as followsStatistical Computations at FreeStatistics.org, Office for Research Development and Education, URL https://freestatistics.org/blog/index.php?v=date/2009/Nov/22/t1258912734tb10rqw43xg5hd9.htm/, Retrieved Sun, 28 Apr 2024 17:34:52 +0000
Statistical Computations at FreeStatistics.org, Office for Research Development and Education, URL https://freestatistics.org/blog/index.php?pk=58674, Retrieved Sun, 28 Apr 2024 17:34:52 +0000
QR Codes:

Original text written by user:
IsPrivate?No (this computation is public)
User-defined keywords
Estimated Impact151
Family? (F = Feedback message, R = changed R code, M = changed R Module, P = changed Parameters, D = changed Data)
-       [Multiple Regression] [WS711] [2009-11-22 17:57:53] [b406b824746c89e17d2637b66f6fb2ee] [Current]
Feedback Forum

Post a new message
Dataseries X:
104,89	124
105,15	118,63
105,24	121,86
105,57	119,97
105,62	125,03
106,17	130,09
106,27	126,65
106,41	121,7
106,94	119,24
107,16	122,63
107,32	116,66
107,32	114,12
107,35	113,11
107,55	112,61
107,87	113,4
108,37	115,18
108,38	121,01
107,92	119,44
108,03	116,68
108,14	117,07
108,3	117,41
108,64	119,58
108,66	120,92
109,04	117,09
109,03	116,77
109,03	119,39
109,54	122,49
109,75	124,08
109,83	118,29
109,65	112,94
109,82	113,79
109,95	114,43
110,12	118,7
110,15	120,36
110,21	118,27
109,99	118,34
110,14	117,82
110,14	117,65
110,81	118,18
110,97	121,02
110,99	124,78
109,73	131,16
109,81	130,14
110,02	131,75
110,18	134,73
110,21	135,35
110,25	140,32
110,36	136,35
110,51	131,6
110,6	128,9
110,95	133,89
111,18	138,25
111,19	146,23
111,69	144,76
111,7	149,3
111,83	156,8
111,77	159,08
111,73	165,12
112,01	163,14
111,86	153,43
112,04	151,01


Summary of computational transaction
Raw Inputview raw input (R code)
Raw Outputview raw output of R engine
Computing time4 seconds
R Server'Gwilym Jenkins' @ 72.249.127.135

\begin{tabular}{lllllllll}
\hline
Summary of computational transaction \tabularnewline
Raw Input & view raw input (R code)  \tabularnewline
Raw Output & view raw output of R engine  \tabularnewline
Computing time & 4 seconds \tabularnewline
R Server & 'Gwilym Jenkins' @ 72.249.127.135 \tabularnewline
\hline
\end{tabular}
%Source: https://freestatistics.org/blog/index.php?pk=58674&T=0

[TABLE]
[ROW][C]Summary of computational transaction[/C][/ROW]
[ROW][C]Raw Input[/C][C]view raw input (R code) [/C][/ROW]
[ROW][C]Raw Output[/C][C]view raw output of R engine [/C][/ROW]
[ROW][C]Computing time[/C][C]4 seconds[/C][/ROW]
[ROW][C]R Server[/C][C]'Gwilym Jenkins' @ 72.249.127.135[/C][/ROW]
[/TABLE]
Source: https://freestatistics.org/blog/index.php?pk=58674&T=0

Globally Unique Identifier (entire table): ba.freestatistics.org/blog/index.php?pk=58674&T=0

As an alternative you can also use a QR Code:  

The GUIDs for individual cells are displayed in the table below:

Summary of computational transaction
Raw Inputview raw input (R code)
Raw Outputview raw output of R engine
Computing time4 seconds
R Server'Gwilym Jenkins' @ 72.249.127.135


Multiple Linear Regression - Estimated Regression Equation
AKW[t] = + 98.457446683022 + 0.0847439006773697AKB[t] + e[t]

\begin{tabular}{lllllllll}
\hline
Multiple Linear Regression - Estimated Regression Equation \tabularnewline
AKW[t] =  +  98.457446683022 +  0.0847439006773697AKB[t]  + e[t] \tabularnewline
\hline
\end{tabular}
%Source: https://freestatistics.org/blog/index.php?pk=58674&T=1

[TABLE]
[ROW][C]Multiple Linear Regression - Estimated Regression Equation[/C][/ROW]
[ROW][C]AKW[t] =  +  98.457446683022 +  0.0847439006773697AKB[t]  + e[t][/C][/ROW]
[/TABLE]
Source: https://freestatistics.org/blog/index.php?pk=58674&T=1

Globally Unique Identifier (entire table): ba.freestatistics.org/blog/index.php?pk=58674&T=1

As an alternative you can also use a QR Code:  

The GUIDs for individual cells are displayed in the table below:

Multiple Linear Regression - Estimated Regression Equation
AKW[t] = + 98.457446683022 + 0.0847439006773697AKB[t] + e[t]


Multiple Linear Regression - Ordinary Least Squares
VariableParameterS.D.T-STATH0: parameter = 02-tail p-value1-tail p-value
(Intercept)98.4574466830221.91859951.317400
AKB0.08474390067736970.0150325.63771e-060

\begin{tabular}{lllllllll}
\hline
Multiple Linear Regression - Ordinary Least Squares \tabularnewline
Variable & Parameter & S.D. & T-STATH0: parameter = 0 & 2-tail p-value & 1-tail p-value \tabularnewline
(Intercept) & 98.457446683022 & 1.918599 & 51.3174 & 0 & 0 \tabularnewline
AKB & 0.0847439006773697 & 0.015032 & 5.6377 & 1e-06 & 0 \tabularnewline
\hline
\end{tabular}
%Source: https://freestatistics.org/blog/index.php?pk=58674&T=2

[TABLE]
[ROW][C]Multiple Linear Regression - Ordinary Least Squares[/C][/ROW]
[ROW][C]Variable[/C][C]Parameter[/C][C]S.D.[/C][C]T-STATH0: parameter = 0[/C][C]2-tail p-value[/C][C]1-tail p-value[/C][/ROW]
[ROW][C](Intercept)[/C][C]98.457446683022[/C][C]1.918599[/C][C]51.3174[/C][C]0[/C][C]0[/C][/ROW]
[ROW][C]AKB[/C][C]0.0847439006773697[/C][C]0.015032[/C][C]5.6377[/C][C]1e-06[/C][C]0[/C][/ROW]
[/TABLE]
Source: https://freestatistics.org/blog/index.php?pk=58674&T=2

Globally Unique Identifier (entire table): ba.freestatistics.org/blog/index.php?pk=58674&T=2

As an alternative you can also use a QR Code:  

The GUIDs for individual cells are displayed in the table below:

Multiple Linear Regression - Ordinary Least Squares
VariableParameterS.D.T-STATH0: parameter = 02-tail p-value1-tail p-value
(Intercept)98.4574466830221.91859951.317400
AKB0.08474390067736970.0150325.63771e-060


Multiple Linear Regression - Regression Statistics
Multiple R0.591692965394288
R-squared0.350100565297086
Adjusted R-squared0.339085320641104
F-TEST (value)31.7832763802456
F-TEST (DF numerator)1
F-TEST (DF denominator)59
p-value5.11889629128959e-07
Multiple Linear Regression - Residual Statistics
Residual Standard Deviation1.57525172461769
Sum Squared Residuals146.403661758749

\begin{tabular}{lllllllll}
\hline
Multiple Linear Regression - Regression Statistics \tabularnewline
Multiple R & 0.591692965394288 \tabularnewline
R-squared & 0.350100565297086 \tabularnewline
Adjusted R-squared & 0.339085320641104 \tabularnewline
F-TEST (value) & 31.7832763802456 \tabularnewline
F-TEST (DF numerator) & 1 \tabularnewline
F-TEST (DF denominator) & 59 \tabularnewline
p-value & 5.11889629128959e-07 \tabularnewline
Multiple Linear Regression - Residual Statistics \tabularnewline
Residual Standard Deviation & 1.57525172461769 \tabularnewline
Sum Squared Residuals & 146.403661758749 \tabularnewline
\hline
\end{tabular}
%Source: https://freestatistics.org/blog/index.php?pk=58674&T=3

[TABLE]
[ROW][C]Multiple Linear Regression - Regression Statistics[/C][/ROW]
[ROW][C]Multiple R[/C][C]0.591692965394288[/C][/ROW]
[ROW][C]R-squared[/C][C]0.350100565297086[/C][/ROW]
[ROW][C]Adjusted R-squared[/C][C]0.339085320641104[/C][/ROW]
[ROW][C]F-TEST (value)[/C][C]31.7832763802456[/C][/ROW]
[ROW][C]F-TEST (DF numerator)[/C][C]1[/C][/ROW]
[ROW][C]F-TEST (DF denominator)[/C][C]59[/C][/ROW]
[ROW][C]p-value[/C][C]5.11889629128959e-07[/C][/ROW]
[ROW][C]Multiple Linear Regression - Residual Statistics[/C][/ROW]
[ROW][C]Residual Standard Deviation[/C][C]1.57525172461769[/C][/ROW]
[ROW][C]Sum Squared Residuals[/C][C]146.403661758749[/C][/ROW]
[/TABLE]
Source: https://freestatistics.org/blog/index.php?pk=58674&T=3

Globally Unique Identifier (entire table): ba.freestatistics.org/blog/index.php?pk=58674&T=3

As an alternative you can also use a QR Code:  

The GUIDs for individual cells are displayed in the table below:

Multiple Linear Regression - Regression Statistics
Multiple R0.591692965394288
R-squared0.350100565297086
Adjusted R-squared0.339085320641104
F-TEST (value)31.7832763802456
F-TEST (DF numerator)1
F-TEST (DF denominator)59
p-value5.11889629128959e-07
Multiple Linear Regression - Residual Statistics
Residual Standard Deviation1.57525172461769
Sum Squared Residuals146.403661758749


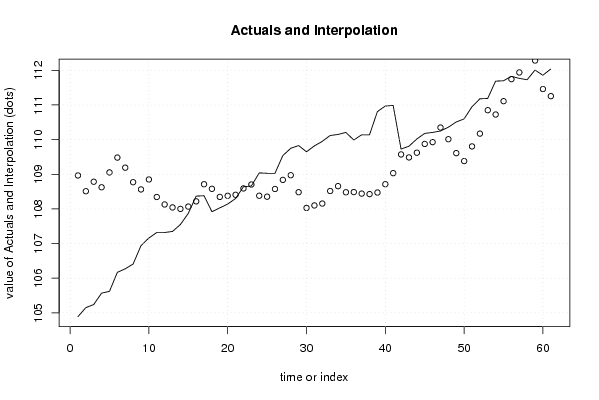
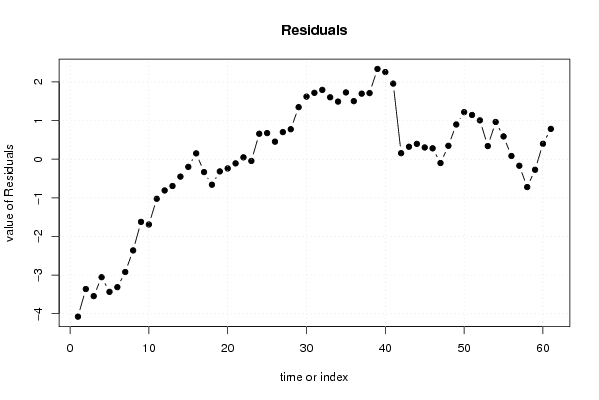
Multiple Linear Regression - Actuals, Interpolation, and Residuals
Time or IndexActualsInterpolationForecastResidualsPrediction Error
1104.89108.965690367016-4.07569036701562
2105.15108.510615620378-3.36061562037827
3105.24108.784338419566-3.54433841956619
4105.57108.624172447286-3.05417244728596
5105.62109.052976584713-3.43297658471344
6106.17109.481780722141-3.31178072214093
7106.27109.190261703811-2.92026170381079
8106.41108.770779395458-2.36077939545781
9106.94108.562309399791-1.62230939979148
10107.16108.849591223088-1.68959122308776
11107.32108.343670136044-1.02367013604387
12107.32108.128420628323-0.808420628323348
13107.35108.042829288639-0.692829288639203
14107.55108.000457338301-0.450457338300515
15107.87108.067405019836-0.197405019835630
16108.37108.2182491630410.151750836958652
17108.38108.712306103990-0.332306103990423
18107.92108.579258179927-0.659258179926946
19108.03108.345365014057-0.315365014057406
20108.14108.378415135322-0.23841513532158
21108.3108.407228061552-0.107228061551890
22108.64108.5911223260220.0488776739782215
23108.66108.704679152929-0.0446791529294583
24109.04108.3801100133350.659889986664877
25109.03108.3529919651180.677008034881631
26109.03108.5750209848930.454979015106922
27109.54108.8377270769930.702272923007081
28109.75108.972469879070.777530120930057
29109.83108.4818026941481.34819730585203
30109.65108.0284228255241.62157717447596
31109.82108.1004551411001.71954485890018
32109.95108.1546912375331.79530876246668
33110.12108.5165476934261.60345230657431
34110.15108.6572225685501.49277743144988
35110.21108.4801078161341.72989218386557
36109.99108.4860398891821.50396011081815
37110.14108.4419730608301.69802693917039
38110.14108.4275665977141.71243340228554
39110.81108.4724808650732.33751913492654
40110.97108.7131535429972.25684645700281
41110.99109.0317906095441.95820939045589
42109.73109.5724566958660.157543304134284
43109.81109.4860179171750.3239820828252
44110.02109.6224555972650.397544402734627
45110.18109.8749924212840.305007578716077
46110.21109.9275336397040.282466360296094
47110.25110.348710826070-0.098710826070427
48110.36110.0122775403810.347722459618730
49110.51109.6097440121640.900255987836242
50110.6109.3809354803351.21906451966513
51110.95109.8038075447151.14619245528506
52111.18110.1732909516681.00670904833173
53111.19110.8495472790740.340452720926316
54111.69110.7249737450780.96502625492205
55111.7111.1097110541530.590288945846794
56111.83111.7452903092330.0847096907665167
57111.77111.938506402778-0.168506402777889
58111.73112.450359562869-0.720359562869193
59112.01112.282566639528-0.272566639527999
60111.86111.4597033639510.400296636049254
61112.04111.2546231243120.785376875688497

\begin{tabular}{lllllllll}
\hline
Multiple Linear Regression - Actuals, Interpolation, and Residuals \tabularnewline
Time or Index & Actuals & InterpolationForecast & ResidualsPrediction Error \tabularnewline
1 & 104.89 & 108.965690367016 & -4.07569036701562 \tabularnewline
2 & 105.15 & 108.510615620378 & -3.36061562037827 \tabularnewline
3 & 105.24 & 108.784338419566 & -3.54433841956619 \tabularnewline
4 & 105.57 & 108.624172447286 & -3.05417244728596 \tabularnewline
5 & 105.62 & 109.052976584713 & -3.43297658471344 \tabularnewline
6 & 106.17 & 109.481780722141 & -3.31178072214093 \tabularnewline
7 & 106.27 & 109.190261703811 & -2.92026170381079 \tabularnewline
8 & 106.41 & 108.770779395458 & -2.36077939545781 \tabularnewline
9 & 106.94 & 108.562309399791 & -1.62230939979148 \tabularnewline
10 & 107.16 & 108.849591223088 & -1.68959122308776 \tabularnewline
11 & 107.32 & 108.343670136044 & -1.02367013604387 \tabularnewline
12 & 107.32 & 108.128420628323 & -0.808420628323348 \tabularnewline
13 & 107.35 & 108.042829288639 & -0.692829288639203 \tabularnewline
14 & 107.55 & 108.000457338301 & -0.450457338300515 \tabularnewline
15 & 107.87 & 108.067405019836 & -0.197405019835630 \tabularnewline
16 & 108.37 & 108.218249163041 & 0.151750836958652 \tabularnewline
17 & 108.38 & 108.712306103990 & -0.332306103990423 \tabularnewline
18 & 107.92 & 108.579258179927 & -0.659258179926946 \tabularnewline
19 & 108.03 & 108.345365014057 & -0.315365014057406 \tabularnewline
20 & 108.14 & 108.378415135322 & -0.23841513532158 \tabularnewline
21 & 108.3 & 108.407228061552 & -0.107228061551890 \tabularnewline
22 & 108.64 & 108.591122326022 & 0.0488776739782215 \tabularnewline
23 & 108.66 & 108.704679152929 & -0.0446791529294583 \tabularnewline
24 & 109.04 & 108.380110013335 & 0.659889986664877 \tabularnewline
25 & 109.03 & 108.352991965118 & 0.677008034881631 \tabularnewline
26 & 109.03 & 108.575020984893 & 0.454979015106922 \tabularnewline
27 & 109.54 & 108.837727076993 & 0.702272923007081 \tabularnewline
28 & 109.75 & 108.97246987907 & 0.777530120930057 \tabularnewline
29 & 109.83 & 108.481802694148 & 1.34819730585203 \tabularnewline
30 & 109.65 & 108.028422825524 & 1.62157717447596 \tabularnewline
31 & 109.82 & 108.100455141100 & 1.71954485890018 \tabularnewline
32 & 109.95 & 108.154691237533 & 1.79530876246668 \tabularnewline
33 & 110.12 & 108.516547693426 & 1.60345230657431 \tabularnewline
34 & 110.15 & 108.657222568550 & 1.49277743144988 \tabularnewline
35 & 110.21 & 108.480107816134 & 1.72989218386557 \tabularnewline
36 & 109.99 & 108.486039889182 & 1.50396011081815 \tabularnewline
37 & 110.14 & 108.441973060830 & 1.69802693917039 \tabularnewline
38 & 110.14 & 108.427566597714 & 1.71243340228554 \tabularnewline
39 & 110.81 & 108.472480865073 & 2.33751913492654 \tabularnewline
40 & 110.97 & 108.713153542997 & 2.25684645700281 \tabularnewline
41 & 110.99 & 109.031790609544 & 1.95820939045589 \tabularnewline
42 & 109.73 & 109.572456695866 & 0.157543304134284 \tabularnewline
43 & 109.81 & 109.486017917175 & 0.3239820828252 \tabularnewline
44 & 110.02 & 109.622455597265 & 0.397544402734627 \tabularnewline
45 & 110.18 & 109.874992421284 & 0.305007578716077 \tabularnewline
46 & 110.21 & 109.927533639704 & 0.282466360296094 \tabularnewline
47 & 110.25 & 110.348710826070 & -0.098710826070427 \tabularnewline
48 & 110.36 & 110.012277540381 & 0.347722459618730 \tabularnewline
49 & 110.51 & 109.609744012164 & 0.900255987836242 \tabularnewline
50 & 110.6 & 109.380935480335 & 1.21906451966513 \tabularnewline
51 & 110.95 & 109.803807544715 & 1.14619245528506 \tabularnewline
52 & 111.18 & 110.173290951668 & 1.00670904833173 \tabularnewline
53 & 111.19 & 110.849547279074 & 0.340452720926316 \tabularnewline
54 & 111.69 & 110.724973745078 & 0.96502625492205 \tabularnewline
55 & 111.7 & 111.109711054153 & 0.590288945846794 \tabularnewline
56 & 111.83 & 111.745290309233 & 0.0847096907665167 \tabularnewline
57 & 111.77 & 111.938506402778 & -0.168506402777889 \tabularnewline
58 & 111.73 & 112.450359562869 & -0.720359562869193 \tabularnewline
59 & 112.01 & 112.282566639528 & -0.272566639527999 \tabularnewline
60 & 111.86 & 111.459703363951 & 0.400296636049254 \tabularnewline
61 & 112.04 & 111.254623124312 & 0.785376875688497 \tabularnewline
\hline
\end{tabular}
%Source: https://freestatistics.org/blog/index.php?pk=58674&T=4

[TABLE]
[ROW][C]Multiple Linear Regression - Actuals, Interpolation, and Residuals[/C][/ROW]
[ROW][C]Time or Index[/C][C]Actuals[/C][C]InterpolationForecast[/C][C]ResidualsPrediction Error[/C][/ROW]
[ROW][C]1[/C][C]104.89[/C][C]108.965690367016[/C][C]-4.07569036701562[/C][/ROW]
[ROW][C]2[/C][C]105.15[/C][C]108.510615620378[/C][C]-3.36061562037827[/C][/ROW]
[ROW][C]3[/C][C]105.24[/C][C]108.784338419566[/C][C]-3.54433841956619[/C][/ROW]
[ROW][C]4[/C][C]105.57[/C][C]108.624172447286[/C][C]-3.05417244728596[/C][/ROW]
[ROW][C]5[/C][C]105.62[/C][C]109.052976584713[/C][C]-3.43297658471344[/C][/ROW]
[ROW][C]6[/C][C]106.17[/C][C]109.481780722141[/C][C]-3.31178072214093[/C][/ROW]
[ROW][C]7[/C][C]106.27[/C][C]109.190261703811[/C][C]-2.92026170381079[/C][/ROW]
[ROW][C]8[/C][C]106.41[/C][C]108.770779395458[/C][C]-2.36077939545781[/C][/ROW]
[ROW][C]9[/C][C]106.94[/C][C]108.562309399791[/C][C]-1.62230939979148[/C][/ROW]
[ROW][C]10[/C][C]107.16[/C][C]108.849591223088[/C][C]-1.68959122308776[/C][/ROW]
[ROW][C]11[/C][C]107.32[/C][C]108.343670136044[/C][C]-1.02367013604387[/C][/ROW]
[ROW][C]12[/C][C]107.32[/C][C]108.128420628323[/C][C]-0.808420628323348[/C][/ROW]
[ROW][C]13[/C][C]107.35[/C][C]108.042829288639[/C][C]-0.692829288639203[/C][/ROW]
[ROW][C]14[/C][C]107.55[/C][C]108.000457338301[/C][C]-0.450457338300515[/C][/ROW]
[ROW][C]15[/C][C]107.87[/C][C]108.067405019836[/C][C]-0.197405019835630[/C][/ROW]
[ROW][C]16[/C][C]108.37[/C][C]108.218249163041[/C][C]0.151750836958652[/C][/ROW]
[ROW][C]17[/C][C]108.38[/C][C]108.712306103990[/C][C]-0.332306103990423[/C][/ROW]
[ROW][C]18[/C][C]107.92[/C][C]108.579258179927[/C][C]-0.659258179926946[/C][/ROW]
[ROW][C]19[/C][C]108.03[/C][C]108.345365014057[/C][C]-0.315365014057406[/C][/ROW]
[ROW][C]20[/C][C]108.14[/C][C]108.378415135322[/C][C]-0.23841513532158[/C][/ROW]
[ROW][C]21[/C][C]108.3[/C][C]108.407228061552[/C][C]-0.107228061551890[/C][/ROW]
[ROW][C]22[/C][C]108.64[/C][C]108.591122326022[/C][C]0.0488776739782215[/C][/ROW]
[ROW][C]23[/C][C]108.66[/C][C]108.704679152929[/C][C]-0.0446791529294583[/C][/ROW]
[ROW][C]24[/C][C]109.04[/C][C]108.380110013335[/C][C]0.659889986664877[/C][/ROW]
[ROW][C]25[/C][C]109.03[/C][C]108.352991965118[/C][C]0.677008034881631[/C][/ROW]
[ROW][C]26[/C][C]109.03[/C][C]108.575020984893[/C][C]0.454979015106922[/C][/ROW]
[ROW][C]27[/C][C]109.54[/C][C]108.837727076993[/C][C]0.702272923007081[/C][/ROW]
[ROW][C]28[/C][C]109.75[/C][C]108.97246987907[/C][C]0.777530120930057[/C][/ROW]
[ROW][C]29[/C][C]109.83[/C][C]108.481802694148[/C][C]1.34819730585203[/C][/ROW]
[ROW][C]30[/C][C]109.65[/C][C]108.028422825524[/C][C]1.62157717447596[/C][/ROW]
[ROW][C]31[/C][C]109.82[/C][C]108.100455141100[/C][C]1.71954485890018[/C][/ROW]
[ROW][C]32[/C][C]109.95[/C][C]108.154691237533[/C][C]1.79530876246668[/C][/ROW]
[ROW][C]33[/C][C]110.12[/C][C]108.516547693426[/C][C]1.60345230657431[/C][/ROW]
[ROW][C]34[/C][C]110.15[/C][C]108.657222568550[/C][C]1.49277743144988[/C][/ROW]
[ROW][C]35[/C][C]110.21[/C][C]108.480107816134[/C][C]1.72989218386557[/C][/ROW]
[ROW][C]36[/C][C]109.99[/C][C]108.486039889182[/C][C]1.50396011081815[/C][/ROW]
[ROW][C]37[/C][C]110.14[/C][C]108.441973060830[/C][C]1.69802693917039[/C][/ROW]
[ROW][C]38[/C][C]110.14[/C][C]108.427566597714[/C][C]1.71243340228554[/C][/ROW]
[ROW][C]39[/C][C]110.81[/C][C]108.472480865073[/C][C]2.33751913492654[/C][/ROW]
[ROW][C]40[/C][C]110.97[/C][C]108.713153542997[/C][C]2.25684645700281[/C][/ROW]
[ROW][C]41[/C][C]110.99[/C][C]109.031790609544[/C][C]1.95820939045589[/C][/ROW]
[ROW][C]42[/C][C]109.73[/C][C]109.572456695866[/C][C]0.157543304134284[/C][/ROW]
[ROW][C]43[/C][C]109.81[/C][C]109.486017917175[/C][C]0.3239820828252[/C][/ROW]
[ROW][C]44[/C][C]110.02[/C][C]109.622455597265[/C][C]0.397544402734627[/C][/ROW]
[ROW][C]45[/C][C]110.18[/C][C]109.874992421284[/C][C]0.305007578716077[/C][/ROW]
[ROW][C]46[/C][C]110.21[/C][C]109.927533639704[/C][C]0.282466360296094[/C][/ROW]
[ROW][C]47[/C][C]110.25[/C][C]110.348710826070[/C][C]-0.098710826070427[/C][/ROW]
[ROW][C]48[/C][C]110.36[/C][C]110.012277540381[/C][C]0.347722459618730[/C][/ROW]
[ROW][C]49[/C][C]110.51[/C][C]109.609744012164[/C][C]0.900255987836242[/C][/ROW]
[ROW][C]50[/C][C]110.6[/C][C]109.380935480335[/C][C]1.21906451966513[/C][/ROW]
[ROW][C]51[/C][C]110.95[/C][C]109.803807544715[/C][C]1.14619245528506[/C][/ROW]
[ROW][C]52[/C][C]111.18[/C][C]110.173290951668[/C][C]1.00670904833173[/C][/ROW]
[ROW][C]53[/C][C]111.19[/C][C]110.849547279074[/C][C]0.340452720926316[/C][/ROW]
[ROW][C]54[/C][C]111.69[/C][C]110.724973745078[/C][C]0.96502625492205[/C][/ROW]
[ROW][C]55[/C][C]111.7[/C][C]111.109711054153[/C][C]0.590288945846794[/C][/ROW]
[ROW][C]56[/C][C]111.83[/C][C]111.745290309233[/C][C]0.0847096907665167[/C][/ROW]
[ROW][C]57[/C][C]111.77[/C][C]111.938506402778[/C][C]-0.168506402777889[/C][/ROW]
[ROW][C]58[/C][C]111.73[/C][C]112.450359562869[/C][C]-0.720359562869193[/C][/ROW]
[ROW][C]59[/C][C]112.01[/C][C]112.282566639528[/C][C]-0.272566639527999[/C][/ROW]
[ROW][C]60[/C][C]111.86[/C][C]111.459703363951[/C][C]0.400296636049254[/C][/ROW]
[ROW][C]61[/C][C]112.04[/C][C]111.254623124312[/C][C]0.785376875688497[/C][/ROW]
[/TABLE]
Source: https://freestatistics.org/blog/index.php?pk=58674&T=4

Globally Unique Identifier (entire table): ba.freestatistics.org/blog/index.php?pk=58674&T=4

As an alternative you can also use a QR Code:  

The GUIDs for individual cells are displayed in the table below:

Multiple Linear Regression - Actuals, Interpolation, and Residuals
Time or IndexActualsInterpolationForecastResidualsPrediction Error
1104.89108.965690367016-4.07569036701562
2105.15108.510615620378-3.36061562037827
3105.24108.784338419566-3.54433841956619
4105.57108.624172447286-3.05417244728596
5105.62109.052976584713-3.43297658471344
6106.17109.481780722141-3.31178072214093
7106.27109.190261703811-2.92026170381079
8106.41108.770779395458-2.36077939545781
9106.94108.562309399791-1.62230939979148
10107.16108.849591223088-1.68959122308776
11107.32108.343670136044-1.02367013604387
12107.32108.128420628323-0.808420628323348
13107.35108.042829288639-0.692829288639203
14107.55108.000457338301-0.450457338300515
15107.87108.067405019836-0.197405019835630
16108.37108.2182491630410.151750836958652
17108.38108.712306103990-0.332306103990423
18107.92108.579258179927-0.659258179926946
19108.03108.345365014057-0.315365014057406
20108.14108.378415135322-0.23841513532158
21108.3108.407228061552-0.107228061551890
22108.64108.5911223260220.0488776739782215
23108.66108.704679152929-0.0446791529294583
24109.04108.3801100133350.659889986664877
25109.03108.3529919651180.677008034881631
26109.03108.5750209848930.454979015106922
27109.54108.8377270769930.702272923007081
28109.75108.972469879070.777530120930057
29109.83108.4818026941481.34819730585203
30109.65108.0284228255241.62157717447596
31109.82108.1004551411001.71954485890018
32109.95108.1546912375331.79530876246668
33110.12108.5165476934261.60345230657431
34110.15108.6572225685501.49277743144988
35110.21108.4801078161341.72989218386557
36109.99108.4860398891821.50396011081815
37110.14108.4419730608301.69802693917039
38110.14108.4275665977141.71243340228554
39110.81108.4724808650732.33751913492654
40110.97108.7131535429972.25684645700281
41110.99109.0317906095441.95820939045589
42109.73109.5724566958660.157543304134284
43109.81109.4860179171750.3239820828252
44110.02109.6224555972650.397544402734627
45110.18109.8749924212840.305007578716077
46110.21109.9275336397040.282466360296094
47110.25110.348710826070-0.098710826070427
48110.36110.0122775403810.347722459618730
49110.51109.6097440121640.900255987836242
50110.6109.3809354803351.21906451966513
51110.95109.8038075447151.14619245528506
52111.18110.1732909516681.00670904833173
53111.19110.8495472790740.340452720926316
54111.69110.7249737450780.96502625492205
55111.7111.1097110541530.590288945846794
56111.83111.7452903092330.0847096907665167
57111.77111.938506402778-0.168506402777889
58111.73112.450359562869-0.720359562869193
59112.01112.282566639528-0.272566639527999
60111.86111.4597033639510.400296636049254
61112.04111.2546231243120.785376875688497


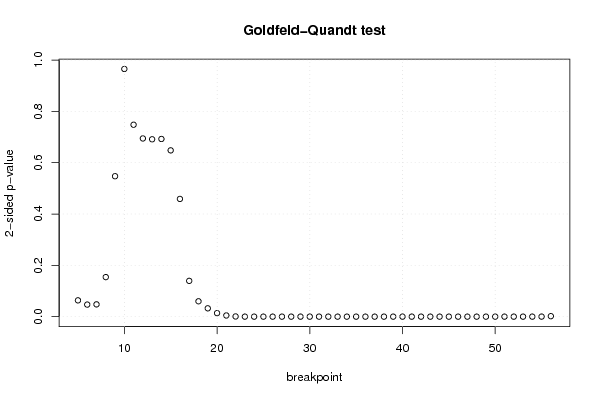
Goldfeld-Quandt test for Heteroskedasticity
p-valuesAlternative Hypothesis
breakpoint indexgreater2-sidedless
50.03178972674575610.06357945349151220.968210273254244
60.0235173720060630.0470347440121260.976482627993937
70.02396217291991520.04792434583983050.976037827080085
80.07705661545469820.1541132309093960.922943384545302
90.2736354078991210.5472708157982420.726364592100879
100.482625874814900.965251749629800.5173741251851
110.6260669989874850.747866002025030.373933001012515
120.6527982356164230.6944035287671550.347201764383577
130.6544053518274080.6911892963451840.345594648172592
140.6537895997943390.6924208004113220.346210400205661
150.676005063045810.647989873908380.32399493695419
160.7706458853146550.458708229370690.229354114685345
170.93024158665860.1395168266827980.069758413341399
180.9700692776671680.05986144466566380.0299307223328319
190.9837428942466860.03251421150662720.0162571057533136
200.9930509546165830.01389809076683460.00694904538341732
210.9977046431342950.004590713731409120.00229535686570456
220.9996097980458130.0007804039083749560.000390201954187478
230.9999668136670356.63726659295798e-053.31863329647899e-05
240.999988155321922.36893561613249e-051.18446780806624e-05
250.9999953247145689.35057086384403e-064.67528543192202e-06
260.999999266331371.46733726163204e-067.33668630816021e-07
270.9999999141758981.71648204259309e-078.58241021296544e-08
280.9999999862179512.75640973800162e-081.37820486900081e-08
290.9999999880125352.39749302595767e-081.19874651297884e-08
300.9999999760904064.78191874890581e-082.39095937445290e-08
310.9999999521825029.5634996118215e-084.78174980591075e-08
320.9999999071151951.85769609267445e-079.28848046337223e-08
330.9999998867557672.26488465340668e-071.13244232670334e-07
340.9999998681749062.63650187974645e-071.31825093987322e-07
350.9999997929241274.14151746028776e-072.07075873014388e-07
360.9999996004032217.99193557986938e-073.99596778993469e-07
370.9999992050251281.58994974426861e-067.94974872134305e-07
380.9999983340528713.33189425741787e-061.66594712870894e-06
390.9999990374961841.92500763181952e-069.62503815909758e-07
400.9999997839716394.32056721920273e-072.16028360960136e-07
410.9999999689665226.20669569505116e-083.10334784752558e-08
420.9999999650486796.9902642802868e-083.4951321401434e-08
430.9999999424723041.15055391886091e-075.75276959430454e-08
440.99999988429932.31401400935608e-071.15700700467804e-07
450.9999997885867934.22826413354572e-072.11413206677286e-07
460.999999675384096.4923181868023e-073.24615909340115e-07
470.9999998977548292.04490342508172e-071.02245171254086e-07
480.9999999390287871.21942425447111e-076.09712127235555e-08
490.999999865137232.69725540436906e-071.34862770218453e-07
500.9999995959111328.08177736983105e-074.04088868491553e-07
510.999998289852013.42029597922619e-061.71014798961309e-06
520.9999925229252571.49541494868900e-057.47707474344502e-06
530.9999981775315033.64493699375667e-061.82246849687834e-06
540.9999843027322373.13945355263534e-051.56972677631767e-05
550.9999272861155420.0001454277689165587.2713884458279e-05
560.9990786894966420.001842621006716390.000921310503358196

\begin{tabular}{lllllllll}
\hline
Goldfeld-Quandt test for Heteroskedasticity \tabularnewline
p-values & Alternative Hypothesis \tabularnewline
breakpoint index & greater & 2-sided & less \tabularnewline
5 & 0.0317897267457561 & 0.0635794534915122 & 0.968210273254244 \tabularnewline
6 & 0.023517372006063 & 0.047034744012126 & 0.976482627993937 \tabularnewline
7 & 0.0239621729199152 & 0.0479243458398305 & 0.976037827080085 \tabularnewline
8 & 0.0770566154546982 & 0.154113230909396 & 0.922943384545302 \tabularnewline
9 & 0.273635407899121 & 0.547270815798242 & 0.726364592100879 \tabularnewline
10 & 0.48262587481490 & 0.96525174962980 & 0.5173741251851 \tabularnewline
11 & 0.626066998987485 & 0.74786600202503 & 0.373933001012515 \tabularnewline
12 & 0.652798235616423 & 0.694403528767155 & 0.347201764383577 \tabularnewline
13 & 0.654405351827408 & 0.691189296345184 & 0.345594648172592 \tabularnewline
14 & 0.653789599794339 & 0.692420800411322 & 0.346210400205661 \tabularnewline
15 & 0.67600506304581 & 0.64798987390838 & 0.32399493695419 \tabularnewline
16 & 0.770645885314655 & 0.45870822937069 & 0.229354114685345 \tabularnewline
17 & 0.9302415866586 & 0.139516826682798 & 0.069758413341399 \tabularnewline
18 & 0.970069277667168 & 0.0598614446656638 & 0.0299307223328319 \tabularnewline
19 & 0.983742894246686 & 0.0325142115066272 & 0.0162571057533136 \tabularnewline
20 & 0.993050954616583 & 0.0138980907668346 & 0.00694904538341732 \tabularnewline
21 & 0.997704643134295 & 0.00459071373140912 & 0.00229535686570456 \tabularnewline
22 & 0.999609798045813 & 0.000780403908374956 & 0.000390201954187478 \tabularnewline
23 & 0.999966813667035 & 6.63726659295798e-05 & 3.31863329647899e-05 \tabularnewline
24 & 0.99998815532192 & 2.36893561613249e-05 & 1.18446780806624e-05 \tabularnewline
25 & 0.999995324714568 & 9.35057086384403e-06 & 4.67528543192202e-06 \tabularnewline
26 & 0.99999926633137 & 1.46733726163204e-06 & 7.33668630816021e-07 \tabularnewline
27 & 0.999999914175898 & 1.71648204259309e-07 & 8.58241021296544e-08 \tabularnewline
28 & 0.999999986217951 & 2.75640973800162e-08 & 1.37820486900081e-08 \tabularnewline
29 & 0.999999988012535 & 2.39749302595767e-08 & 1.19874651297884e-08 \tabularnewline
30 & 0.999999976090406 & 4.78191874890581e-08 & 2.39095937445290e-08 \tabularnewline
31 & 0.999999952182502 & 9.5634996118215e-08 & 4.78174980591075e-08 \tabularnewline
32 & 0.999999907115195 & 1.85769609267445e-07 & 9.28848046337223e-08 \tabularnewline
33 & 0.999999886755767 & 2.26488465340668e-07 & 1.13244232670334e-07 \tabularnewline
34 & 0.999999868174906 & 2.63650187974645e-07 & 1.31825093987322e-07 \tabularnewline
35 & 0.999999792924127 & 4.14151746028776e-07 & 2.07075873014388e-07 \tabularnewline
36 & 0.999999600403221 & 7.99193557986938e-07 & 3.99596778993469e-07 \tabularnewline
37 & 0.999999205025128 & 1.58994974426861e-06 & 7.94974872134305e-07 \tabularnewline
38 & 0.999998334052871 & 3.33189425741787e-06 & 1.66594712870894e-06 \tabularnewline
39 & 0.999999037496184 & 1.92500763181952e-06 & 9.62503815909758e-07 \tabularnewline
40 & 0.999999783971639 & 4.32056721920273e-07 & 2.16028360960136e-07 \tabularnewline
41 & 0.999999968966522 & 6.20669569505116e-08 & 3.10334784752558e-08 \tabularnewline
42 & 0.999999965048679 & 6.9902642802868e-08 & 3.4951321401434e-08 \tabularnewline
43 & 0.999999942472304 & 1.15055391886091e-07 & 5.75276959430454e-08 \tabularnewline
44 & 0.9999998842993 & 2.31401400935608e-07 & 1.15700700467804e-07 \tabularnewline
45 & 0.999999788586793 & 4.22826413354572e-07 & 2.11413206677286e-07 \tabularnewline
46 & 0.99999967538409 & 6.4923181868023e-07 & 3.24615909340115e-07 \tabularnewline
47 & 0.999999897754829 & 2.04490342508172e-07 & 1.02245171254086e-07 \tabularnewline
48 & 0.999999939028787 & 1.21942425447111e-07 & 6.09712127235555e-08 \tabularnewline
49 & 0.99999986513723 & 2.69725540436906e-07 & 1.34862770218453e-07 \tabularnewline
50 & 0.999999595911132 & 8.08177736983105e-07 & 4.04088868491553e-07 \tabularnewline
51 & 0.99999828985201 & 3.42029597922619e-06 & 1.71014798961309e-06 \tabularnewline
52 & 0.999992522925257 & 1.49541494868900e-05 & 7.47707474344502e-06 \tabularnewline
53 & 0.999998177531503 & 3.64493699375667e-06 & 1.82246849687834e-06 \tabularnewline
54 & 0.999984302732237 & 3.13945355263534e-05 & 1.56972677631767e-05 \tabularnewline
55 & 0.999927286115542 & 0.000145427768916558 & 7.2713884458279e-05 \tabularnewline
56 & 0.999078689496642 & 0.00184262100671639 & 0.000921310503358196 \tabularnewline
\hline
\end{tabular}
%Source: https://freestatistics.org/blog/index.php?pk=58674&T=5

[TABLE]
[ROW][C]Goldfeld-Quandt test for Heteroskedasticity[/C][/ROW]
[ROW][C]p-values[/C][C]Alternative Hypothesis[/C][/ROW]
[ROW][C]breakpoint index[/C][C]greater[/C][C]2-sided[/C][C]less[/C][/ROW]
[ROW][C]5[/C][C]0.0317897267457561[/C][C]0.0635794534915122[/C][C]0.968210273254244[/C][/ROW]
[ROW][C]6[/C][C]0.023517372006063[/C][C]0.047034744012126[/C][C]0.976482627993937[/C][/ROW]
[ROW][C]7[/C][C]0.0239621729199152[/C][C]0.0479243458398305[/C][C]0.976037827080085[/C][/ROW]
[ROW][C]8[/C][C]0.0770566154546982[/C][C]0.154113230909396[/C][C]0.922943384545302[/C][/ROW]
[ROW][C]9[/C][C]0.273635407899121[/C][C]0.547270815798242[/C][C]0.726364592100879[/C][/ROW]
[ROW][C]10[/C][C]0.48262587481490[/C][C]0.96525174962980[/C][C]0.5173741251851[/C][/ROW]
[ROW][C]11[/C][C]0.626066998987485[/C][C]0.74786600202503[/C][C]0.373933001012515[/C][/ROW]
[ROW][C]12[/C][C]0.652798235616423[/C][C]0.694403528767155[/C][C]0.347201764383577[/C][/ROW]
[ROW][C]13[/C][C]0.654405351827408[/C][C]0.691189296345184[/C][C]0.345594648172592[/C][/ROW]
[ROW][C]14[/C][C]0.653789599794339[/C][C]0.692420800411322[/C][C]0.346210400205661[/C][/ROW]
[ROW][C]15[/C][C]0.67600506304581[/C][C]0.64798987390838[/C][C]0.32399493695419[/C][/ROW]
[ROW][C]16[/C][C]0.770645885314655[/C][C]0.45870822937069[/C][C]0.229354114685345[/C][/ROW]
[ROW][C]17[/C][C]0.9302415866586[/C][C]0.139516826682798[/C][C]0.069758413341399[/C][/ROW]
[ROW][C]18[/C][C]0.970069277667168[/C][C]0.0598614446656638[/C][C]0.0299307223328319[/C][/ROW]
[ROW][C]19[/C][C]0.983742894246686[/C][C]0.0325142115066272[/C][C]0.0162571057533136[/C][/ROW]
[ROW][C]20[/C][C]0.993050954616583[/C][C]0.0138980907668346[/C][C]0.00694904538341732[/C][/ROW]
[ROW][C]21[/C][C]0.997704643134295[/C][C]0.00459071373140912[/C][C]0.00229535686570456[/C][/ROW]
[ROW][C]22[/C][C]0.999609798045813[/C][C]0.000780403908374956[/C][C]0.000390201954187478[/C][/ROW]
[ROW][C]23[/C][C]0.999966813667035[/C][C]6.63726659295798e-05[/C][C]3.31863329647899e-05[/C][/ROW]
[ROW][C]24[/C][C]0.99998815532192[/C][C]2.36893561613249e-05[/C][C]1.18446780806624e-05[/C][/ROW]
[ROW][C]25[/C][C]0.999995324714568[/C][C]9.35057086384403e-06[/C][C]4.67528543192202e-06[/C][/ROW]
[ROW][C]26[/C][C]0.99999926633137[/C][C]1.46733726163204e-06[/C][C]7.33668630816021e-07[/C][/ROW]
[ROW][C]27[/C][C]0.999999914175898[/C][C]1.71648204259309e-07[/C][C]8.58241021296544e-08[/C][/ROW]
[ROW][C]28[/C][C]0.999999986217951[/C][C]2.75640973800162e-08[/C][C]1.37820486900081e-08[/C][/ROW]
[ROW][C]29[/C][C]0.999999988012535[/C][C]2.39749302595767e-08[/C][C]1.19874651297884e-08[/C][/ROW]
[ROW][C]30[/C][C]0.999999976090406[/C][C]4.78191874890581e-08[/C][C]2.39095937445290e-08[/C][/ROW]
[ROW][C]31[/C][C]0.999999952182502[/C][C]9.5634996118215e-08[/C][C]4.78174980591075e-08[/C][/ROW]
[ROW][C]32[/C][C]0.999999907115195[/C][C]1.85769609267445e-07[/C][C]9.28848046337223e-08[/C][/ROW]
[ROW][C]33[/C][C]0.999999886755767[/C][C]2.26488465340668e-07[/C][C]1.13244232670334e-07[/C][/ROW]
[ROW][C]34[/C][C]0.999999868174906[/C][C]2.63650187974645e-07[/C][C]1.31825093987322e-07[/C][/ROW]
[ROW][C]35[/C][C]0.999999792924127[/C][C]4.14151746028776e-07[/C][C]2.07075873014388e-07[/C][/ROW]
[ROW][C]36[/C][C]0.999999600403221[/C][C]7.99193557986938e-07[/C][C]3.99596778993469e-07[/C][/ROW]
[ROW][C]37[/C][C]0.999999205025128[/C][C]1.58994974426861e-06[/C][C]7.94974872134305e-07[/C][/ROW]
[ROW][C]38[/C][C]0.999998334052871[/C][C]3.33189425741787e-06[/C][C]1.66594712870894e-06[/C][/ROW]
[ROW][C]39[/C][C]0.999999037496184[/C][C]1.92500763181952e-06[/C][C]9.62503815909758e-07[/C][/ROW]
[ROW][C]40[/C][C]0.999999783971639[/C][C]4.32056721920273e-07[/C][C]2.16028360960136e-07[/C][/ROW]
[ROW][C]41[/C][C]0.999999968966522[/C][C]6.20669569505116e-08[/C][C]3.10334784752558e-08[/C][/ROW]
[ROW][C]42[/C][C]0.999999965048679[/C][C]6.9902642802868e-08[/C][C]3.4951321401434e-08[/C][/ROW]
[ROW][C]43[/C][C]0.999999942472304[/C][C]1.15055391886091e-07[/C][C]5.75276959430454e-08[/C][/ROW]
[ROW][C]44[/C][C]0.9999998842993[/C][C]2.31401400935608e-07[/C][C]1.15700700467804e-07[/C][/ROW]
[ROW][C]45[/C][C]0.999999788586793[/C][C]4.22826413354572e-07[/C][C]2.11413206677286e-07[/C][/ROW]
[ROW][C]46[/C][C]0.99999967538409[/C][C]6.4923181868023e-07[/C][C]3.24615909340115e-07[/C][/ROW]
[ROW][C]47[/C][C]0.999999897754829[/C][C]2.04490342508172e-07[/C][C]1.02245171254086e-07[/C][/ROW]
[ROW][C]48[/C][C]0.999999939028787[/C][C]1.21942425447111e-07[/C][C]6.09712127235555e-08[/C][/ROW]
[ROW][C]49[/C][C]0.99999986513723[/C][C]2.69725540436906e-07[/C][C]1.34862770218453e-07[/C][/ROW]
[ROW][C]50[/C][C]0.999999595911132[/C][C]8.08177736983105e-07[/C][C]4.04088868491553e-07[/C][/ROW]
[ROW][C]51[/C][C]0.99999828985201[/C][C]3.42029597922619e-06[/C][C]1.71014798961309e-06[/C][/ROW]
[ROW][C]52[/C][C]0.999992522925257[/C][C]1.49541494868900e-05[/C][C]7.47707474344502e-06[/C][/ROW]
[ROW][C]53[/C][C]0.999998177531503[/C][C]3.64493699375667e-06[/C][C]1.82246849687834e-06[/C][/ROW]
[ROW][C]54[/C][C]0.999984302732237[/C][C]3.13945355263534e-05[/C][C]1.56972677631767e-05[/C][/ROW]
[ROW][C]55[/C][C]0.999927286115542[/C][C]0.000145427768916558[/C][C]7.2713884458279e-05[/C][/ROW]
[ROW][C]56[/C][C]0.999078689496642[/C][C]0.00184262100671639[/C][C]0.000921310503358196[/C][/ROW]
[/TABLE]
Source: https://freestatistics.org/blog/index.php?pk=58674&T=5

Globally Unique Identifier (entire table): ba.freestatistics.org/blog/index.php?pk=58674&T=5

As an alternative you can also use a QR Code:  

The GUIDs for individual cells are displayed in the table below:

Goldfeld-Quandt test for Heteroskedasticity
p-valuesAlternative Hypothesis
breakpoint indexgreater2-sidedless
50.03178972674575610.06357945349151220.968210273254244
60.0235173720060630.0470347440121260.976482627993937
70.02396217291991520.04792434583983050.976037827080085
80.07705661545469820.1541132309093960.922943384545302
90.2736354078991210.5472708157982420.726364592100879
100.482625874814900.965251749629800.5173741251851
110.6260669989874850.747866002025030.373933001012515
120.6527982356164230.6944035287671550.347201764383577
130.6544053518274080.6911892963451840.345594648172592
140.6537895997943390.6924208004113220.346210400205661
150.676005063045810.647989873908380.32399493695419
160.7706458853146550.458708229370690.229354114685345
170.93024158665860.1395168266827980.069758413341399
180.9700692776671680.05986144466566380.0299307223328319
190.9837428942466860.03251421150662720.0162571057533136
200.9930509546165830.01389809076683460.00694904538341732
210.9977046431342950.004590713731409120.00229535686570456
220.9996097980458130.0007804039083749560.000390201954187478
230.9999668136670356.63726659295798e-053.31863329647899e-05
240.999988155321922.36893561613249e-051.18446780806624e-05
250.9999953247145689.35057086384403e-064.67528543192202e-06
260.999999266331371.46733726163204e-067.33668630816021e-07
270.9999999141758981.71648204259309e-078.58241021296544e-08
280.9999999862179512.75640973800162e-081.37820486900081e-08
290.9999999880125352.39749302595767e-081.19874651297884e-08
300.9999999760904064.78191874890581e-082.39095937445290e-08
310.9999999521825029.5634996118215e-084.78174980591075e-08
320.9999999071151951.85769609267445e-079.28848046337223e-08
330.9999998867557672.26488465340668e-071.13244232670334e-07
340.9999998681749062.63650187974645e-071.31825093987322e-07
350.9999997929241274.14151746028776e-072.07075873014388e-07
360.9999996004032217.99193557986938e-073.99596778993469e-07
370.9999992050251281.58994974426861e-067.94974872134305e-07
380.9999983340528713.33189425741787e-061.66594712870894e-06
390.9999990374961841.92500763181952e-069.62503815909758e-07
400.9999997839716394.32056721920273e-072.16028360960136e-07
410.9999999689665226.20669569505116e-083.10334784752558e-08
420.9999999650486796.9902642802868e-083.4951321401434e-08
430.9999999424723041.15055391886091e-075.75276959430454e-08
440.99999988429932.31401400935608e-071.15700700467804e-07
450.9999997885867934.22826413354572e-072.11413206677286e-07
460.999999675384096.4923181868023e-073.24615909340115e-07
470.9999998977548292.04490342508172e-071.02245171254086e-07
480.9999999390287871.21942425447111e-076.09712127235555e-08
490.999999865137232.69725540436906e-071.34862770218453e-07
500.9999995959111328.08177736983105e-074.04088868491553e-07
510.999998289852013.42029597922619e-061.71014798961309e-06
520.9999925229252571.49541494868900e-057.47707474344502e-06
530.9999981775315033.64493699375667e-061.82246849687834e-06
540.9999843027322373.13945355263534e-051.56972677631767e-05
550.9999272861155420.0001454277689165587.2713884458279e-05
560.9990786894966420.001842621006716390.000921310503358196


Meta Analysis of Goldfeld-Quandt test for Heteroskedasticity
Description# significant tests% significant testsOK/NOK
1% type I error level360.692307692307692NOK
5% type I error level400.769230769230769NOK
10% type I error level420.807692307692308NOK

\begin{tabular}{lllllllll}
\hline
Meta Analysis of Goldfeld-Quandt test for Heteroskedasticity \tabularnewline
Description & # significant tests & % significant tests & OK/NOK \tabularnewline
1% type I error level & 36 & 0.692307692307692 & NOK \tabularnewline
5% type I error level & 40 & 0.769230769230769 & NOK \tabularnewline
10% type I error level & 42 & 0.807692307692308 & NOK \tabularnewline
\hline
\end{tabular}
%Source: https://freestatistics.org/blog/index.php?pk=58674&T=6

[TABLE]
[ROW][C]Meta Analysis of Goldfeld-Quandt test for Heteroskedasticity[/C][/ROW]
[ROW][C]Description[/C][C]# significant tests[/C][C]% significant tests[/C][C]OK/NOK[/C][/ROW]
[ROW][C]1% type I error level[/C][C]36[/C][C]0.692307692307692[/C][C]NOK[/C][/ROW]
[ROW][C]5% type I error level[/C][C]40[/C][C]0.769230769230769[/C][C]NOK[/C][/ROW]
[ROW][C]10% type I error level[/C][C]42[/C][C]0.807692307692308[/C][C]NOK[/C][/ROW]
[/TABLE]
Source: https://freestatistics.org/blog/index.php?pk=58674&T=6

Globally Unique Identifier (entire table): ba.freestatistics.org/blog/index.php?pk=58674&T=6

As an alternative you can also use a QR Code:  

The GUIDs for individual cells are displayed in the table below:

Meta Analysis of Goldfeld-Quandt test for Heteroskedasticity
Description# significant tests% significant testsOK/NOK
1% type I error level360.692307692307692NOK
5% type I error level400.769230769230769NOK
10% type I error level420.807692307692308NOK


Parameters (Session):
par1 = 1 ; par2 = Do not include Seasonal Dummies ; par3 = No Linear Trend ;
Parameters (R input):
par1 = 1 ; par2 = Do not include Seasonal Dummies ; par3 = No Linear Trend ;
R code (references can be found in the software module):
library(lattice)
library(lmtest)
n25 <- 25 #minimum number of obs. for Goldfeld-Quandt test
par1 <- as.numeric(par1)
x <- t(y)
k <- length(x[1,])
n <- length(x[,1])
x1 <- cbind(x[,par1], x[,1:k!=par1])
mycolnames <- c(colnames(x)[par1], colnames(x)[1:k!=par1])
colnames(x1) <- mycolnames #colnames(x)[par1]
x <- x1
if (par3 == 'First Differences'){
x2 <- array(0, dim=c(n-1,k), dimnames=list(1:(n-1), paste('(1-B)',colnames(x),sep='')))
for (i in 1:n-1) {
for (j in 1:k) {
x2[i,j] <- x[i+1,j] - x[i,j]
}
}
x <- x2
}
if (par2 == 'Include Monthly Dummies'){
x2 <- array(0, dim=c(n,11), dimnames=list(1:n, paste('M', seq(1:11), sep ='')))
for (i in 1:11){
x2[seq(i,n,12),i] <- 1
}
x <- cbind(x, x2)
}
if (par2 == 'Include Quarterly Dummies'){
x2 <- array(0, dim=c(n,3), dimnames=list(1:n, paste('Q', seq(1:3), sep ='')))
for (i in 1:3){
x2[seq(i,n,4),i] <- 1
}
x <- cbind(x, x2)
}
k <- length(x[1,])
if (par3 == 'Linear Trend'){
x <- cbind(x, c(1:n))
colnames(x)[k+1] <- 't'
}
x
k <- length(x[1,])
df <- as.data.frame(x)
(mylm <- lm(df))
(mysum <- summary(mylm))
if (n > n25) {
kp3 <- k + 3
nmkm3 <- n - k - 3
gqarr <- array(NA, dim=c(nmkm3-kp3+1,3))
numgqtests <- 0
numsignificant1 <- 0
numsignificant5 <- 0
numsignificant10 <- 0
for (mypoint in kp3:nmkm3) {
j <- 0
numgqtests <- numgqtests + 1
for (myalt in c('greater', 'two.sided', 'less')) {
j <- j + 1
gqarr[mypoint-kp3+1,j] <- gqtest(mylm, point=mypoint, alternative=myalt)$p.value
}
if (gqarr[mypoint-kp3+1,2] < 0.01) numsignificant1 <- numsignificant1 + 1
if (gqarr[mypoint-kp3+1,2] < 0.05) numsignificant5 <- numsignificant5 + 1
if (gqarr[mypoint-kp3+1,2] < 0.10) numsignificant10 <- numsignificant10 + 1
}
gqarr
}
bitmap(file='test0.png')
plot(x[,1], type='l', main='Actuals and Interpolation', ylab='value of Actuals and Interpolation (dots)', xlab='time or index')
points(x[,1]-mysum$resid)
grid()
dev.off()
bitmap(file='test1.png')
plot(mysum$resid, type='b', pch=19, main='Residuals', ylab='value of Residuals', xlab='time or index')
grid()
dev.off()
bitmap(file='test2.png')
hist(mysum$resid, main='Residual Histogram', xlab='values of Residuals')
grid()
dev.off()
bitmap(file='test3.png')
densityplot(~mysum$resid,col='black',main='Residual Density Plot', xlab='values of Residuals')
dev.off()
bitmap(file='test4.png')
qqnorm(mysum$resid, main='Residual Normal Q-Q Plot')
qqline(mysum$resid)
grid()
dev.off()
(myerror <- as.ts(mysum$resid))
bitmap(file='test5.png')
dum <- cbind(lag(myerror,k=1),myerror)
dum
dum1 <- dum[2:length(myerror),]
dum1
z <- as.data.frame(dum1)
z
plot(z,main=paste('Residual Lag plot, lowess, and regression line'), ylab='values of Residuals', xlab='lagged values of Residuals')
lines(lowess(z))
abline(lm(z))
grid()
dev.off()
bitmap(file='test6.png')
acf(mysum$resid, lag.max=length(mysum$resid)/2, main='Residual Autocorrelation Function')
grid()
dev.off()
bitmap(file='test7.png')
pacf(mysum$resid, lag.max=length(mysum$resid)/2, main='Residual Partial Autocorrelation Function')
grid()
dev.off()
bitmap(file='test8.png')
opar <- par(mfrow = c(2,2), oma = c(0, 0, 1.1, 0))
plot(mylm, las = 1, sub='Residual Diagnostics')
par(opar)
dev.off()
if (n > n25) {
bitmap(file='test9.png')
plot(kp3:nmkm3,gqarr[,2], main='Goldfeld-Quandt test',ylab='2-sided p-value',xlab='breakpoint')
grid()
dev.off()
}
load(file='createtable')
a<-table.start()
a<-table.row.start(a)
a<-table.element(a, 'Multiple Linear Regression - Estimated Regression Equation', 1, TRUE)
a<-table.row.end(a)
myeq <- colnames(x)[1]
myeq <- paste(myeq, '[t] = ', sep='')
for (i in 1:k){
if (mysum$coefficients[i,1] > 0) myeq <- paste(myeq, '+', '')
myeq <- paste(myeq, mysum$coefficients[i,1], sep=' ')
if (rownames(mysum$coefficients)[i] != '(Intercept)') {
myeq <- paste(myeq, rownames(mysum$coefficients)[i], sep='')
if (rownames(mysum$coefficients)[i] != 't') myeq <- paste(myeq, '[t]', sep='')
}
}
myeq <- paste(myeq, ' + e[t]')
a<-table.row.start(a)
a<-table.element(a, myeq)
a<-table.row.end(a)
a<-table.end(a)
table.save(a,file='mytable1.tab')
a<-table.start()
a<-table.row.start(a)
a<-table.element(a,hyperlink('ols1.htm','Multiple Linear Regression - Ordinary Least Squares',''), 6, TRUE)
a<-table.row.end(a)
a<-table.row.start(a)
a<-table.element(a,'Variable',header=TRUE)
a<-table.element(a,'Parameter',header=TRUE)
a<-table.element(a,'S.D.',header=TRUE)
a<-table.element(a,'T-STAT
H0: parameter = 0',header=TRUE)
a<-table.element(a,'2-tail p-value',header=TRUE)
a<-table.element(a,'1-tail p-value',header=TRUE)
a<-table.row.end(a)
for (i in 1:k){
a<-table.row.start(a)
a<-table.element(a,rownames(mysum$coefficients)[i],header=TRUE)
a<-table.element(a,mysum$coefficients[i,1])
a<-table.element(a, round(mysum$coefficients[i,2],6))
a<-table.element(a, round(mysum$coefficients[i,3],4))
a<-table.element(a, round(mysum$coefficients[i,4],6))
a<-table.element(a, round(mysum$coefficients[i,4]/2,6))
a<-table.row.end(a)
}
a<-table.end(a)
table.save(a,file='mytable2.tab')
a<-table.start()
a<-table.row.start(a)
a<-table.element(a, 'Multiple Linear Regression - Regression Statistics', 2, TRUE)
a<-table.row.end(a)
a<-table.row.start(a)
a<-table.element(a, 'Multiple R',1,TRUE)
a<-table.element(a, sqrt(mysum$r.squared))
a<-table.row.end(a)
a<-table.row.start(a)
a<-table.element(a, 'R-squared',1,TRUE)
a<-table.element(a, mysum$r.squared)
a<-table.row.end(a)
a<-table.row.start(a)
a<-table.element(a, 'Adjusted R-squared',1,TRUE)
a<-table.element(a, mysum$adj.r.squared)
a<-table.row.end(a)
a<-table.row.start(a)
a<-table.element(a, 'F-TEST (value)',1,TRUE)
a<-table.element(a, mysum$fstatistic[1])
a<-table.row.end(a)
a<-table.row.start(a)
a<-table.element(a, 'F-TEST (DF numerator)',1,TRUE)
a<-table.element(a, mysum$fstatistic[2])
a<-table.row.end(a)
a<-table.row.start(a)
a<-table.element(a, 'F-TEST (DF denominator)',1,TRUE)
a<-table.element(a, mysum$fstatistic[3])
a<-table.row.end(a)
a<-table.row.start(a)
a<-table.element(a, 'p-value',1,TRUE)
a<-table.element(a, 1-pf(mysum$fstatistic[1],mysum$fstatistic[2],mysum$fstatistic[3]))
a<-table.row.end(a)
a<-table.row.start(a)
a<-table.element(a, 'Multiple Linear Regression - Residual Statistics', 2, TRUE)
a<-table.row.end(a)
a<-table.row.start(a)
a<-table.element(a, 'Residual Standard Deviation',1,TRUE)
a<-table.element(a, mysum$sigma)
a<-table.row.end(a)
a<-table.row.start(a)
a<-table.element(a, 'Sum Squared Residuals',1,TRUE)
a<-table.element(a, sum(myerror*myerror))
a<-table.row.end(a)
a<-table.end(a)
table.save(a,file='mytable3.tab')
a<-table.start()
a<-table.row.start(a)
a<-table.element(a, 'Multiple Linear Regression - Actuals, Interpolation, and Residuals', 4, TRUE)
a<-table.row.end(a)
a<-table.row.start(a)
a<-table.element(a, 'Time or Index', 1, TRUE)
a<-table.element(a, 'Actuals', 1, TRUE)
a<-table.element(a, 'Interpolation
Forecast', 1, TRUE)
a<-table.element(a, 'Residuals
Prediction Error', 1, TRUE)
a<-table.row.end(a)
for (i in 1:n) {
a<-table.row.start(a)
a<-table.element(a,i, 1, TRUE)
a<-table.element(a,x[i])
a<-table.element(a,x[i]-mysum$resid[i])
a<-table.element(a,mysum$resid[i])
a<-table.row.end(a)
}
a<-table.end(a)
table.save(a,file='mytable4.tab')
if (n > n25) {
a<-table.start()
a<-table.row.start(a)
a<-table.element(a,'Goldfeld-Quandt test for Heteroskedasticity',4,TRUE)
a<-table.row.end(a)
a<-table.row.start(a)
a<-table.element(a,'p-values',header=TRUE)
a<-table.element(a,'Alternative Hypothesis',3,header=TRUE)
a<-table.row.end(a)
a<-table.row.start(a)
a<-table.element(a,'breakpoint index',header=TRUE)
a<-table.element(a,'greater',header=TRUE)
a<-table.element(a,'2-sided',header=TRUE)
a<-table.element(a,'less',header=TRUE)
a<-table.row.end(a)
for (mypoint in kp3:nmkm3) {
a<-table.row.start(a)
a<-table.element(a,mypoint,header=TRUE)
a<-table.element(a,gqarr[mypoint-kp3+1,1])
a<-table.element(a,gqarr[mypoint-kp3+1,2])
a<-table.element(a,gqarr[mypoint-kp3+1,3])
a<-table.row.end(a)
}
a<-table.end(a)
table.save(a,file='mytable5.tab')
a<-table.start()
a<-table.row.start(a)
a<-table.element(a,'Meta Analysis of Goldfeld-Quandt test for Heteroskedasticity',4,TRUE)
a<-table.row.end(a)
a<-table.row.start(a)
a<-table.element(a,'Description',header=TRUE)
a<-table.element(a,'# significant tests',header=TRUE)
a<-table.element(a,'% significant tests',header=TRUE)
a<-table.element(a,'OK/NOK',header=TRUE)
a<-table.row.end(a)
a<-table.row.start(a)
a<-table.element(a,'1% type I error level',header=TRUE)
a<-table.element(a,numsignificant1)
a<-table.element(a,numsignificant1/numgqtests)
if (numsignificant1/numgqtests < 0.01) dum <- 'OK' else dum <- 'NOK'
a<-table.element(a,dum)
a<-table.row.end(a)
a<-table.row.start(a)
a<-table.element(a,'5% type I error level',header=TRUE)
a<-table.element(a,numsignificant5)
a<-table.element(a,numsignificant5/numgqtests)
if (numsignificant5/numgqtests < 0.05) dum <- 'OK' else dum <- 'NOK'
a<-table.element(a,dum)
a<-table.row.end(a)
a<-table.row.start(a)
a<-table.element(a,'10% type I error level',header=TRUE)
a<-table.element(a,numsignificant10)
a<-table.element(a,numsignificant10/numgqtests)
if (numsignificant10/numgqtests < 0.1) dum <- 'OK' else dum <- 'NOK'
a<-table.element(a,dum)
a<-table.row.end(a)
a<-table.end(a)
table.save(a,file='mytable6.tab')
}