Free Statistics

of Irreproducible Research!

Author's title

Author*The author of this computation has been verified*
R Software Modulerwasp_multipleregression.wasp
Title produced by softwareMultiple Regression
Date of computationSun, 22 Nov 2009 10:52:42 -0700
Cite this page as followsStatistical Computations at FreeStatistics.org, Office for Research Development and Education, URL https://freestatistics.org/blog/index.php?v=date/2009/Nov/22/t1258912427el3dot5ptn2809u.htm/, Retrieved Sat, 27 Apr 2024 23:19:07 +0000
Statistical Computations at FreeStatistics.org, Office for Research Development and Education, URL https://freestatistics.org/blog/index.php?pk=58672, Retrieved Sat, 27 Apr 2024 23:19:07 +0000
QR Codes:

Original text written by user:
IsPrivate?No (this computation is public)
User-defined keywords
Estimated Impact130
Family? (F = Feedback message, R = changed R code, M = changed R Module, P = changed Parameters, D = changed Data)
-       [Multiple Regression] [WS71] [2009-11-22 17:52:42] [b406b824746c89e17d2637b66f6fb2ee] [Current]
Feedback Forum

Post a new message
Dataseries X:
124	104.89
118.63	105.15
121.86	105.24
119.97	105.57
125.03	105.62
130.09	106.17
126.65	106.27
121.7	106.41
119.24	106.94
122.63	107.16
116.66	107.32
114.12	107.32
113.11	107.35
112.61	107.55
113.4	107.87
115.18	108.37
121.01	108.38
119.44	107.92
116.68	108.03
117.07	108.14
117.41	108.3
119.58	108.64
120.92	108.66
117.09	109.04
116.77	109.03
119.39	109.03
122.49	109.54
124.08	109.75
118.29	109.83
112.94	109.65
113.79	109.82
114.43	109.95
118.7	110.12
120.36	110.15
118.27	110.21
118.34	109.99
117.82	110.14
117.65	110.14
118.18	110.81
121.02	110.97
124.78	110.99
131.16	109.73
130.14	109.81
131.75	110.02
134.73	110.18
135.35	110.21
140.32	110.25
136.35	110.36
131.6	110.51
128.9	110.6
133.89	110.95
138.25	111.18
146.23	111.19
144.76	111.69
149.3	111.7
156.8	111.83
159.08	111.77
165.12	111.73
163.14	112.01
153.43	111.86
151.01	112.04


Summary of computational transaction
Raw Inputview raw input (R code)
Raw Outputview raw output of R engine
Computing time3 seconds
R Server'Gwilym Jenkins' @ 72.249.127.135

\begin{tabular}{lllllllll}
\hline
Summary of computational transaction \tabularnewline
Raw Input & view raw input (R code)  \tabularnewline
Raw Output & view raw output of R engine  \tabularnewline
Computing time & 3 seconds \tabularnewline
R Server & 'Gwilym Jenkins' @ 72.249.127.135 \tabularnewline
\hline
\end{tabular}
%Source: https://freestatistics.org/blog/index.php?pk=58672&T=0

[TABLE]
[ROW][C]Summary of computational transaction[/C][/ROW]
[ROW][C]Raw Input[/C][C]view raw input (R code) [/C][/ROW]
[ROW][C]Raw Output[/C][C]view raw output of R engine [/C][/ROW]
[ROW][C]Computing time[/C][C]3 seconds[/C][/ROW]
[ROW][C]R Server[/C][C]'Gwilym Jenkins' @ 72.249.127.135[/C][/ROW]
[/TABLE]
Source: https://freestatistics.org/blog/index.php?pk=58672&T=0

Globally Unique Identifier (entire table): ba.freestatistics.org/blog/index.php?pk=58672&T=0

As an alternative you can also use a QR Code:  

The GUIDs for individual cells are displayed in the table below:

Summary of computational transaction
Raw Inputview raw input (R code)
Raw Outputview raw output of R engine
Computing time3 seconds
R Server'Gwilym Jenkins' @ 72.249.127.135


Multiple Linear Regression - Estimated Regression Equation
AKB[t] = -324.26371948999 + 4.13127744296266AKW[t] + e[t]

\begin{tabular}{lllllllll}
\hline
Multiple Linear Regression - Estimated Regression Equation \tabularnewline
AKB[t] =  -324.26371948999 +  4.13127744296266AKW[t]  + e[t] \tabularnewline
\hline
\end{tabular}
%Source: https://freestatistics.org/blog/index.php?pk=58672&T=1

[TABLE]
[ROW][C]Multiple Linear Regression - Estimated Regression Equation[/C][/ROW]
[ROW][C]AKB[t] =  -324.26371948999 +  4.13127744296266AKW[t]  + e[t][/C][/ROW]
[/TABLE]
Source: https://freestatistics.org/blog/index.php?pk=58672&T=1

Globally Unique Identifier (entire table): ba.freestatistics.org/blog/index.php?pk=58672&T=1

As an alternative you can also use a QR Code:  

The GUIDs for individual cells are displayed in the table below:

Multiple Linear Regression - Estimated Regression Equation
AKB[t] = -324.26371948999 + 4.13127744296266AKW[t] + e[t]


Multiple Linear Regression - Ordinary Least Squares
VariableParameterS.D.T-STATH0: parameter = 02-tail p-value1-tail p-value
(Intercept)-324.2637194899980.04428-4.05110.0001517.5e-05
AKW4.131277442962660.7327995.63771e-060

\begin{tabular}{lllllllll}
\hline
Multiple Linear Regression - Ordinary Least Squares \tabularnewline
Variable & Parameter & S.D. & T-STATH0: parameter = 0 & 2-tail p-value & 1-tail p-value \tabularnewline
(Intercept) & -324.26371948999 & 80.04428 & -4.0511 & 0.000151 & 7.5e-05 \tabularnewline
AKW & 4.13127744296266 & 0.732799 & 5.6377 & 1e-06 & 0 \tabularnewline
\hline
\end{tabular}
%Source: https://freestatistics.org/blog/index.php?pk=58672&T=2

[TABLE]
[ROW][C]Multiple Linear Regression - Ordinary Least Squares[/C][/ROW]
[ROW][C]Variable[/C][C]Parameter[/C][C]S.D.[/C][C]T-STATH0: parameter = 0[/C][C]2-tail p-value[/C][C]1-tail p-value[/C][/ROW]
[ROW][C](Intercept)[/C][C]-324.26371948999[/C][C]80.04428[/C][C]-4.0511[/C][C]0.000151[/C][C]7.5e-05[/C][/ROW]
[ROW][C]AKW[/C][C]4.13127744296266[/C][C]0.732799[/C][C]5.6377[/C][C]1e-06[/C][C]0[/C][/ROW]
[/TABLE]
Source: https://freestatistics.org/blog/index.php?pk=58672&T=2

Globally Unique Identifier (entire table): ba.freestatistics.org/blog/index.php?pk=58672&T=2

As an alternative you can also use a QR Code:  

The GUIDs for individual cells are displayed in the table below:

Multiple Linear Regression - Ordinary Least Squares
VariableParameterS.D.T-STATH0: parameter = 02-tail p-value1-tail p-value
(Intercept)-324.2637194899980.04428-4.05110.0001517.5e-05
AKW4.131277442962660.7327995.63771e-060


Multiple Linear Regression - Regression Statistics
Multiple R0.591692965394288
R-squared0.350100565297086
Adjusted R-squared0.339085320641105
F-TEST (value)31.7832763802456
F-TEST (DF numerator)1
F-TEST (DF denominator)59
p-value5.11889629128959e-07
Multiple Linear Regression - Residual Statistics
Residual Standard Deviation10.9986129589431
Sum Squared Residuals7137.19973421724

\begin{tabular}{lllllllll}
\hline
Multiple Linear Regression - Regression Statistics \tabularnewline
Multiple R & 0.591692965394288 \tabularnewline
R-squared & 0.350100565297086 \tabularnewline
Adjusted R-squared & 0.339085320641105 \tabularnewline
F-TEST (value) & 31.7832763802456 \tabularnewline
F-TEST (DF numerator) & 1 \tabularnewline
F-TEST (DF denominator) & 59 \tabularnewline
p-value & 5.11889629128959e-07 \tabularnewline
Multiple Linear Regression - Residual Statistics \tabularnewline
Residual Standard Deviation & 10.9986129589431 \tabularnewline
Sum Squared Residuals & 7137.19973421724 \tabularnewline
\hline
\end{tabular}
%Source: https://freestatistics.org/blog/index.php?pk=58672&T=3

[TABLE]
[ROW][C]Multiple Linear Regression - Regression Statistics[/C][/ROW]
[ROW][C]Multiple R[/C][C]0.591692965394288[/C][/ROW]
[ROW][C]R-squared[/C][C]0.350100565297086[/C][/ROW]
[ROW][C]Adjusted R-squared[/C][C]0.339085320641105[/C][/ROW]
[ROW][C]F-TEST (value)[/C][C]31.7832763802456[/C][/ROW]
[ROW][C]F-TEST (DF numerator)[/C][C]1[/C][/ROW]
[ROW][C]F-TEST (DF denominator)[/C][C]59[/C][/ROW]
[ROW][C]p-value[/C][C]5.11889629128959e-07[/C][/ROW]
[ROW][C]Multiple Linear Regression - Residual Statistics[/C][/ROW]
[ROW][C]Residual Standard Deviation[/C][C]10.9986129589431[/C][/ROW]
[ROW][C]Sum Squared Residuals[/C][C]7137.19973421724[/C][/ROW]
[/TABLE]
Source: https://freestatistics.org/blog/index.php?pk=58672&T=3

Globally Unique Identifier (entire table): ba.freestatistics.org/blog/index.php?pk=58672&T=3

As an alternative you can also use a QR Code:  

The GUIDs for individual cells are displayed in the table below:

Multiple Linear Regression - Regression Statistics
Multiple R0.591692965394288
R-squared0.350100565297086
Adjusted R-squared0.339085320641105
F-TEST (value)31.7832763802456
F-TEST (DF numerator)1
F-TEST (DF denominator)59
p-value5.11889629128959e-07
Multiple Linear Regression - Residual Statistics
Residual Standard Deviation10.9986129589431
Sum Squared Residuals7137.19973421724


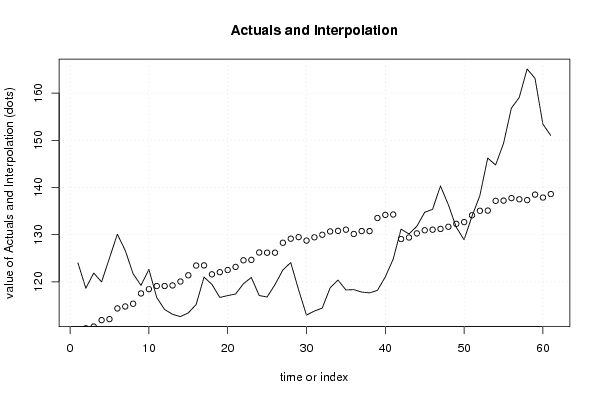
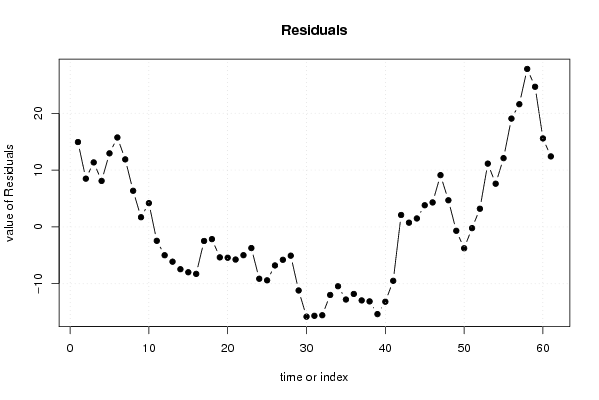
Multiple Linear Regression - Actuals, Interpolation, and Residuals
Time or IndexActualsInterpolationForecastResidualsPrediction Error
1124109.06597150236414.9340284976363
2118.63110.1401036375348.48989636246626
3121.86110.51191860740011.3480813925997
4119.97111.8752401635788.094759836422
5125.03112.08180403572612.9481959642738
6130.09114.35400662935615.7359933706444
7126.65114.76713437365211.8828656263481
8121.7115.3455132156676.35448678433336
9119.24117.5350902604371.70490973956313
10122.63118.4439712978894.18602870211135
11116.66119.104975688763-2.44497568876266
12114.12119.104975688763-4.98497568876265
13113.11119.228914012052-6.11891401205154
14112.61120.055169500644-7.44516950064408
15113.4121.377178282392-7.97717828239216
16115.18123.442817003873-8.26281700387348
17121.01123.484129778303-2.47412977830308
18119.44121.583742154540-2.14374215454029
19116.68122.038182673266-5.35818267326617
20117.07122.492623191992-5.42262319199207
21117.41123.153627582866-5.74362758286608
22119.58124.558261913473-4.9782619134734
23120.92124.640887462333-3.72088746233263
24117.09126.210772890658-9.12077289065848
25116.77126.169460116229-9.39946011622884
26119.39126.169460116229-6.77946011622883
27122.49128.276411612140-5.78641161213982
28124.08129.143979875162-5.06397987516195
29118.29129.474482070599-11.1844820705989
30112.94128.730852130866-15.7908521308657
31113.79129.433169296169-15.6431692961693
32114.43129.970235363754-15.5402353637545
33118.7130.672552529058-11.9725525290581
34120.36130.796490852347-10.4364908523470
35118.27131.044367498925-12.7743674989247
36118.34130.135486461473-11.7954864614730
37117.82130.755178077917-12.9351780779174
38117.65130.755178077917-13.1051780779174
39118.18133.523133964702-15.3431339647024
40121.02134.184138355576-13.1641383555764
41124.78134.266763904436-9.48676390443562
42131.16129.0613543263032.09864567369729
43130.14129.3918565217400.748143478260274
44131.75130.2594247847621.49057521523816
45134.73130.9204291756363.80957082436407
46135.35131.0443674989254.30563250107525
47140.32131.2096185966439.11038140335672
48136.35131.6640591153694.68594088463083
49131.6132.283750731814-0.683750731813591
50128.9132.655565701680-3.75556570168018
51133.89134.101512806717-0.211512806717161
52138.25135.0517066185993.19829338140142
53146.23135.09301939302811.1369806069718
54144.76137.1586581145107.6013418854905
55149.3137.19997088893912.1000291110609
56156.8137.73703695652419.0629630434757
57159.08137.48916030994621.5908396900535
58165.12137.32390921222827.796090787772
59163.14138.48066689625824.6593331037424
60153.43137.86097527981315.5690247201869
61151.01138.60460521954612.4053947804535

\begin{tabular}{lllllllll}
\hline
Multiple Linear Regression - Actuals, Interpolation, and Residuals \tabularnewline
Time or Index & Actuals & InterpolationForecast & ResidualsPrediction Error \tabularnewline
1 & 124 & 109.065971502364 & 14.9340284976363 \tabularnewline
2 & 118.63 & 110.140103637534 & 8.48989636246626 \tabularnewline
3 & 121.86 & 110.511918607400 & 11.3480813925997 \tabularnewline
4 & 119.97 & 111.875240163578 & 8.094759836422 \tabularnewline
5 & 125.03 & 112.081804035726 & 12.9481959642738 \tabularnewline
6 & 130.09 & 114.354006629356 & 15.7359933706444 \tabularnewline
7 & 126.65 & 114.767134373652 & 11.8828656263481 \tabularnewline
8 & 121.7 & 115.345513215667 & 6.35448678433336 \tabularnewline
9 & 119.24 & 117.535090260437 & 1.70490973956313 \tabularnewline
10 & 122.63 & 118.443971297889 & 4.18602870211135 \tabularnewline
11 & 116.66 & 119.104975688763 & -2.44497568876266 \tabularnewline
12 & 114.12 & 119.104975688763 & -4.98497568876265 \tabularnewline
13 & 113.11 & 119.228914012052 & -6.11891401205154 \tabularnewline
14 & 112.61 & 120.055169500644 & -7.44516950064408 \tabularnewline
15 & 113.4 & 121.377178282392 & -7.97717828239216 \tabularnewline
16 & 115.18 & 123.442817003873 & -8.26281700387348 \tabularnewline
17 & 121.01 & 123.484129778303 & -2.47412977830308 \tabularnewline
18 & 119.44 & 121.583742154540 & -2.14374215454029 \tabularnewline
19 & 116.68 & 122.038182673266 & -5.35818267326617 \tabularnewline
20 & 117.07 & 122.492623191992 & -5.42262319199207 \tabularnewline
21 & 117.41 & 123.153627582866 & -5.74362758286608 \tabularnewline
22 & 119.58 & 124.558261913473 & -4.9782619134734 \tabularnewline
23 & 120.92 & 124.640887462333 & -3.72088746233263 \tabularnewline
24 & 117.09 & 126.210772890658 & -9.12077289065848 \tabularnewline
25 & 116.77 & 126.169460116229 & -9.39946011622884 \tabularnewline
26 & 119.39 & 126.169460116229 & -6.77946011622883 \tabularnewline
27 & 122.49 & 128.276411612140 & -5.78641161213982 \tabularnewline
28 & 124.08 & 129.143979875162 & -5.06397987516195 \tabularnewline
29 & 118.29 & 129.474482070599 & -11.1844820705989 \tabularnewline
30 & 112.94 & 128.730852130866 & -15.7908521308657 \tabularnewline
31 & 113.79 & 129.433169296169 & -15.6431692961693 \tabularnewline
32 & 114.43 & 129.970235363754 & -15.5402353637545 \tabularnewline
33 & 118.7 & 130.672552529058 & -11.9725525290581 \tabularnewline
34 & 120.36 & 130.796490852347 & -10.4364908523470 \tabularnewline
35 & 118.27 & 131.044367498925 & -12.7743674989247 \tabularnewline
36 & 118.34 & 130.135486461473 & -11.7954864614730 \tabularnewline
37 & 117.82 & 130.755178077917 & -12.9351780779174 \tabularnewline
38 & 117.65 & 130.755178077917 & -13.1051780779174 \tabularnewline
39 & 118.18 & 133.523133964702 & -15.3431339647024 \tabularnewline
40 & 121.02 & 134.184138355576 & -13.1641383555764 \tabularnewline
41 & 124.78 & 134.266763904436 & -9.48676390443562 \tabularnewline
42 & 131.16 & 129.061354326303 & 2.09864567369729 \tabularnewline
43 & 130.14 & 129.391856521740 & 0.748143478260274 \tabularnewline
44 & 131.75 & 130.259424784762 & 1.49057521523816 \tabularnewline
45 & 134.73 & 130.920429175636 & 3.80957082436407 \tabularnewline
46 & 135.35 & 131.044367498925 & 4.30563250107525 \tabularnewline
47 & 140.32 & 131.209618596643 & 9.11038140335672 \tabularnewline
48 & 136.35 & 131.664059115369 & 4.68594088463083 \tabularnewline
49 & 131.6 & 132.283750731814 & -0.683750731813591 \tabularnewline
50 & 128.9 & 132.655565701680 & -3.75556570168018 \tabularnewline
51 & 133.89 & 134.101512806717 & -0.211512806717161 \tabularnewline
52 & 138.25 & 135.051706618599 & 3.19829338140142 \tabularnewline
53 & 146.23 & 135.093019393028 & 11.1369806069718 \tabularnewline
54 & 144.76 & 137.158658114510 & 7.6013418854905 \tabularnewline
55 & 149.3 & 137.199970888939 & 12.1000291110609 \tabularnewline
56 & 156.8 & 137.737036956524 & 19.0629630434757 \tabularnewline
57 & 159.08 & 137.489160309946 & 21.5908396900535 \tabularnewline
58 & 165.12 & 137.323909212228 & 27.796090787772 \tabularnewline
59 & 163.14 & 138.480666896258 & 24.6593331037424 \tabularnewline
60 & 153.43 & 137.860975279813 & 15.5690247201869 \tabularnewline
61 & 151.01 & 138.604605219546 & 12.4053947804535 \tabularnewline
\hline
\end{tabular}
%Source: https://freestatistics.org/blog/index.php?pk=58672&T=4

[TABLE]
[ROW][C]Multiple Linear Regression - Actuals, Interpolation, and Residuals[/C][/ROW]
[ROW][C]Time or Index[/C][C]Actuals[/C][C]InterpolationForecast[/C][C]ResidualsPrediction Error[/C][/ROW]
[ROW][C]1[/C][C]124[/C][C]109.065971502364[/C][C]14.9340284976363[/C][/ROW]
[ROW][C]2[/C][C]118.63[/C][C]110.140103637534[/C][C]8.48989636246626[/C][/ROW]
[ROW][C]3[/C][C]121.86[/C][C]110.511918607400[/C][C]11.3480813925997[/C][/ROW]
[ROW][C]4[/C][C]119.97[/C][C]111.875240163578[/C][C]8.094759836422[/C][/ROW]
[ROW][C]5[/C][C]125.03[/C][C]112.081804035726[/C][C]12.9481959642738[/C][/ROW]
[ROW][C]6[/C][C]130.09[/C][C]114.354006629356[/C][C]15.7359933706444[/C][/ROW]
[ROW][C]7[/C][C]126.65[/C][C]114.767134373652[/C][C]11.8828656263481[/C][/ROW]
[ROW][C]8[/C][C]121.7[/C][C]115.345513215667[/C][C]6.35448678433336[/C][/ROW]
[ROW][C]9[/C][C]119.24[/C][C]117.535090260437[/C][C]1.70490973956313[/C][/ROW]
[ROW][C]10[/C][C]122.63[/C][C]118.443971297889[/C][C]4.18602870211135[/C][/ROW]
[ROW][C]11[/C][C]116.66[/C][C]119.104975688763[/C][C]-2.44497568876266[/C][/ROW]
[ROW][C]12[/C][C]114.12[/C][C]119.104975688763[/C][C]-4.98497568876265[/C][/ROW]
[ROW][C]13[/C][C]113.11[/C][C]119.228914012052[/C][C]-6.11891401205154[/C][/ROW]
[ROW][C]14[/C][C]112.61[/C][C]120.055169500644[/C][C]-7.44516950064408[/C][/ROW]
[ROW][C]15[/C][C]113.4[/C][C]121.377178282392[/C][C]-7.97717828239216[/C][/ROW]
[ROW][C]16[/C][C]115.18[/C][C]123.442817003873[/C][C]-8.26281700387348[/C][/ROW]
[ROW][C]17[/C][C]121.01[/C][C]123.484129778303[/C][C]-2.47412977830308[/C][/ROW]
[ROW][C]18[/C][C]119.44[/C][C]121.583742154540[/C][C]-2.14374215454029[/C][/ROW]
[ROW][C]19[/C][C]116.68[/C][C]122.038182673266[/C][C]-5.35818267326617[/C][/ROW]
[ROW][C]20[/C][C]117.07[/C][C]122.492623191992[/C][C]-5.42262319199207[/C][/ROW]
[ROW][C]21[/C][C]117.41[/C][C]123.153627582866[/C][C]-5.74362758286608[/C][/ROW]
[ROW][C]22[/C][C]119.58[/C][C]124.558261913473[/C][C]-4.9782619134734[/C][/ROW]
[ROW][C]23[/C][C]120.92[/C][C]124.640887462333[/C][C]-3.72088746233263[/C][/ROW]
[ROW][C]24[/C][C]117.09[/C][C]126.210772890658[/C][C]-9.12077289065848[/C][/ROW]
[ROW][C]25[/C][C]116.77[/C][C]126.169460116229[/C][C]-9.39946011622884[/C][/ROW]
[ROW][C]26[/C][C]119.39[/C][C]126.169460116229[/C][C]-6.77946011622883[/C][/ROW]
[ROW][C]27[/C][C]122.49[/C][C]128.276411612140[/C][C]-5.78641161213982[/C][/ROW]
[ROW][C]28[/C][C]124.08[/C][C]129.143979875162[/C][C]-5.06397987516195[/C][/ROW]
[ROW][C]29[/C][C]118.29[/C][C]129.474482070599[/C][C]-11.1844820705989[/C][/ROW]
[ROW][C]30[/C][C]112.94[/C][C]128.730852130866[/C][C]-15.7908521308657[/C][/ROW]
[ROW][C]31[/C][C]113.79[/C][C]129.433169296169[/C][C]-15.6431692961693[/C][/ROW]
[ROW][C]32[/C][C]114.43[/C][C]129.970235363754[/C][C]-15.5402353637545[/C][/ROW]
[ROW][C]33[/C][C]118.7[/C][C]130.672552529058[/C][C]-11.9725525290581[/C][/ROW]
[ROW][C]34[/C][C]120.36[/C][C]130.796490852347[/C][C]-10.4364908523470[/C][/ROW]
[ROW][C]35[/C][C]118.27[/C][C]131.044367498925[/C][C]-12.7743674989247[/C][/ROW]
[ROW][C]36[/C][C]118.34[/C][C]130.135486461473[/C][C]-11.7954864614730[/C][/ROW]
[ROW][C]37[/C][C]117.82[/C][C]130.755178077917[/C][C]-12.9351780779174[/C][/ROW]
[ROW][C]38[/C][C]117.65[/C][C]130.755178077917[/C][C]-13.1051780779174[/C][/ROW]
[ROW][C]39[/C][C]118.18[/C][C]133.523133964702[/C][C]-15.3431339647024[/C][/ROW]
[ROW][C]40[/C][C]121.02[/C][C]134.184138355576[/C][C]-13.1641383555764[/C][/ROW]
[ROW][C]41[/C][C]124.78[/C][C]134.266763904436[/C][C]-9.48676390443562[/C][/ROW]
[ROW][C]42[/C][C]131.16[/C][C]129.061354326303[/C][C]2.09864567369729[/C][/ROW]
[ROW][C]43[/C][C]130.14[/C][C]129.391856521740[/C][C]0.748143478260274[/C][/ROW]
[ROW][C]44[/C][C]131.75[/C][C]130.259424784762[/C][C]1.49057521523816[/C][/ROW]
[ROW][C]45[/C][C]134.73[/C][C]130.920429175636[/C][C]3.80957082436407[/C][/ROW]
[ROW][C]46[/C][C]135.35[/C][C]131.044367498925[/C][C]4.30563250107525[/C][/ROW]
[ROW][C]47[/C][C]140.32[/C][C]131.209618596643[/C][C]9.11038140335672[/C][/ROW]
[ROW][C]48[/C][C]136.35[/C][C]131.664059115369[/C][C]4.68594088463083[/C][/ROW]
[ROW][C]49[/C][C]131.6[/C][C]132.283750731814[/C][C]-0.683750731813591[/C][/ROW]
[ROW][C]50[/C][C]128.9[/C][C]132.655565701680[/C][C]-3.75556570168018[/C][/ROW]
[ROW][C]51[/C][C]133.89[/C][C]134.101512806717[/C][C]-0.211512806717161[/C][/ROW]
[ROW][C]52[/C][C]138.25[/C][C]135.051706618599[/C][C]3.19829338140142[/C][/ROW]
[ROW][C]53[/C][C]146.23[/C][C]135.093019393028[/C][C]11.1369806069718[/C][/ROW]
[ROW][C]54[/C][C]144.76[/C][C]137.158658114510[/C][C]7.6013418854905[/C][/ROW]
[ROW][C]55[/C][C]149.3[/C][C]137.199970888939[/C][C]12.1000291110609[/C][/ROW]
[ROW][C]56[/C][C]156.8[/C][C]137.737036956524[/C][C]19.0629630434757[/C][/ROW]
[ROW][C]57[/C][C]159.08[/C][C]137.489160309946[/C][C]21.5908396900535[/C][/ROW]
[ROW][C]58[/C][C]165.12[/C][C]137.323909212228[/C][C]27.796090787772[/C][/ROW]
[ROW][C]59[/C][C]163.14[/C][C]138.480666896258[/C][C]24.6593331037424[/C][/ROW]
[ROW][C]60[/C][C]153.43[/C][C]137.860975279813[/C][C]15.5690247201869[/C][/ROW]
[ROW][C]61[/C][C]151.01[/C][C]138.604605219546[/C][C]12.4053947804535[/C][/ROW]
[/TABLE]
Source: https://freestatistics.org/blog/index.php?pk=58672&T=4

Globally Unique Identifier (entire table): ba.freestatistics.org/blog/index.php?pk=58672&T=4

As an alternative you can also use a QR Code:  

The GUIDs for individual cells are displayed in the table below:

Multiple Linear Regression - Actuals, Interpolation, and Residuals
Time or IndexActualsInterpolationForecastResidualsPrediction Error
1124109.06597150236414.9340284976363
2118.63110.1401036375348.48989636246626
3121.86110.51191860740011.3480813925997
4119.97111.8752401635788.094759836422
5125.03112.08180403572612.9481959642738
6130.09114.35400662935615.7359933706444
7126.65114.76713437365211.8828656263481
8121.7115.3455132156676.35448678433336
9119.24117.5350902604371.70490973956313
10122.63118.4439712978894.18602870211135
11116.66119.104975688763-2.44497568876266
12114.12119.104975688763-4.98497568876265
13113.11119.228914012052-6.11891401205154
14112.61120.055169500644-7.44516950064408
15113.4121.377178282392-7.97717828239216
16115.18123.442817003873-8.26281700387348
17121.01123.484129778303-2.47412977830308
18119.44121.583742154540-2.14374215454029
19116.68122.038182673266-5.35818267326617
20117.07122.492623191992-5.42262319199207
21117.41123.153627582866-5.74362758286608
22119.58124.558261913473-4.9782619134734
23120.92124.640887462333-3.72088746233263
24117.09126.210772890658-9.12077289065848
25116.77126.169460116229-9.39946011622884
26119.39126.169460116229-6.77946011622883
27122.49128.276411612140-5.78641161213982
28124.08129.143979875162-5.06397987516195
29118.29129.474482070599-11.1844820705989
30112.94128.730852130866-15.7908521308657
31113.79129.433169296169-15.6431692961693
32114.43129.970235363754-15.5402353637545
33118.7130.672552529058-11.9725525290581
34120.36130.796490852347-10.4364908523470
35118.27131.044367498925-12.7743674989247
36118.34130.135486461473-11.7954864614730
37117.82130.755178077917-12.9351780779174
38117.65130.755178077917-13.1051780779174
39118.18133.523133964702-15.3431339647024
40121.02134.184138355576-13.1641383555764
41124.78134.266763904436-9.48676390443562
42131.16129.0613543263032.09864567369729
43130.14129.3918565217400.748143478260274
44131.75130.2594247847621.49057521523816
45134.73130.9204291756363.80957082436407
46135.35131.0443674989254.30563250107525
47140.32131.2096185966439.11038140335672
48136.35131.6640591153694.68594088463083
49131.6132.283750731814-0.683750731813591
50128.9132.655565701680-3.75556570168018
51133.89134.101512806717-0.211512806717161
52138.25135.0517066185993.19829338140142
53146.23135.09301939302811.1369806069718
54144.76137.1586581145107.6013418854905
55149.3137.19997088893912.1000291110609
56156.8137.73703695652419.0629630434757
57159.08137.48916030994621.5908396900535
58165.12137.32390921222827.796090787772
59163.14138.48066689625824.6593331037424
60153.43137.86097527981315.5690247201869
61151.01138.60460521954612.4053947804535


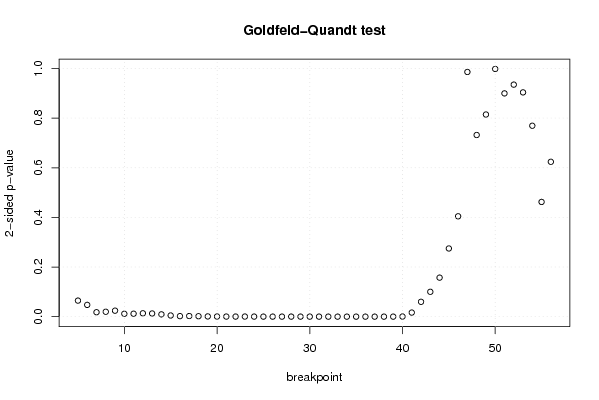
Goldfeld-Quandt test for Heteroskedasticity
p-valuesAlternative Hypothesis
breakpoint indexgreater2-sidedless
50.03233397857568920.06466795715137840.96766602142431
60.02369545846709880.04739091693419760.976304541532901
70.008895679768343020.01779135953668600.991104320231657
80.009810270516662820.01962054103332560.990189729483337
90.01202302579125940.02404605158251880.98797697420874
100.005788725338934450.01157745067786890.994211274661066
110.005931981068381570.01186396213676310.994068018931618
120.006752332316476290.01350466463295260.993247667683524
130.006382781070313310.01276556214062660.993617218929687
140.004622555000408770.009245110000817550.99537744499959
150.002334587706534520.004669175413069040.997665412293466
160.001057447449553180.002114894899106350.998942552550447
170.001213121972660430.002426243945320850.99878687802734
180.00084470598847390.00168941197694780.999155294011526
190.0004658826568154220.0009317653136308440.999534117343185
200.0002715095408416150.000543019081683230.999728490459158
210.0001675188441142290.0003350376882284590.999832481155886
220.0001433485361988790.0002866970723977580.999856651463801
230.0001846621545610570.0003693243091221150.999815337845439
249.3777977312736e-050.0001875559546254720.999906222022687
254.73326140050232e-059.46652280100464e-050.999952667385995
263.86491551491283e-057.72983102982566e-050.99996135084485
275.34763852142829e-050.0001069527704285660.999946523614786
288.4209768578289e-050.0001684195371565780.999915790231422
293.75747516576545e-057.5149503315309e-050.999962425248342
302.55594798317794e-055.11189596635588e-050.999974440520168
311.50378912988112e-053.00757825976223e-050.999984962108701
328.86278972851534e-061.77255794570307e-050.999991137210271
335.13918003001576e-061.02783600600315e-050.99999486081997
343.46075795142004e-066.92151590284007e-060.999996539242049
352.31419103828117e-064.62838207656234e-060.999997685808962
361.21055476832721e-062.42110953665443e-060.999998789445232
378.73210616359912e-071.74642123271982e-060.999999126789384
387.64552701127978e-071.52910540225596e-060.999999235447299
397.12726315410073e-061.42545263082015e-050.999992872736846
400.0002156042615374300.0004312085230748600.999784395738463
410.008233963169731240.01646792633946250.991766036830269
420.02989469779214420.05978939558428850.970105302207856
430.05006324005197750.1001264801039550.949936759948023
440.07860389726237040.1572077945247410.92139610273763
450.1373691649064460.2747383298128920.862630835093554
460.2021627633815860.4043255267631730.797837236618414
470.4930146368846080.9860292737692170.506985363115392
480.6339957885745190.7320084228509620.366004211425481
490.5927211926480120.8145576147039750.407278807351988
500.5009179949408760.9981640101182480.499082005059124
510.4498769307012900.8997538614025790.550123069298710
520.467468258218040.934936516436080.53253174178196
530.4518675036285470.9037350072570940.548132496371453
540.6153505595753160.7692988808493680.384649440424684
550.7688816757967780.4622366484064440.231118324203222
560.6880001772286020.6239996455427950.311999822771398

\begin{tabular}{lllllllll}
\hline
Goldfeld-Quandt test for Heteroskedasticity \tabularnewline
p-values & Alternative Hypothesis \tabularnewline
breakpoint index & greater & 2-sided & less \tabularnewline
5 & 0.0323339785756892 & 0.0646679571513784 & 0.96766602142431 \tabularnewline
6 & 0.0236954584670988 & 0.0473909169341976 & 0.976304541532901 \tabularnewline
7 & 0.00889567976834302 & 0.0177913595366860 & 0.991104320231657 \tabularnewline
8 & 0.00981027051666282 & 0.0196205410333256 & 0.990189729483337 \tabularnewline
9 & 0.0120230257912594 & 0.0240460515825188 & 0.98797697420874 \tabularnewline
10 & 0.00578872533893445 & 0.0115774506778689 & 0.994211274661066 \tabularnewline
11 & 0.00593198106838157 & 0.0118639621367631 & 0.994068018931618 \tabularnewline
12 & 0.00675233231647629 & 0.0135046646329526 & 0.993247667683524 \tabularnewline
13 & 0.00638278107031331 & 0.0127655621406266 & 0.993617218929687 \tabularnewline
14 & 0.00462255500040877 & 0.00924511000081755 & 0.99537744499959 \tabularnewline
15 & 0.00233458770653452 & 0.00466917541306904 & 0.997665412293466 \tabularnewline
16 & 0.00105744744955318 & 0.00211489489910635 & 0.998942552550447 \tabularnewline
17 & 0.00121312197266043 & 0.00242624394532085 & 0.99878687802734 \tabularnewline
18 & 0.0008447059884739 & 0.0016894119769478 & 0.999155294011526 \tabularnewline
19 & 0.000465882656815422 & 0.000931765313630844 & 0.999534117343185 \tabularnewline
20 & 0.000271509540841615 & 0.00054301908168323 & 0.999728490459158 \tabularnewline
21 & 0.000167518844114229 & 0.000335037688228459 & 0.999832481155886 \tabularnewline
22 & 0.000143348536198879 & 0.000286697072397758 & 0.999856651463801 \tabularnewline
23 & 0.000184662154561057 & 0.000369324309122115 & 0.999815337845439 \tabularnewline
24 & 9.3777977312736e-05 & 0.000187555954625472 & 0.999906222022687 \tabularnewline
25 & 4.73326140050232e-05 & 9.46652280100464e-05 & 0.999952667385995 \tabularnewline
26 & 3.86491551491283e-05 & 7.72983102982566e-05 & 0.99996135084485 \tabularnewline
27 & 5.34763852142829e-05 & 0.000106952770428566 & 0.999946523614786 \tabularnewline
28 & 8.4209768578289e-05 & 0.000168419537156578 & 0.999915790231422 \tabularnewline
29 & 3.75747516576545e-05 & 7.5149503315309e-05 & 0.999962425248342 \tabularnewline
30 & 2.55594798317794e-05 & 5.11189596635588e-05 & 0.999974440520168 \tabularnewline
31 & 1.50378912988112e-05 & 3.00757825976223e-05 & 0.999984962108701 \tabularnewline
32 & 8.86278972851534e-06 & 1.77255794570307e-05 & 0.999991137210271 \tabularnewline
33 & 5.13918003001576e-06 & 1.02783600600315e-05 & 0.99999486081997 \tabularnewline
34 & 3.46075795142004e-06 & 6.92151590284007e-06 & 0.999996539242049 \tabularnewline
35 & 2.31419103828117e-06 & 4.62838207656234e-06 & 0.999997685808962 \tabularnewline
36 & 1.21055476832721e-06 & 2.42110953665443e-06 & 0.999998789445232 \tabularnewline
37 & 8.73210616359912e-07 & 1.74642123271982e-06 & 0.999999126789384 \tabularnewline
38 & 7.64552701127978e-07 & 1.52910540225596e-06 & 0.999999235447299 \tabularnewline
39 & 7.12726315410073e-06 & 1.42545263082015e-05 & 0.999992872736846 \tabularnewline
40 & 0.000215604261537430 & 0.000431208523074860 & 0.999784395738463 \tabularnewline
41 & 0.00823396316973124 & 0.0164679263394625 & 0.991766036830269 \tabularnewline
42 & 0.0298946977921442 & 0.0597893955842885 & 0.970105302207856 \tabularnewline
43 & 0.0500632400519775 & 0.100126480103955 & 0.949936759948023 \tabularnewline
44 & 0.0786038972623704 & 0.157207794524741 & 0.92139610273763 \tabularnewline
45 & 0.137369164906446 & 0.274738329812892 & 0.862630835093554 \tabularnewline
46 & 0.202162763381586 & 0.404325526763173 & 0.797837236618414 \tabularnewline
47 & 0.493014636884608 & 0.986029273769217 & 0.506985363115392 \tabularnewline
48 & 0.633995788574519 & 0.732008422850962 & 0.366004211425481 \tabularnewline
49 & 0.592721192648012 & 0.814557614703975 & 0.407278807351988 \tabularnewline
50 & 0.500917994940876 & 0.998164010118248 & 0.499082005059124 \tabularnewline
51 & 0.449876930701290 & 0.899753861402579 & 0.550123069298710 \tabularnewline
52 & 0.46746825821804 & 0.93493651643608 & 0.53253174178196 \tabularnewline
53 & 0.451867503628547 & 0.903735007257094 & 0.548132496371453 \tabularnewline
54 & 0.615350559575316 & 0.769298880849368 & 0.384649440424684 \tabularnewline
55 & 0.768881675796778 & 0.462236648406444 & 0.231118324203222 \tabularnewline
56 & 0.688000177228602 & 0.623999645542795 & 0.311999822771398 \tabularnewline
\hline
\end{tabular}
%Source: https://freestatistics.org/blog/index.php?pk=58672&T=5

[TABLE]
[ROW][C]Goldfeld-Quandt test for Heteroskedasticity[/C][/ROW]
[ROW][C]p-values[/C][C]Alternative Hypothesis[/C][/ROW]
[ROW][C]breakpoint index[/C][C]greater[/C][C]2-sided[/C][C]less[/C][/ROW]
[ROW][C]5[/C][C]0.0323339785756892[/C][C]0.0646679571513784[/C][C]0.96766602142431[/C][/ROW]
[ROW][C]6[/C][C]0.0236954584670988[/C][C]0.0473909169341976[/C][C]0.976304541532901[/C][/ROW]
[ROW][C]7[/C][C]0.00889567976834302[/C][C]0.0177913595366860[/C][C]0.991104320231657[/C][/ROW]
[ROW][C]8[/C][C]0.00981027051666282[/C][C]0.0196205410333256[/C][C]0.990189729483337[/C][/ROW]
[ROW][C]9[/C][C]0.0120230257912594[/C][C]0.0240460515825188[/C][C]0.98797697420874[/C][/ROW]
[ROW][C]10[/C][C]0.00578872533893445[/C][C]0.0115774506778689[/C][C]0.994211274661066[/C][/ROW]
[ROW][C]11[/C][C]0.00593198106838157[/C][C]0.0118639621367631[/C][C]0.994068018931618[/C][/ROW]
[ROW][C]12[/C][C]0.00675233231647629[/C][C]0.0135046646329526[/C][C]0.993247667683524[/C][/ROW]
[ROW][C]13[/C][C]0.00638278107031331[/C][C]0.0127655621406266[/C][C]0.993617218929687[/C][/ROW]
[ROW][C]14[/C][C]0.00462255500040877[/C][C]0.00924511000081755[/C][C]0.99537744499959[/C][/ROW]
[ROW][C]15[/C][C]0.00233458770653452[/C][C]0.00466917541306904[/C][C]0.997665412293466[/C][/ROW]
[ROW][C]16[/C][C]0.00105744744955318[/C][C]0.00211489489910635[/C][C]0.998942552550447[/C][/ROW]
[ROW][C]17[/C][C]0.00121312197266043[/C][C]0.00242624394532085[/C][C]0.99878687802734[/C][/ROW]
[ROW][C]18[/C][C]0.0008447059884739[/C][C]0.0016894119769478[/C][C]0.999155294011526[/C][/ROW]
[ROW][C]19[/C][C]0.000465882656815422[/C][C]0.000931765313630844[/C][C]0.999534117343185[/C][/ROW]
[ROW][C]20[/C][C]0.000271509540841615[/C][C]0.00054301908168323[/C][C]0.999728490459158[/C][/ROW]
[ROW][C]21[/C][C]0.000167518844114229[/C][C]0.000335037688228459[/C][C]0.999832481155886[/C][/ROW]
[ROW][C]22[/C][C]0.000143348536198879[/C][C]0.000286697072397758[/C][C]0.999856651463801[/C][/ROW]
[ROW][C]23[/C][C]0.000184662154561057[/C][C]0.000369324309122115[/C][C]0.999815337845439[/C][/ROW]
[ROW][C]24[/C][C]9.3777977312736e-05[/C][C]0.000187555954625472[/C][C]0.999906222022687[/C][/ROW]
[ROW][C]25[/C][C]4.73326140050232e-05[/C][C]9.46652280100464e-05[/C][C]0.999952667385995[/C][/ROW]
[ROW][C]26[/C][C]3.86491551491283e-05[/C][C]7.72983102982566e-05[/C][C]0.99996135084485[/C][/ROW]
[ROW][C]27[/C][C]5.34763852142829e-05[/C][C]0.000106952770428566[/C][C]0.999946523614786[/C][/ROW]
[ROW][C]28[/C][C]8.4209768578289e-05[/C][C]0.000168419537156578[/C][C]0.999915790231422[/C][/ROW]
[ROW][C]29[/C][C]3.75747516576545e-05[/C][C]7.5149503315309e-05[/C][C]0.999962425248342[/C][/ROW]
[ROW][C]30[/C][C]2.55594798317794e-05[/C][C]5.11189596635588e-05[/C][C]0.999974440520168[/C][/ROW]
[ROW][C]31[/C][C]1.50378912988112e-05[/C][C]3.00757825976223e-05[/C][C]0.999984962108701[/C][/ROW]
[ROW][C]32[/C][C]8.86278972851534e-06[/C][C]1.77255794570307e-05[/C][C]0.999991137210271[/C][/ROW]
[ROW][C]33[/C][C]5.13918003001576e-06[/C][C]1.02783600600315e-05[/C][C]0.99999486081997[/C][/ROW]
[ROW][C]34[/C][C]3.46075795142004e-06[/C][C]6.92151590284007e-06[/C][C]0.999996539242049[/C][/ROW]
[ROW][C]35[/C][C]2.31419103828117e-06[/C][C]4.62838207656234e-06[/C][C]0.999997685808962[/C][/ROW]
[ROW][C]36[/C][C]1.21055476832721e-06[/C][C]2.42110953665443e-06[/C][C]0.999998789445232[/C][/ROW]
[ROW][C]37[/C][C]8.73210616359912e-07[/C][C]1.74642123271982e-06[/C][C]0.999999126789384[/C][/ROW]
[ROW][C]38[/C][C]7.64552701127978e-07[/C][C]1.52910540225596e-06[/C][C]0.999999235447299[/C][/ROW]
[ROW][C]39[/C][C]7.12726315410073e-06[/C][C]1.42545263082015e-05[/C][C]0.999992872736846[/C][/ROW]
[ROW][C]40[/C][C]0.000215604261537430[/C][C]0.000431208523074860[/C][C]0.999784395738463[/C][/ROW]
[ROW][C]41[/C][C]0.00823396316973124[/C][C]0.0164679263394625[/C][C]0.991766036830269[/C][/ROW]
[ROW][C]42[/C][C]0.0298946977921442[/C][C]0.0597893955842885[/C][C]0.970105302207856[/C][/ROW]
[ROW][C]43[/C][C]0.0500632400519775[/C][C]0.100126480103955[/C][C]0.949936759948023[/C][/ROW]
[ROW][C]44[/C][C]0.0786038972623704[/C][C]0.157207794524741[/C][C]0.92139610273763[/C][/ROW]
[ROW][C]45[/C][C]0.137369164906446[/C][C]0.274738329812892[/C][C]0.862630835093554[/C][/ROW]
[ROW][C]46[/C][C]0.202162763381586[/C][C]0.404325526763173[/C][C]0.797837236618414[/C][/ROW]
[ROW][C]47[/C][C]0.493014636884608[/C][C]0.986029273769217[/C][C]0.506985363115392[/C][/ROW]
[ROW][C]48[/C][C]0.633995788574519[/C][C]0.732008422850962[/C][C]0.366004211425481[/C][/ROW]
[ROW][C]49[/C][C]0.592721192648012[/C][C]0.814557614703975[/C][C]0.407278807351988[/C][/ROW]
[ROW][C]50[/C][C]0.500917994940876[/C][C]0.998164010118248[/C][C]0.499082005059124[/C][/ROW]
[ROW][C]51[/C][C]0.449876930701290[/C][C]0.899753861402579[/C][C]0.550123069298710[/C][/ROW]
[ROW][C]52[/C][C]0.46746825821804[/C][C]0.93493651643608[/C][C]0.53253174178196[/C][/ROW]
[ROW][C]53[/C][C]0.451867503628547[/C][C]0.903735007257094[/C][C]0.548132496371453[/C][/ROW]
[ROW][C]54[/C][C]0.615350559575316[/C][C]0.769298880849368[/C][C]0.384649440424684[/C][/ROW]
[ROW][C]55[/C][C]0.768881675796778[/C][C]0.462236648406444[/C][C]0.231118324203222[/C][/ROW]
[ROW][C]56[/C][C]0.688000177228602[/C][C]0.623999645542795[/C][C]0.311999822771398[/C][/ROW]
[/TABLE]
Source: https://freestatistics.org/blog/index.php?pk=58672&T=5

Globally Unique Identifier (entire table): ba.freestatistics.org/blog/index.php?pk=58672&T=5

As an alternative you can also use a QR Code:  

The GUIDs for individual cells are displayed in the table below:

Goldfeld-Quandt test for Heteroskedasticity
p-valuesAlternative Hypothesis
breakpoint indexgreater2-sidedless
50.03233397857568920.06466795715137840.96766602142431
60.02369545846709880.04739091693419760.976304541532901
70.008895679768343020.01779135953668600.991104320231657
80.009810270516662820.01962054103332560.990189729483337
90.01202302579125940.02404605158251880.98797697420874
100.005788725338934450.01157745067786890.994211274661066
110.005931981068381570.01186396213676310.994068018931618
120.006752332316476290.01350466463295260.993247667683524
130.006382781070313310.01276556214062660.993617218929687
140.004622555000408770.009245110000817550.99537744499959
150.002334587706534520.004669175413069040.997665412293466
160.001057447449553180.002114894899106350.998942552550447
170.001213121972660430.002426243945320850.99878687802734
180.00084470598847390.00168941197694780.999155294011526
190.0004658826568154220.0009317653136308440.999534117343185
200.0002715095408416150.000543019081683230.999728490459158
210.0001675188441142290.0003350376882284590.999832481155886
220.0001433485361988790.0002866970723977580.999856651463801
230.0001846621545610570.0003693243091221150.999815337845439
249.3777977312736e-050.0001875559546254720.999906222022687
254.73326140050232e-059.46652280100464e-050.999952667385995
263.86491551491283e-057.72983102982566e-050.99996135084485
275.34763852142829e-050.0001069527704285660.999946523614786
288.4209768578289e-050.0001684195371565780.999915790231422
293.75747516576545e-057.5149503315309e-050.999962425248342
302.55594798317794e-055.11189596635588e-050.999974440520168
311.50378912988112e-053.00757825976223e-050.999984962108701
328.86278972851534e-061.77255794570307e-050.999991137210271
335.13918003001576e-061.02783600600315e-050.99999486081997
343.46075795142004e-066.92151590284007e-060.999996539242049
352.31419103828117e-064.62838207656234e-060.999997685808962
361.21055476832721e-062.42110953665443e-060.999998789445232
378.73210616359912e-071.74642123271982e-060.999999126789384
387.64552701127978e-071.52910540225596e-060.999999235447299
397.12726315410073e-061.42545263082015e-050.999992872736846
400.0002156042615374300.0004312085230748600.999784395738463
410.008233963169731240.01646792633946250.991766036830269
420.02989469779214420.05978939558428850.970105302207856
430.05006324005197750.1001264801039550.949936759948023
440.07860389726237040.1572077945247410.92139610273763
450.1373691649064460.2747383298128920.862630835093554
460.2021627633815860.4043255267631730.797837236618414
470.4930146368846080.9860292737692170.506985363115392
480.6339957885745190.7320084228509620.366004211425481
490.5927211926480120.8145576147039750.407278807351988
500.5009179949408760.9981640101182480.499082005059124
510.4498769307012900.8997538614025790.550123069298710
520.467468258218040.934936516436080.53253174178196
530.4518675036285470.9037350072570940.548132496371453
540.6153505595753160.7692988808493680.384649440424684
550.7688816757967780.4622366484064440.231118324203222
560.6880001772286020.6239996455427950.311999822771398


Meta Analysis of Goldfeld-Quandt test for Heteroskedasticity
Description# significant tests% significant testsOK/NOK
1% type I error level270.519230769230769NOK
5% type I error level360.692307692307692NOK
10% type I error level380.730769230769231NOK

\begin{tabular}{lllllllll}
\hline
Meta Analysis of Goldfeld-Quandt test for Heteroskedasticity \tabularnewline
Description & # significant tests & % significant tests & OK/NOK \tabularnewline
1% type I error level & 27 & 0.519230769230769 & NOK \tabularnewline
5% type I error level & 36 & 0.692307692307692 & NOK \tabularnewline
10% type I error level & 38 & 0.730769230769231 & NOK \tabularnewline
\hline
\end{tabular}
%Source: https://freestatistics.org/blog/index.php?pk=58672&T=6

[TABLE]
[ROW][C]Meta Analysis of Goldfeld-Quandt test for Heteroskedasticity[/C][/ROW]
[ROW][C]Description[/C][C]# significant tests[/C][C]% significant tests[/C][C]OK/NOK[/C][/ROW]
[ROW][C]1% type I error level[/C][C]27[/C][C]0.519230769230769[/C][C]NOK[/C][/ROW]
[ROW][C]5% type I error level[/C][C]36[/C][C]0.692307692307692[/C][C]NOK[/C][/ROW]
[ROW][C]10% type I error level[/C][C]38[/C][C]0.730769230769231[/C][C]NOK[/C][/ROW]
[/TABLE]
Source: https://freestatistics.org/blog/index.php?pk=58672&T=6

Globally Unique Identifier (entire table): ba.freestatistics.org/blog/index.php?pk=58672&T=6

As an alternative you can also use a QR Code:  

The GUIDs for individual cells are displayed in the table below:

Meta Analysis of Goldfeld-Quandt test for Heteroskedasticity
Description# significant tests% significant testsOK/NOK
1% type I error level270.519230769230769NOK
5% type I error level360.692307692307692NOK
10% type I error level380.730769230769231NOK


Parameters (Session):
par1 = 1 ; par2 = Do not include Seasonal Dummies ; par3 = No Linear Trend ;
Parameters (R input):
par1 = 1 ; par2 = Do not include Seasonal Dummies ; par3 = No Linear Trend ;
R code (references can be found in the software module):
library(lattice)
library(lmtest)
n25 <- 25 #minimum number of obs. for Goldfeld-Quandt test
par1 <- as.numeric(par1)
x <- t(y)
k <- length(x[1,])
n <- length(x[,1])
x1 <- cbind(x[,par1], x[,1:k!=par1])
mycolnames <- c(colnames(x)[par1], colnames(x)[1:k!=par1])
colnames(x1) <- mycolnames #colnames(x)[par1]
x <- x1
if (par3 == 'First Differences'){
x2 <- array(0, dim=c(n-1,k), dimnames=list(1:(n-1), paste('(1-B)',colnames(x),sep='')))
for (i in 1:n-1) {
for (j in 1:k) {
x2[i,j] <- x[i+1,j] - x[i,j]
}
}
x <- x2
}
if (par2 == 'Include Monthly Dummies'){
x2 <- array(0, dim=c(n,11), dimnames=list(1:n, paste('M', seq(1:11), sep ='')))
for (i in 1:11){
x2[seq(i,n,12),i] <- 1
}
x <- cbind(x, x2)
}
if (par2 == 'Include Quarterly Dummies'){
x2 <- array(0, dim=c(n,3), dimnames=list(1:n, paste('Q', seq(1:3), sep ='')))
for (i in 1:3){
x2[seq(i,n,4),i] <- 1
}
x <- cbind(x, x2)
}
k <- length(x[1,])
if (par3 == 'Linear Trend'){
x <- cbind(x, c(1:n))
colnames(x)[k+1] <- 't'
}
x
k <- length(x[1,])
df <- as.data.frame(x)
(mylm <- lm(df))
(mysum <- summary(mylm))
if (n > n25) {
kp3 <- k + 3
nmkm3 <- n - k - 3
gqarr <- array(NA, dim=c(nmkm3-kp3+1,3))
numgqtests <- 0
numsignificant1 <- 0
numsignificant5 <- 0
numsignificant10 <- 0
for (mypoint in kp3:nmkm3) {
j <- 0
numgqtests <- numgqtests + 1
for (myalt in c('greater', 'two.sided', 'less')) {
j <- j + 1
gqarr[mypoint-kp3+1,j] <- gqtest(mylm, point=mypoint, alternative=myalt)$p.value
}
if (gqarr[mypoint-kp3+1,2] < 0.01) numsignificant1 <- numsignificant1 + 1
if (gqarr[mypoint-kp3+1,2] < 0.05) numsignificant5 <- numsignificant5 + 1
if (gqarr[mypoint-kp3+1,2] < 0.10) numsignificant10 <- numsignificant10 + 1
}
gqarr
}
bitmap(file='test0.png')
plot(x[,1], type='l', main='Actuals and Interpolation', ylab='value of Actuals and Interpolation (dots)', xlab='time or index')
points(x[,1]-mysum$resid)
grid()
dev.off()
bitmap(file='test1.png')
plot(mysum$resid, type='b', pch=19, main='Residuals', ylab='value of Residuals', xlab='time or index')
grid()
dev.off()
bitmap(file='test2.png')
hist(mysum$resid, main='Residual Histogram', xlab='values of Residuals')
grid()
dev.off()
bitmap(file='test3.png')
densityplot(~mysum$resid,col='black',main='Residual Density Plot', xlab='values of Residuals')
dev.off()
bitmap(file='test4.png')
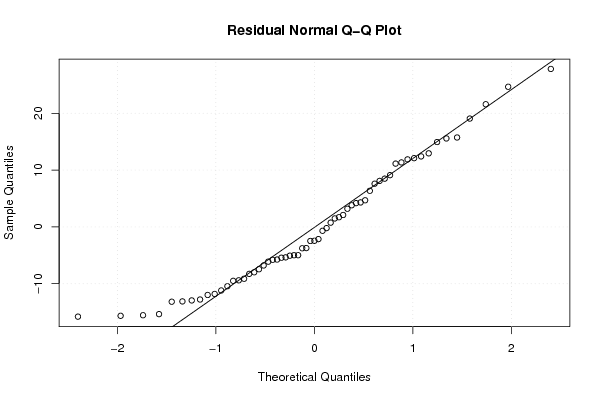
qqnorm(mysum$resid, main='Residual Normal Q-Q Plot')
qqline(mysum$resid)
grid()
dev.off()
(myerror <- as.ts(mysum$resid))
bitmap(file='test5.png')
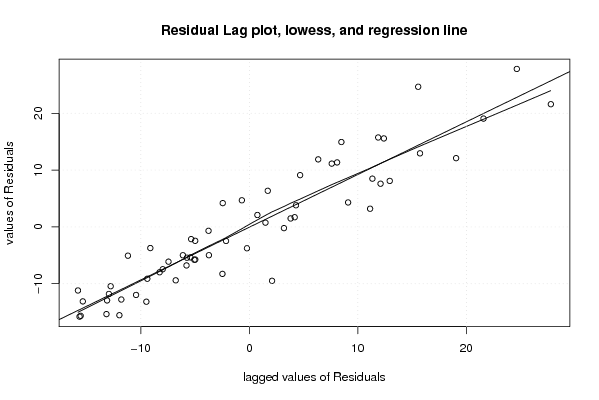
dum <- cbind(lag(myerror,k=1),myerror)
dum
dum1 <- dum[2:length(myerror),]
dum1
z <- as.data.frame(dum1)
z
plot(z,main=paste('Residual Lag plot, lowess, and regression line'), ylab='values of Residuals', xlab='lagged values of Residuals')
lines(lowess(z))
abline(lm(z))
grid()
dev.off()
bitmap(file='test6.png')
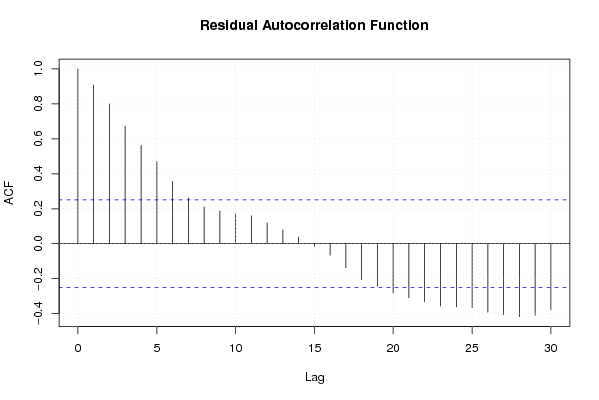
acf(mysum$resid, lag.max=length(mysum$resid)/2, main='Residual Autocorrelation Function')
grid()
dev.off()
bitmap(file='test7.png')
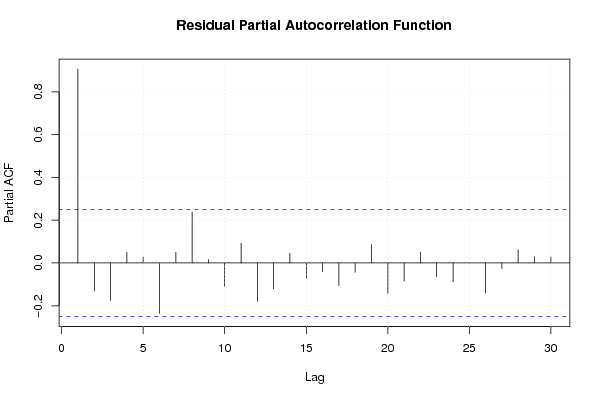
pacf(mysum$resid, lag.max=length(mysum$resid)/2, main='Residual Partial Autocorrelation Function')
grid()
dev.off()
bitmap(file='test8.png')
opar <- par(mfrow = c(2,2), oma = c(0, 0, 1.1, 0))
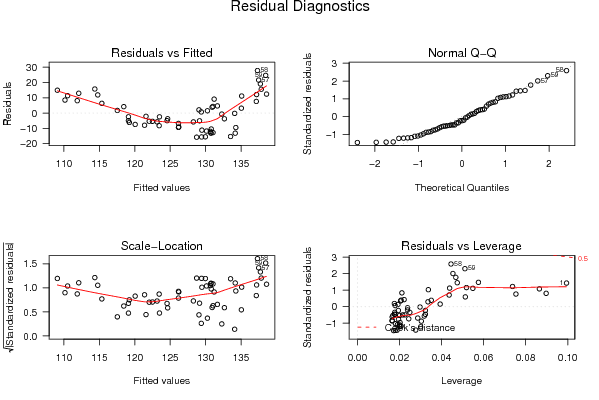
plot(mylm, las = 1, sub='Residual Diagnostics')
par(opar)
dev.off()
if (n > n25) {
bitmap(file='test9.png')
plot(kp3:nmkm3,gqarr[,2], main='Goldfeld-Quandt test',ylab='2-sided p-value',xlab='breakpoint')
grid()
dev.off()
}
load(file='createtable')
a<-table.start()
a<-table.row.start(a)
a<-table.element(a, 'Multiple Linear Regression - Estimated Regression Equation', 1, TRUE)
a<-table.row.end(a)
myeq <- colnames(x)[1]
myeq <- paste(myeq, '[t] = ', sep='')
for (i in 1:k){
if (mysum$coefficients[i,1] > 0) myeq <- paste(myeq, '+', '')
myeq <- paste(myeq, mysum$coefficients[i,1], sep=' ')
if (rownames(mysum$coefficients)[i] != '(Intercept)') {
myeq <- paste(myeq, rownames(mysum$coefficients)[i], sep='')
if (rownames(mysum$coefficients)[i] != 't') myeq <- paste(myeq, '[t]', sep='')
}
}
myeq <- paste(myeq, ' + e[t]')
a<-table.row.start(a)
a<-table.element(a, myeq)
a<-table.row.end(a)
a<-table.end(a)
table.save(a,file='mytable1.tab')
a<-table.start()
a<-table.row.start(a)
a<-table.element(a,hyperlink('ols1.htm','Multiple Linear Regression - Ordinary Least Squares',''), 6, TRUE)
a<-table.row.end(a)
a<-table.row.start(a)
a<-table.element(a,'Variable',header=TRUE)
a<-table.element(a,'Parameter',header=TRUE)
a<-table.element(a,'S.D.',header=TRUE)
a<-table.element(a,'T-STAT
H0: parameter = 0',header=TRUE)
a<-table.element(a,'2-tail p-value',header=TRUE)
a<-table.element(a,'1-tail p-value',header=TRUE)
a<-table.row.end(a)
for (i in 1:k){
a<-table.row.start(a)
a<-table.element(a,rownames(mysum$coefficients)[i],header=TRUE)
a<-table.element(a,mysum$coefficients[i,1])
a<-table.element(a, round(mysum$coefficients[i,2],6))
a<-table.element(a, round(mysum$coefficients[i,3],4))
a<-table.element(a, round(mysum$coefficients[i,4],6))
a<-table.element(a, round(mysum$coefficients[i,4]/2,6))
a<-table.row.end(a)
}
a<-table.end(a)
table.save(a,file='mytable2.tab')
a<-table.start()
a<-table.row.start(a)
a<-table.element(a, 'Multiple Linear Regression - Regression Statistics', 2, TRUE)
a<-table.row.end(a)
a<-table.row.start(a)
a<-table.element(a, 'Multiple R',1,TRUE)
a<-table.element(a, sqrt(mysum$r.squared))
a<-table.row.end(a)
a<-table.row.start(a)
a<-table.element(a, 'R-squared',1,TRUE)
a<-table.element(a, mysum$r.squared)
a<-table.row.end(a)
a<-table.row.start(a)
a<-table.element(a, 'Adjusted R-squared',1,TRUE)
a<-table.element(a, mysum$adj.r.squared)
a<-table.row.end(a)
a<-table.row.start(a)
a<-table.element(a, 'F-TEST (value)',1,TRUE)
a<-table.element(a, mysum$fstatistic[1])
a<-table.row.end(a)
a<-table.row.start(a)
a<-table.element(a, 'F-TEST (DF numerator)',1,TRUE)
a<-table.element(a, mysum$fstatistic[2])
a<-table.row.end(a)
a<-table.row.start(a)
a<-table.element(a, 'F-TEST (DF denominator)',1,TRUE)
a<-table.element(a, mysum$fstatistic[3])
a<-table.row.end(a)
a<-table.row.start(a)
a<-table.element(a, 'p-value',1,TRUE)
a<-table.element(a, 1-pf(mysum$fstatistic[1],mysum$fstatistic[2],mysum$fstatistic[3]))
a<-table.row.end(a)
a<-table.row.start(a)
a<-table.element(a, 'Multiple Linear Regression - Residual Statistics', 2, TRUE)
a<-table.row.end(a)
a<-table.row.start(a)
a<-table.element(a, 'Residual Standard Deviation',1,TRUE)
a<-table.element(a, mysum$sigma)
a<-table.row.end(a)
a<-table.row.start(a)
a<-table.element(a, 'Sum Squared Residuals',1,TRUE)
a<-table.element(a, sum(myerror*myerror))
a<-table.row.end(a)
a<-table.end(a)
table.save(a,file='mytable3.tab')
a<-table.start()
a<-table.row.start(a)
a<-table.element(a, 'Multiple Linear Regression - Actuals, Interpolation, and Residuals', 4, TRUE)
a<-table.row.end(a)
a<-table.row.start(a)
a<-table.element(a, 'Time or Index', 1, TRUE)
a<-table.element(a, 'Actuals', 1, TRUE)
a<-table.element(a, 'Interpolation
Forecast', 1, TRUE)
a<-table.element(a, 'Residuals
Prediction Error', 1, TRUE)
a<-table.row.end(a)
for (i in 1:n) {
a<-table.row.start(a)
a<-table.element(a,i, 1, TRUE)
a<-table.element(a,x[i])
a<-table.element(a,x[i]-mysum$resid[i])
a<-table.element(a,mysum$resid[i])
a<-table.row.end(a)
}
a<-table.end(a)
table.save(a,file='mytable4.tab')
if (n > n25) {
a<-table.start()
a<-table.row.start(a)
a<-table.element(a,'Goldfeld-Quandt test for Heteroskedasticity',4,TRUE)
a<-table.row.end(a)
a<-table.row.start(a)
a<-table.element(a,'p-values',header=TRUE)
a<-table.element(a,'Alternative Hypothesis',3,header=TRUE)
a<-table.row.end(a)
a<-table.row.start(a)
a<-table.element(a,'breakpoint index',header=TRUE)
a<-table.element(a,'greater',header=TRUE)
a<-table.element(a,'2-sided',header=TRUE)
a<-table.element(a,'less',header=TRUE)
a<-table.row.end(a)
for (mypoint in kp3:nmkm3) {
a<-table.row.start(a)
a<-table.element(a,mypoint,header=TRUE)
a<-table.element(a,gqarr[mypoint-kp3+1,1])
a<-table.element(a,gqarr[mypoint-kp3+1,2])
a<-table.element(a,gqarr[mypoint-kp3+1,3])
a<-table.row.end(a)
}
a<-table.end(a)
table.save(a,file='mytable5.tab')
a<-table.start()
a<-table.row.start(a)
a<-table.element(a,'Meta Analysis of Goldfeld-Quandt test for Heteroskedasticity',4,TRUE)
a<-table.row.end(a)
a<-table.row.start(a)
a<-table.element(a,'Description',header=TRUE)
a<-table.element(a,'# significant tests',header=TRUE)
a<-table.element(a,'% significant tests',header=TRUE)
a<-table.element(a,'OK/NOK',header=TRUE)
a<-table.row.end(a)
a<-table.row.start(a)
a<-table.element(a,'1% type I error level',header=TRUE)
a<-table.element(a,numsignificant1)
a<-table.element(a,numsignificant1/numgqtests)
if (numsignificant1/numgqtests < 0.01) dum <- 'OK' else dum <- 'NOK'
a<-table.element(a,dum)
a<-table.row.end(a)
a<-table.row.start(a)
a<-table.element(a,'5% type I error level',header=TRUE)
a<-table.element(a,numsignificant5)
a<-table.element(a,numsignificant5/numgqtests)
if (numsignificant5/numgqtests < 0.05) dum <- 'OK' else dum <- 'NOK'
a<-table.element(a,dum)
a<-table.row.end(a)
a<-table.row.start(a)
a<-table.element(a,'10% type I error level',header=TRUE)
a<-table.element(a,numsignificant10)
a<-table.element(a,numsignificant10/numgqtests)
if (numsignificant10/numgqtests < 0.1) dum <- 'OK' else dum <- 'NOK'
a<-table.element(a,dum)
a<-table.row.end(a)
a<-table.end(a)
table.save(a,file='mytable6.tab')
}