| Multiple Linear Regression - Estimated Regression Equation |
| nwwmb[t] = + 19383.0482520845 + 5208.18468261152dummy_variable[t] + 0.925680076204517`y[t-1]`[t] + 0.170923414732768`y[t-2]`[t] + 0.155111372936063`y[t-3]`[t] -0.305318747860637`y[t-4] `[t] + 837.730352246995M1[t] -2931.44490665555M2[t] -8038.39352053068M3[t] -5571.84238247885M4[t] -8599.4415923363M5[t] -5578.99689219737M6[t] + 17664.8784464577M7[t] + 1152.70424096104M8[t] -6679.57569678684M9[t] -16111.3074526013M10[t] -9459.3839340622M11[t] -99.011851773791t + e[t] |
| Multiple Linear Regression - Ordinary Least Squares | |||||
| Variable | Parameter | S.D. | T-STAT H0: parameter = 0 | 2-tail p-value | 1-tail p-value |
| (Intercept) | 19383.0482520845 | 12923.97714 | 1.4998 | 0.141936 | 0.070968 |
| dummy_variable | 5208.18468261152 | 2029.574277 | 2.5661 | 0.01435 | 0.007175 |
| `y[t-1]` | 0.925680076204517 | 0.146303 | 6.3272 | 0 | 0 |
| `y[t-2]` | 0.170923414732768 | 0.208523 | 0.8197 | 0.417506 | 0.208753 |
| `y[t-3]` | 0.155111372936063 | 0.214173 | 0.7242 | 0.473358 | 0.236679 |
| `y[t-4] ` | -0.305318747860637 | 0.156157 | -1.9552 | 0.057942 | 0.028971 |
| M1 | 837.730352246995 | 2718.786025 | 0.3081 | 0.759669 | 0.379834 |
| M2 | -2931.44490665555 | 2997.827815 | -0.9779 | 0.33433 | 0.167165 |
| M3 | -8038.39352053068 | 2788.968873 | -2.8822 | 0.006463 | 0.003232 |
| M4 | -5571.84238247885 | 2547.179392 | -2.1875 | 0.034932 | 0.017466 |
| M5 | -8599.4415923363 | 2448.908336 | -3.5115 | 0.001166 | 0.000583 |
| M6 | -5578.99689219737 | 2466.297078 | -2.2621 | 0.029494 | 0.014747 |
| M7 | 17664.8784464577 | 2403.344745 | 7.3501 | 0 | 0 |
| M8 | 1152.70424096104 | 4660.838654 | 0.2473 | 0.805994 | 0.402997 |
| M9 | -6679.57569678684 | 5008.747669 | -1.3336 | 0.19028 | 0.09514 |
| M10 | -16111.3074526013 | 4385.432377 | -3.6738 | 0.000733 | 0.000367 |
| M11 | -9459.3839340622 | 2597.248662 | -3.6421 | 0.000804 | 0.000402 |
| t | -99.011851773791 | 54.96703 | -1.8013 | 0.079596 | 0.039798 |
| Multiple Linear Regression - Regression Statistics | |
| Multiple R | 0.987230121934677 |
| R-squared | 0.974623313655158 |
| Adjusted R-squared | 0.963270585553518 |
| F-TEST (value) | 85.8492606296439 |
| F-TEST (DF numerator) | 17 |
| F-TEST (DF denominator) | 38 |
| p-value | 0 |
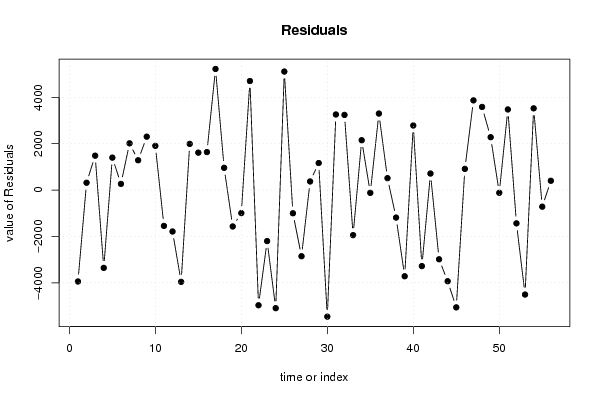
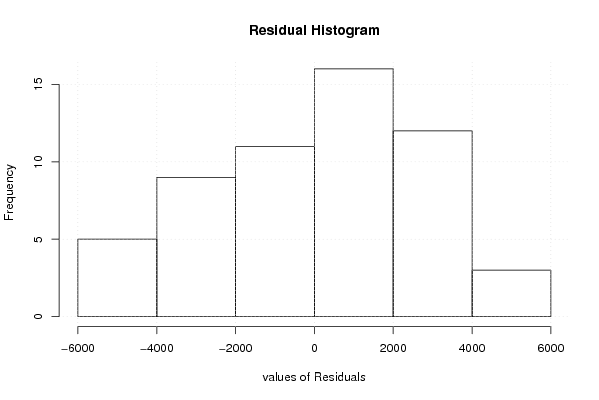
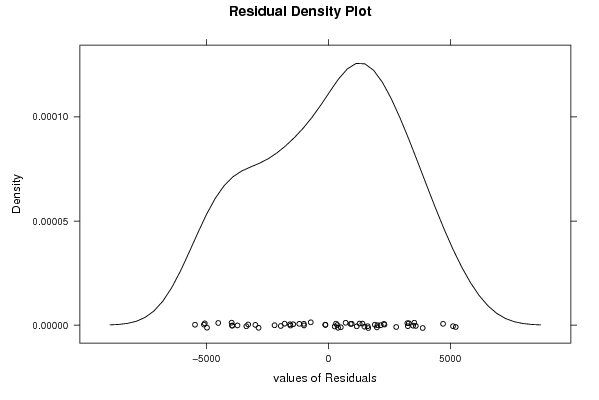
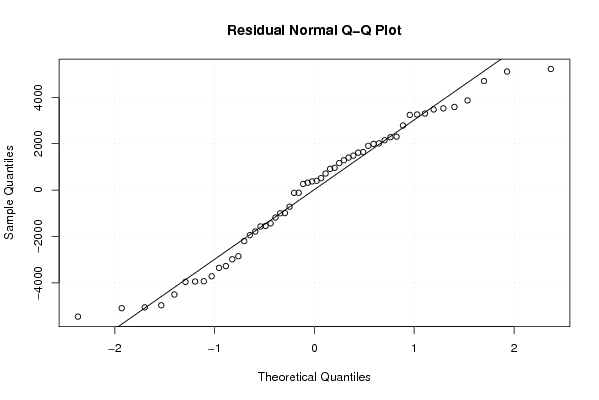
| Multiple Linear Regression - Residual Statistics | |
| Residual Standard Deviation | 3474.57074208821 |
| Sum Squared Residuals | 458760389.987466 |
| Multiple Linear Regression - Actuals, Interpolation, and Residuals | |||
| Time or Index | Actuals | Interpolation Forecast | Residuals Prediction Error |
| 1 | 277128 | 281072.501427316 | -3944.50142731563 |
| 2 | 277103 | 276786.900017334 | 316.099982666263 |
| 3 | 275037 | 273554.058231005 | 1482.94176899508 |
| 4 | 270150 | 273507.865321602 | -3357.86532160251 |
| 5 | 267140 | 265740.736022965 | 1399.26397703518 |
| 6 | 264993 | 264727.741986366 | 265.258013634064 |
| 7 | 287259 | 285243.450124832 | 2015.54987516802 |
| 8 | 291186 | 289901.691561157 | 1284.30843884250 |
| 9 | 292300 | 289997.311496698 | 2302.68850330244 |
| 10 | 288186 | 286278.220925108 | 1907.77907489212 |
| 11 | 281477 | 283024.188564035 | -1547.18856403507 |
| 12 | 282656 | 284444.801433459 | -1788.80143345883 |
| 13 | 280190 | 284149.918280959 | -3959.9182809593 |
| 14 | 280408 | 278415.961936003 | 1992.03806399682 |
| 15 | 276836 | 275221.562374324 | 1614.43762567553 |
| 16 | 275216 | 273577.358283424 | 1638.64171657631 |
| 17 | 274352 | 269127.33737244 | 5224.66262755993 |
| 18 | 271311 | 270351.469391936 | 959.53060806381 |
| 19 | 289802 | 291372.980079952 | -1570.98007995215 |
| 20 | 290726 | 291719.366352895 | -993.366352894611 |
| 21 | 292300 | 287596.049528663 | 4703.95047133746 |
| 22 | 278506 | 283476.898305438 | -4970.89830543822 |
| 23 | 269826 | 272027.686397730 | -2201.68639772965 |
| 24 | 265861 | 270957.468613717 | -5096.4686137172 |
| 25 | 269034 | 263922.072384746 | 5111.92761525363 |
| 26 | 264176 | 265178.556907356 | -1002.55690735615 |
| 27 | 255198 | 258053.132764192 | -2855.1327641916 |
| 28 | 253353 | 252982.327599127 | 370.672400872754 |
| 29 | 246057 | 244890.978942743 | 1166.02105725731 |
| 30 | 235372 | 240833.944825825 | -5461.94482582471 |
| 31 | 258556 | 255295.830699796 | 3260.16930020383 |
| 32 | 260993 | 257750.915355693 | 3242.08464430695 |
| 33 | 254663 | 256608.434923616 | -1945.43492361564 |
| 34 | 250643 | 248493.109686397 | 2149.89031360285 |
| 35 | 243422 | 243542.338797006 | -120.338797006029 |
| 36 | 247105 | 243805.346142574 | 3299.65385742575 |
| 37 | 248541 | 248028.226340678 | 512.773659321764 |
| 38 | 245039 | 246226.148898321 | -1187.14889832082 |
| 39 | 237080 | 240799.884694185 | -3719.88469418512 |
| 40 | 237085 | 234299.613438723 | 2785.38656127730 |
| 41 | 225554 | 228835.613569664 | -3281.61356966443 |
| 42 | 226839 | 226126.763596810 | 712.236403189713 |
| 43 | 247934 | 250921.015557418 | -2987.01555741829 |
| 44 | 248333 | 252266.571460549 | -3933.57146054875 |
| 45 | 246969 | 252030.204051024 | -5061.20405102425 |
| 46 | 245098 | 244184.771083057 | 913.228916943247 |
| 47 | 246263 | 242393.786241229 | 3869.21375877075 |
| 48 | 255765 | 252179.383810250 | 3585.61618975027 |
| 49 | 264319 | 262039.281566300 | 2279.71843369953 |
| 50 | 268347 | 268465.432240986 | -118.432240986103 |
| 51 | 273046 | 269568.361936294 | 3477.63806370610 |
| 52 | 273963 | 275399.835357124 | -1436.83535712385 |
| 53 | 267430 | 271938.334092188 | -4508.33409218799 |
| 54 | 271993 | 268468.080199063 | 3524.91980093712 |
| 55 | 292710 | 293427.723538001 | -717.723538001405 |
| 56 | 295881 | 295480.455269706 | 400.544730293901 |
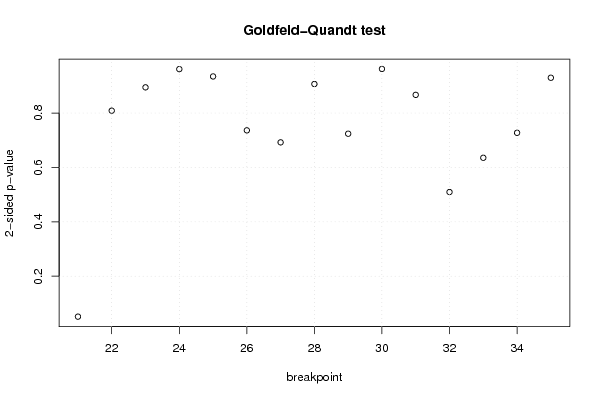
| Goldfeld-Quandt test for Heteroskedasticity | |||
| p-values | Alternative Hypothesis | ||
| breakpoint index | greater | 2-sided | less |
| 21 | 0.0256304187190940 | 0.0512608374381879 | 0.974369581280906 |
| 22 | 0.595590481970641 | 0.808819036058718 | 0.404409518029359 |
| 23 | 0.44733857301763 | 0.89467714603526 | 0.55266142698237 |
| 24 | 0.480834115666041 | 0.961668231332082 | 0.519165884333959 |
| 25 | 0.467373972254989 | 0.934747944509978 | 0.532626027745011 |
| 26 | 0.368250505000644 | 0.736501010001288 | 0.631749494999356 |
| 27 | 0.346188173485305 | 0.692376346970609 | 0.653811826514695 |
| 28 | 0.453457046416626 | 0.906914092833252 | 0.546542953583374 |
| 29 | 0.362020975913306 | 0.724041951826612 | 0.637979024086694 |
| 30 | 0.481170748870694 | 0.962341497741389 | 0.518829251129306 |
| 31 | 0.566458876750354 | 0.867082246499291 | 0.433541123249646 |
| 32 | 0.745218594986899 | 0.509562810026202 | 0.254781405013101 |
| 33 | 0.68220302071082 | 0.63559395857836 | 0.31779697928918 |
| 34 | 0.636277327443966 | 0.727445345112068 | 0.363722672556034 |
| 35 | 0.464982110526308 | 0.929964221052616 | 0.535017889473692 |
| Meta Analysis of Goldfeld-Quandt test for Heteroskedasticity | |||
| Description | # significant tests | % significant tests | OK/NOK |
| 1% type I error level | 0 | 0 | OK |
| 5% type I error level | 0 | 0 | OK |
| 10% type I error level | 1 | 0.0666666666666667 | OK |