Free Statistics

of Irreproducible Research!

Author's title

Author*The author of this computation has been verified*
R Software Modulerwasp_multipleregression.wasp
Title produced by softwareMultiple Regression
Date of computationSun, 22 Nov 2009 09:56:15 -0700
Cite this page as followsStatistical Computations at FreeStatistics.org, Office for Research Development and Education, URL https://freestatistics.org/blog/index.php?v=date/2009/Nov/22/t1258909036yp5al6jbxsy57j9.htm/, Retrieved Sun, 28 Apr 2024 10:55:17 +0000
Statistical Computations at FreeStatistics.org, Office for Research Development and Education, URL https://freestatistics.org/blog/index.php?pk=58662, Retrieved Sun, 28 Apr 2024 10:55:17 +0000
QR Codes:

Original text written by user:
IsPrivate?No (this computation is public)
User-defined keywords
Estimated Impact223
Family? (F = Feedback message, R = changed R code, M = changed R Module, P = changed Parameters, D = changed Data)
-       [Multiple Regression] [] [2009-11-22 16:56:15] [21503129a47c64de7f80e1fde84c3a45] [Current]
- R PD    [Multiple Regression] [] [2009-12-12 16:54:21] [1eac2882020791f6c49a90a91c34285a]
-   PD      [Multiple Regression] [] [2009-12-13 15:36:08] [1eac2882020791f6c49a90a91c34285a]
- R PD    [Multiple Regression] [] [2009-12-12 17:09:31] [1eac2882020791f6c49a90a91c34285a]
Feedback Forum

Post a new message
Dataseries X:
99.9	98.8
98.6	100.5
107.2	110.4
95.7	96.4
93.7	101.9
106.7	106.2
86.7	81
95.3	94.7
99.3	101
101.8	109.4
96	102.3
91.7	90.7
95.3	96.2
96.6	96.1
107.2	106
108	103.1
98.4	102
103.1	104.7
81.1	86
96.6	92.1
103.7	106.9
106.6	112.6
97.6	101.7
87.6	92
99.4	97.4
98.5	97
105.2	105.4
104.6	102.7
97.5	98.1
108.9	104.5
86.8	87.4
88.9	89.9
110.3	109.8
114.8	111.7
94.6	98.6
92	96.9
93.8	95.1
93.8	97
107.6	112.7
101	102.9
95.4	97.4
96.5	111.4
89.2	87.4
87.1	96.8
110.5	114.1
110.8	110.3
104.2	103.9
88.9	101.6
89.8	94.6
90	95.9
93.9	104.7
91.3	102.8
87.8	98.1
99.7	113.9
73.5	80.9
79.2	95.7
96.9	113.2
95.2	105.9
95.6	108.8
89.7	102.3


Summary of computational transaction
Raw Inputview raw input (R code)
Raw Outputview raw output of R engine
Computing time5 seconds
R Server'Gwilym Jenkins' @ 72.249.127.135

\begin{tabular}{lllllllll}
\hline
Summary of computational transaction \tabularnewline
Raw Input & view raw input (R code)  \tabularnewline
Raw Output & view raw output of R engine  \tabularnewline
Computing time & 5 seconds \tabularnewline
R Server & 'Gwilym Jenkins' @ 72.249.127.135 \tabularnewline
\hline
\end{tabular}
%Source: https://freestatistics.org/blog/index.php?pk=58662&T=0

[TABLE]
[ROW][C]Summary of computational transaction[/C][/ROW]
[ROW][C]Raw Input[/C][C]view raw input (R code) [/C][/ROW]
[ROW][C]Raw Output[/C][C]view raw output of R engine [/C][/ROW]
[ROW][C]Computing time[/C][C]5 seconds[/C][/ROW]
[ROW][C]R Server[/C][C]'Gwilym Jenkins' @ 72.249.127.135[/C][/ROW]
[/TABLE]
Source: https://freestatistics.org/blog/index.php?pk=58662&T=0

Globally Unique Identifier (entire table): ba.freestatistics.org/blog/index.php?pk=58662&T=0

As an alternative you can also use a QR Code:  

The GUIDs for individual cells are displayed in the table below:

Summary of computational transaction
Raw Inputview raw input (R code)
Raw Outputview raw output of R engine
Computing time5 seconds
R Server'Gwilym Jenkins' @ 72.249.127.135


Multiple Linear Regression - Estimated Regression Equation
TotProd[t] = + 57.9679669988610 + 0.331044808698439ProdMetal[t] + 5.75269254643562M1[t] + 5.32137311478093M2[t] + 10.5521608310994M3[t] + 8.52450133355162M4[t] + 3.65307453564437M5[t] + 9.21284738848986M6[t] -2.49449512622698M7[t] + 0.386788152877537M8[t] + 10.0881488530092M9[t] + 11.4637249404847M10[t] + 5.51455501667793M11[t] + e[t]

\begin{tabular}{lllllllll}
\hline
Multiple Linear Regression - Estimated Regression Equation \tabularnewline
TotProd[t] =  +  57.9679669988610 +  0.331044808698439ProdMetal[t] +  5.75269254643562M1[t] +  5.32137311478093M2[t] +  10.5521608310994M3[t] +  8.52450133355162M4[t] +  3.65307453564437M5[t] +  9.21284738848986M6[t] -2.49449512622698M7[t] +  0.386788152877537M8[t] +  10.0881488530092M9[t] +  11.4637249404847M10[t] +  5.51455501667793M11[t]  + e[t] \tabularnewline
\hline
\end{tabular}
%Source: https://freestatistics.org/blog/index.php?pk=58662&T=1

[TABLE]
[ROW][C]Multiple Linear Regression - Estimated Regression Equation[/C][/ROW]
[ROW][C]TotProd[t] =  +  57.9679669988610 +  0.331044808698439ProdMetal[t] +  5.75269254643562M1[t] +  5.32137311478093M2[t] +  10.5521608310994M3[t] +  8.52450133355162M4[t] +  3.65307453564437M5[t] +  9.21284738848986M6[t] -2.49449512622698M7[t] +  0.386788152877537M8[t] +  10.0881488530092M9[t] +  11.4637249404847M10[t] +  5.51455501667793M11[t]  + e[t][/C][/ROW]
[/TABLE]
Source: https://freestatistics.org/blog/index.php?pk=58662&T=1

Globally Unique Identifier (entire table): ba.freestatistics.org/blog/index.php?pk=58662&T=1

As an alternative you can also use a QR Code:  

The GUIDs for individual cells are displayed in the table below:

Multiple Linear Regression - Estimated Regression Equation
TotProd[t] = + 57.9679669988610 + 0.331044808698439ProdMetal[t] + 5.75269254643562M1[t] + 5.32137311478093M2[t] + 10.5521608310994M3[t] + 8.52450133355162M4[t] + 3.65307453564437M5[t] + 9.21284738848986M6[t] -2.49449512622698M7[t] + 0.386788152877537M8[t] + 10.0881488530092M9[t] + 11.4637249404847M10[t] + 5.51455501667793M11[t] + e[t]


Multiple Linear Regression - Ordinary Least Squares
VariableParameterS.D.T-STATH0: parameter = 02-tail p-value1-tail p-value
(Intercept)57.967966998861021.6608422.67620.0102190.00511
ProdMetal0.3310448086984390.2226091.48710.1436630.071831
M15.752692546435623.4099131.6870.0982210.049111
M25.321373114780933.4119591.55960.1255580.062779
M310.55216083109944.2158442.5030.0158490.007925
M48.524501333551623.5782312.38230.0213020.010651
M53.653074535644373.4658521.0540.2972630.148631
M69.212847388489864.2554692.16490.0355030.017751
M7-2.494495126226984.353281-0.5730.5693660.284683
M80.3867881528775373.4682790.11150.9116780.455839
M910.08814885300924.3727282.30710.0255050.012753
M1011.46372494048474.5125392.54040.0144350.007218
M115.514555016677933.6916241.49380.1419110.070956

\begin{tabular}{lllllllll}
\hline
Multiple Linear Regression - Ordinary Least Squares \tabularnewline
Variable & Parameter & S.D. & T-STATH0: parameter = 0 & 2-tail p-value & 1-tail p-value \tabularnewline
(Intercept) & 57.9679669988610 & 21.660842 & 2.6762 & 0.010219 & 0.00511 \tabularnewline
ProdMetal & 0.331044808698439 & 0.222609 & 1.4871 & 0.143663 & 0.071831 \tabularnewline
M1 & 5.75269254643562 & 3.409913 & 1.687 & 0.098221 & 0.049111 \tabularnewline
M2 & 5.32137311478093 & 3.411959 & 1.5596 & 0.125558 & 0.062779 \tabularnewline
M3 & 10.5521608310994 & 4.215844 & 2.503 & 0.015849 & 0.007925 \tabularnewline
M4 & 8.52450133355162 & 3.578231 & 2.3823 & 0.021302 & 0.010651 \tabularnewline
M5 & 3.65307453564437 & 3.465852 & 1.054 & 0.297263 & 0.148631 \tabularnewline
M6 & 9.21284738848986 & 4.255469 & 2.1649 & 0.035503 & 0.017751 \tabularnewline
M7 & -2.49449512622698 & 4.353281 & -0.573 & 0.569366 & 0.284683 \tabularnewline
M8 & 0.386788152877537 & 3.468279 & 0.1115 & 0.911678 & 0.455839 \tabularnewline
M9 & 10.0881488530092 & 4.372728 & 2.3071 & 0.025505 & 0.012753 \tabularnewline
M10 & 11.4637249404847 & 4.512539 & 2.5404 & 0.014435 & 0.007218 \tabularnewline
M11 & 5.51455501667793 & 3.691624 & 1.4938 & 0.141911 & 0.070956 \tabularnewline
\hline
\end{tabular}
%Source: https://freestatistics.org/blog/index.php?pk=58662&T=2

[TABLE]
[ROW][C]Multiple Linear Regression - Ordinary Least Squares[/C][/ROW]
[ROW][C]Variable[/C][C]Parameter[/C][C]S.D.[/C][C]T-STATH0: parameter = 0[/C][C]2-tail p-value[/C][C]1-tail p-value[/C][/ROW]
[ROW][C](Intercept)[/C][C]57.9679669988610[/C][C]21.660842[/C][C]2.6762[/C][C]0.010219[/C][C]0.00511[/C][/ROW]
[ROW][C]ProdMetal[/C][C]0.331044808698439[/C][C]0.222609[/C][C]1.4871[/C][C]0.143663[/C][C]0.071831[/C][/ROW]
[ROW][C]M1[/C][C]5.75269254643562[/C][C]3.409913[/C][C]1.687[/C][C]0.098221[/C][C]0.049111[/C][/ROW]
[ROW][C]M2[/C][C]5.32137311478093[/C][C]3.411959[/C][C]1.5596[/C][C]0.125558[/C][C]0.062779[/C][/ROW]
[ROW][C]M3[/C][C]10.5521608310994[/C][C]4.215844[/C][C]2.503[/C][C]0.015849[/C][C]0.007925[/C][/ROW]
[ROW][C]M4[/C][C]8.52450133355162[/C][C]3.578231[/C][C]2.3823[/C][C]0.021302[/C][C]0.010651[/C][/ROW]
[ROW][C]M5[/C][C]3.65307453564437[/C][C]3.465852[/C][C]1.054[/C][C]0.297263[/C][C]0.148631[/C][/ROW]
[ROW][C]M6[/C][C]9.21284738848986[/C][C]4.255469[/C][C]2.1649[/C][C]0.035503[/C][C]0.017751[/C][/ROW]
[ROW][C]M7[/C][C]-2.49449512622698[/C][C]4.353281[/C][C]-0.573[/C][C]0.569366[/C][C]0.284683[/C][/ROW]
[ROW][C]M8[/C][C]0.386788152877537[/C][C]3.468279[/C][C]0.1115[/C][C]0.911678[/C][C]0.455839[/C][/ROW]
[ROW][C]M9[/C][C]10.0881488530092[/C][C]4.372728[/C][C]2.3071[/C][C]0.025505[/C][C]0.012753[/C][/ROW]
[ROW][C]M10[/C][C]11.4637249404847[/C][C]4.512539[/C][C]2.5404[/C][C]0.014435[/C][C]0.007218[/C][/ROW]
[ROW][C]M11[/C][C]5.51455501667793[/C][C]3.691624[/C][C]1.4938[/C][C]0.141911[/C][C]0.070956[/C][/ROW]
[/TABLE]
Source: https://freestatistics.org/blog/index.php?pk=58662&T=2

Globally Unique Identifier (entire table): ba.freestatistics.org/blog/index.php?pk=58662&T=2

As an alternative you can also use a QR Code:  

The GUIDs for individual cells are displayed in the table below:

Multiple Linear Regression - Ordinary Least Squares
VariableParameterS.D.T-STATH0: parameter = 02-tail p-value1-tail p-value
(Intercept)57.967966998861021.6608422.67620.0102190.00511
ProdMetal0.3310448086984390.2226091.48710.1436630.071831
M15.752692546435623.4099131.6870.0982210.049111
M25.321373114780933.4119591.55960.1255580.062779
M310.55216083109944.2158442.5030.0158490.007925
M48.524501333551623.5782312.38230.0213020.010651
M53.653074535644373.4658521.0540.2972630.148631
M69.212847388489864.2554692.16490.0355030.017751
M7-2.494495126226984.353281-0.5730.5693660.284683
M80.3867881528775373.4682790.11150.9116780.455839
M910.08814885300924.3727282.30710.0255050.012753
M1011.46372494048474.5125392.54040.0144350.007218
M115.514555016677933.6916241.49380.1419110.070956


Multiple Linear Regression - Regression Statistics
Multiple R0.814925846393735
R-squared0.664104135120545
Adjusted R-squared0.578343488768344
F-TEST (value)7.74369321323916
F-TEST (DF numerator)12
F-TEST (DF denominator)47
p-value1.14025975106458e-07
Multiple Linear Regression - Residual Statistics
Residual Standard Deviation5.39064515829913
Sum Squared Residuals1365.77559546661

\begin{tabular}{lllllllll}
\hline
Multiple Linear Regression - Regression Statistics \tabularnewline
Multiple R & 0.814925846393735 \tabularnewline
R-squared & 0.664104135120545 \tabularnewline
Adjusted R-squared & 0.578343488768344 \tabularnewline
F-TEST (value) & 7.74369321323916 \tabularnewline
F-TEST (DF numerator) & 12 \tabularnewline
F-TEST (DF denominator) & 47 \tabularnewline
p-value & 1.14025975106458e-07 \tabularnewline
Multiple Linear Regression - Residual Statistics \tabularnewline
Residual Standard Deviation & 5.39064515829913 \tabularnewline
Sum Squared Residuals & 1365.77559546661 \tabularnewline
\hline
\end{tabular}
%Source: https://freestatistics.org/blog/index.php?pk=58662&T=3

[TABLE]
[ROW][C]Multiple Linear Regression - Regression Statistics[/C][/ROW]
[ROW][C]Multiple R[/C][C]0.814925846393735[/C][/ROW]
[ROW][C]R-squared[/C][C]0.664104135120545[/C][/ROW]
[ROW][C]Adjusted R-squared[/C][C]0.578343488768344[/C][/ROW]
[ROW][C]F-TEST (value)[/C][C]7.74369321323916[/C][/ROW]
[ROW][C]F-TEST (DF numerator)[/C][C]12[/C][/ROW]
[ROW][C]F-TEST (DF denominator)[/C][C]47[/C][/ROW]
[ROW][C]p-value[/C][C]1.14025975106458e-07[/C][/ROW]
[ROW][C]Multiple Linear Regression - Residual Statistics[/C][/ROW]
[ROW][C]Residual Standard Deviation[/C][C]5.39064515829913[/C][/ROW]
[ROW][C]Sum Squared Residuals[/C][C]1365.77559546661[/C][/ROW]
[/TABLE]
Source: https://freestatistics.org/blog/index.php?pk=58662&T=3

Globally Unique Identifier (entire table): ba.freestatistics.org/blog/index.php?pk=58662&T=3

As an alternative you can also use a QR Code:  

The GUIDs for individual cells are displayed in the table below:

Multiple Linear Regression - Regression Statistics
Multiple R0.814925846393735
R-squared0.664104135120545
Adjusted R-squared0.578343488768344
F-TEST (value)7.74369321323916
F-TEST (DF numerator)12
F-TEST (DF denominator)47
p-value1.14025975106458e-07
Multiple Linear Regression - Residual Statistics
Residual Standard Deviation5.39064515829913
Sum Squared Residuals1365.77559546661


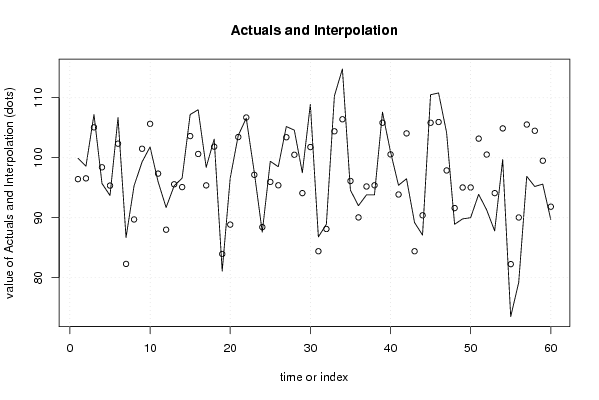
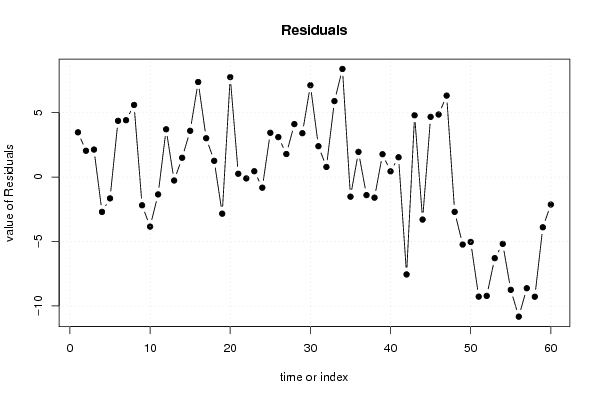
Multiple Linear Regression - Actuals, Interpolation, and Residuals
Time or IndexActualsInterpolationForecastResidualsPrediction Error
199.996.4278866447023.47211335529794
298.696.5593433878352.040656612165
3107.2105.0674747102682.13252528973200
495.798.405187890942-2.70518789094208
593.795.3545075408763-1.65450754087626
6106.7102.3377730711254.36222692887497
786.782.28810137720754.41189862279248
895.389.70469853548075.59530146451934
999.3101.491641530412-2.19164153041248
10101.8105.647994010955-3.84799401095491
119697.3484059453892-1.34840594538917
1291.787.99373114780943.70626885219064
1395.395.5671701420864-0.267170142086404
1496.695.10274622956191.49725377043812
15107.2103.6108775519953.58912244800513
16108100.6231881092227.37681189077837
1798.495.3876120217463.01238797825391
18103.1101.8412058580771.25879414192263
1981.183.9433254206997-2.84332542069973
2096.688.84398203286477.75601796713528
21103.7103.4448059017330.255194098266718
22106.6106.70733739879-0.107337398789911
2397.697.14977906017010.450220939829870
2487.688.4240893991173-0.824089399117342
2599.495.96442391252453.43557608747548
2698.595.40068655739053.09931344260953
27105.2103.4122506667761.78774933322419
28104.6100.4907701857424.10922981425774
2997.594.09653726782223.40346273217782
30108.9101.7749968963387.12500310366232
3186.884.40678815287752.39321184712246
3288.988.11568345372820.784316546271857
33110.3104.4048358469595.89516415304124
34114.8106.4093970709618.39060292903869
3594.696.123540153205-1.52354015320497
369290.04620896173971.95379103826031
3793.895.203020852518-1.40302085251812
3893.895.4006865573905-1.60068655739047
39107.6105.8288777702741.77112222972558
40101100.5569791474820.443020852518057
4195.493.86480590173331.53519409826673
4296.5104.059206076357-7.55920607635692
4389.284.40678815287754.79321184712246
4487.190.3998926337474-3.29989263374738
45110.5105.8283285243624.67167147563796
46110.8105.9459343387844.8540656612165
47104.297.87807763930676.32192236069331
4888.991.6021195626223-2.70211956262234
4989.895.0374984481689-5.2374984481689
509095.0365372678222-5.03653726782219
5193.9103.180519300687-9.2805193006869
5291.3100.523874666612-9.2238746666121
5387.894.0965372678222-6.29653726782219
5499.7104.886818098103-5.18681809810301
5573.582.2549968963377-8.75499689633769
5679.290.035743344179-10.8357433441791
5796.9105.530388196533-8.63038819653344
5895.2104.489337180510-9.28933718051036
5995.699.500197201929-3.90019720192905
6089.791.8338509287113-2.13385092871126

\begin{tabular}{lllllllll}
\hline
Multiple Linear Regression - Actuals, Interpolation, and Residuals \tabularnewline
Time or Index & Actuals & InterpolationForecast & ResidualsPrediction Error \tabularnewline
1 & 99.9 & 96.427886644702 & 3.47211335529794 \tabularnewline
2 & 98.6 & 96.559343387835 & 2.040656612165 \tabularnewline
3 & 107.2 & 105.067474710268 & 2.13252528973200 \tabularnewline
4 & 95.7 & 98.405187890942 & -2.70518789094208 \tabularnewline
5 & 93.7 & 95.3545075408763 & -1.65450754087626 \tabularnewline
6 & 106.7 & 102.337773071125 & 4.36222692887497 \tabularnewline
7 & 86.7 & 82.2881013772075 & 4.41189862279248 \tabularnewline
8 & 95.3 & 89.7046985354807 & 5.59530146451934 \tabularnewline
9 & 99.3 & 101.491641530412 & -2.19164153041248 \tabularnewline
10 & 101.8 & 105.647994010955 & -3.84799401095491 \tabularnewline
11 & 96 & 97.3484059453892 & -1.34840594538917 \tabularnewline
12 & 91.7 & 87.9937311478094 & 3.70626885219064 \tabularnewline
13 & 95.3 & 95.5671701420864 & -0.267170142086404 \tabularnewline
14 & 96.6 & 95.1027462295619 & 1.49725377043812 \tabularnewline
15 & 107.2 & 103.610877551995 & 3.58912244800513 \tabularnewline
16 & 108 & 100.623188109222 & 7.37681189077837 \tabularnewline
17 & 98.4 & 95.387612021746 & 3.01238797825391 \tabularnewline
18 & 103.1 & 101.841205858077 & 1.25879414192263 \tabularnewline
19 & 81.1 & 83.9433254206997 & -2.84332542069973 \tabularnewline
20 & 96.6 & 88.8439820328647 & 7.75601796713528 \tabularnewline
21 & 103.7 & 103.444805901733 & 0.255194098266718 \tabularnewline
22 & 106.6 & 106.70733739879 & -0.107337398789911 \tabularnewline
23 & 97.6 & 97.1497790601701 & 0.450220939829870 \tabularnewline
24 & 87.6 & 88.4240893991173 & -0.824089399117342 \tabularnewline
25 & 99.4 & 95.9644239125245 & 3.43557608747548 \tabularnewline
26 & 98.5 & 95.4006865573905 & 3.09931344260953 \tabularnewline
27 & 105.2 & 103.412250666776 & 1.78774933322419 \tabularnewline
28 & 104.6 & 100.490770185742 & 4.10922981425774 \tabularnewline
29 & 97.5 & 94.0965372678222 & 3.40346273217782 \tabularnewline
30 & 108.9 & 101.774996896338 & 7.12500310366232 \tabularnewline
31 & 86.8 & 84.4067881528775 & 2.39321184712246 \tabularnewline
32 & 88.9 & 88.1156834537282 & 0.784316546271857 \tabularnewline
33 & 110.3 & 104.404835846959 & 5.89516415304124 \tabularnewline
34 & 114.8 & 106.409397070961 & 8.39060292903869 \tabularnewline
35 & 94.6 & 96.123540153205 & -1.52354015320497 \tabularnewline
36 & 92 & 90.0462089617397 & 1.95379103826031 \tabularnewline
37 & 93.8 & 95.203020852518 & -1.40302085251812 \tabularnewline
38 & 93.8 & 95.4006865573905 & -1.60068655739047 \tabularnewline
39 & 107.6 & 105.828877770274 & 1.77112222972558 \tabularnewline
40 & 101 & 100.556979147482 & 0.443020852518057 \tabularnewline
41 & 95.4 & 93.8648059017333 & 1.53519409826673 \tabularnewline
42 & 96.5 & 104.059206076357 & -7.55920607635692 \tabularnewline
43 & 89.2 & 84.4067881528775 & 4.79321184712246 \tabularnewline
44 & 87.1 & 90.3998926337474 & -3.29989263374738 \tabularnewline
45 & 110.5 & 105.828328524362 & 4.67167147563796 \tabularnewline
46 & 110.8 & 105.945934338784 & 4.8540656612165 \tabularnewline
47 & 104.2 & 97.8780776393067 & 6.32192236069331 \tabularnewline
48 & 88.9 & 91.6021195626223 & -2.70211956262234 \tabularnewline
49 & 89.8 & 95.0374984481689 & -5.2374984481689 \tabularnewline
50 & 90 & 95.0365372678222 & -5.03653726782219 \tabularnewline
51 & 93.9 & 103.180519300687 & -9.2805193006869 \tabularnewline
52 & 91.3 & 100.523874666612 & -9.2238746666121 \tabularnewline
53 & 87.8 & 94.0965372678222 & -6.29653726782219 \tabularnewline
54 & 99.7 & 104.886818098103 & -5.18681809810301 \tabularnewline
55 & 73.5 & 82.2549968963377 & -8.75499689633769 \tabularnewline
56 & 79.2 & 90.035743344179 & -10.8357433441791 \tabularnewline
57 & 96.9 & 105.530388196533 & -8.63038819653344 \tabularnewline
58 & 95.2 & 104.489337180510 & -9.28933718051036 \tabularnewline
59 & 95.6 & 99.500197201929 & -3.90019720192905 \tabularnewline
60 & 89.7 & 91.8338509287113 & -2.13385092871126 \tabularnewline
\hline
\end{tabular}
%Source: https://freestatistics.org/blog/index.php?pk=58662&T=4

[TABLE]
[ROW][C]Multiple Linear Regression - Actuals, Interpolation, and Residuals[/C][/ROW]
[ROW][C]Time or Index[/C][C]Actuals[/C][C]InterpolationForecast[/C][C]ResidualsPrediction Error[/C][/ROW]
[ROW][C]1[/C][C]99.9[/C][C]96.427886644702[/C][C]3.47211335529794[/C][/ROW]
[ROW][C]2[/C][C]98.6[/C][C]96.559343387835[/C][C]2.040656612165[/C][/ROW]
[ROW][C]3[/C][C]107.2[/C][C]105.067474710268[/C][C]2.13252528973200[/C][/ROW]
[ROW][C]4[/C][C]95.7[/C][C]98.405187890942[/C][C]-2.70518789094208[/C][/ROW]
[ROW][C]5[/C][C]93.7[/C][C]95.3545075408763[/C][C]-1.65450754087626[/C][/ROW]
[ROW][C]6[/C][C]106.7[/C][C]102.337773071125[/C][C]4.36222692887497[/C][/ROW]
[ROW][C]7[/C][C]86.7[/C][C]82.2881013772075[/C][C]4.41189862279248[/C][/ROW]
[ROW][C]8[/C][C]95.3[/C][C]89.7046985354807[/C][C]5.59530146451934[/C][/ROW]
[ROW][C]9[/C][C]99.3[/C][C]101.491641530412[/C][C]-2.19164153041248[/C][/ROW]
[ROW][C]10[/C][C]101.8[/C][C]105.647994010955[/C][C]-3.84799401095491[/C][/ROW]
[ROW][C]11[/C][C]96[/C][C]97.3484059453892[/C][C]-1.34840594538917[/C][/ROW]
[ROW][C]12[/C][C]91.7[/C][C]87.9937311478094[/C][C]3.70626885219064[/C][/ROW]
[ROW][C]13[/C][C]95.3[/C][C]95.5671701420864[/C][C]-0.267170142086404[/C][/ROW]
[ROW][C]14[/C][C]96.6[/C][C]95.1027462295619[/C][C]1.49725377043812[/C][/ROW]
[ROW][C]15[/C][C]107.2[/C][C]103.610877551995[/C][C]3.58912244800513[/C][/ROW]
[ROW][C]16[/C][C]108[/C][C]100.623188109222[/C][C]7.37681189077837[/C][/ROW]
[ROW][C]17[/C][C]98.4[/C][C]95.387612021746[/C][C]3.01238797825391[/C][/ROW]
[ROW][C]18[/C][C]103.1[/C][C]101.841205858077[/C][C]1.25879414192263[/C][/ROW]
[ROW][C]19[/C][C]81.1[/C][C]83.9433254206997[/C][C]-2.84332542069973[/C][/ROW]
[ROW][C]20[/C][C]96.6[/C][C]88.8439820328647[/C][C]7.75601796713528[/C][/ROW]
[ROW][C]21[/C][C]103.7[/C][C]103.444805901733[/C][C]0.255194098266718[/C][/ROW]
[ROW][C]22[/C][C]106.6[/C][C]106.70733739879[/C][C]-0.107337398789911[/C][/ROW]
[ROW][C]23[/C][C]97.6[/C][C]97.1497790601701[/C][C]0.450220939829870[/C][/ROW]
[ROW][C]24[/C][C]87.6[/C][C]88.4240893991173[/C][C]-0.824089399117342[/C][/ROW]
[ROW][C]25[/C][C]99.4[/C][C]95.9644239125245[/C][C]3.43557608747548[/C][/ROW]
[ROW][C]26[/C][C]98.5[/C][C]95.4006865573905[/C][C]3.09931344260953[/C][/ROW]
[ROW][C]27[/C][C]105.2[/C][C]103.412250666776[/C][C]1.78774933322419[/C][/ROW]
[ROW][C]28[/C][C]104.6[/C][C]100.490770185742[/C][C]4.10922981425774[/C][/ROW]
[ROW][C]29[/C][C]97.5[/C][C]94.0965372678222[/C][C]3.40346273217782[/C][/ROW]
[ROW][C]30[/C][C]108.9[/C][C]101.774996896338[/C][C]7.12500310366232[/C][/ROW]
[ROW][C]31[/C][C]86.8[/C][C]84.4067881528775[/C][C]2.39321184712246[/C][/ROW]
[ROW][C]32[/C][C]88.9[/C][C]88.1156834537282[/C][C]0.784316546271857[/C][/ROW]
[ROW][C]33[/C][C]110.3[/C][C]104.404835846959[/C][C]5.89516415304124[/C][/ROW]
[ROW][C]34[/C][C]114.8[/C][C]106.409397070961[/C][C]8.39060292903869[/C][/ROW]
[ROW][C]35[/C][C]94.6[/C][C]96.123540153205[/C][C]-1.52354015320497[/C][/ROW]
[ROW][C]36[/C][C]92[/C][C]90.0462089617397[/C][C]1.95379103826031[/C][/ROW]
[ROW][C]37[/C][C]93.8[/C][C]95.203020852518[/C][C]-1.40302085251812[/C][/ROW]
[ROW][C]38[/C][C]93.8[/C][C]95.4006865573905[/C][C]-1.60068655739047[/C][/ROW]
[ROW][C]39[/C][C]107.6[/C][C]105.828877770274[/C][C]1.77112222972558[/C][/ROW]
[ROW][C]40[/C][C]101[/C][C]100.556979147482[/C][C]0.443020852518057[/C][/ROW]
[ROW][C]41[/C][C]95.4[/C][C]93.8648059017333[/C][C]1.53519409826673[/C][/ROW]
[ROW][C]42[/C][C]96.5[/C][C]104.059206076357[/C][C]-7.55920607635692[/C][/ROW]
[ROW][C]43[/C][C]89.2[/C][C]84.4067881528775[/C][C]4.79321184712246[/C][/ROW]
[ROW][C]44[/C][C]87.1[/C][C]90.3998926337474[/C][C]-3.29989263374738[/C][/ROW]
[ROW][C]45[/C][C]110.5[/C][C]105.828328524362[/C][C]4.67167147563796[/C][/ROW]
[ROW][C]46[/C][C]110.8[/C][C]105.945934338784[/C][C]4.8540656612165[/C][/ROW]
[ROW][C]47[/C][C]104.2[/C][C]97.8780776393067[/C][C]6.32192236069331[/C][/ROW]
[ROW][C]48[/C][C]88.9[/C][C]91.6021195626223[/C][C]-2.70211956262234[/C][/ROW]
[ROW][C]49[/C][C]89.8[/C][C]95.0374984481689[/C][C]-5.2374984481689[/C][/ROW]
[ROW][C]50[/C][C]90[/C][C]95.0365372678222[/C][C]-5.03653726782219[/C][/ROW]
[ROW][C]51[/C][C]93.9[/C][C]103.180519300687[/C][C]-9.2805193006869[/C][/ROW]
[ROW][C]52[/C][C]91.3[/C][C]100.523874666612[/C][C]-9.2238746666121[/C][/ROW]
[ROW][C]53[/C][C]87.8[/C][C]94.0965372678222[/C][C]-6.29653726782219[/C][/ROW]
[ROW][C]54[/C][C]99.7[/C][C]104.886818098103[/C][C]-5.18681809810301[/C][/ROW]
[ROW][C]55[/C][C]73.5[/C][C]82.2549968963377[/C][C]-8.75499689633769[/C][/ROW]
[ROW][C]56[/C][C]79.2[/C][C]90.035743344179[/C][C]-10.8357433441791[/C][/ROW]
[ROW][C]57[/C][C]96.9[/C][C]105.530388196533[/C][C]-8.63038819653344[/C][/ROW]
[ROW][C]58[/C][C]95.2[/C][C]104.489337180510[/C][C]-9.28933718051036[/C][/ROW]
[ROW][C]59[/C][C]95.6[/C][C]99.500197201929[/C][C]-3.90019720192905[/C][/ROW]
[ROW][C]60[/C][C]89.7[/C][C]91.8338509287113[/C][C]-2.13385092871126[/C][/ROW]
[/TABLE]
Source: https://freestatistics.org/blog/index.php?pk=58662&T=4

Globally Unique Identifier (entire table): ba.freestatistics.org/blog/index.php?pk=58662&T=4

As an alternative you can also use a QR Code:  

The GUIDs for individual cells are displayed in the table below:

Multiple Linear Regression - Actuals, Interpolation, and Residuals
Time or IndexActualsInterpolationForecastResidualsPrediction Error
199.996.4278866447023.47211335529794
298.696.5593433878352.040656612165
3107.2105.0674747102682.13252528973200
495.798.405187890942-2.70518789094208
593.795.3545075408763-1.65450754087626
6106.7102.3377730711254.36222692887497
786.782.28810137720754.41189862279248
895.389.70469853548075.59530146451934
999.3101.491641530412-2.19164153041248
10101.8105.647994010955-3.84799401095491
119697.3484059453892-1.34840594538917
1291.787.99373114780943.70626885219064
1395.395.5671701420864-0.267170142086404
1496.695.10274622956191.49725377043812
15107.2103.6108775519953.58912244800513
16108100.6231881092227.37681189077837
1798.495.3876120217463.01238797825391
18103.1101.8412058580771.25879414192263
1981.183.9433254206997-2.84332542069973
2096.688.84398203286477.75601796713528
21103.7103.4448059017330.255194098266718
22106.6106.70733739879-0.107337398789911
2397.697.14977906017010.450220939829870
2487.688.4240893991173-0.824089399117342
2599.495.96442391252453.43557608747548
2698.595.40068655739053.09931344260953
27105.2103.4122506667761.78774933322419
28104.6100.4907701857424.10922981425774
2997.594.09653726782223.40346273217782
30108.9101.7749968963387.12500310366232
3186.884.40678815287752.39321184712246
3288.988.11568345372820.784316546271857
33110.3104.4048358469595.89516415304124
34114.8106.4093970709618.39060292903869
3594.696.123540153205-1.52354015320497
369290.04620896173971.95379103826031
3793.895.203020852518-1.40302085251812
3893.895.4006865573905-1.60068655739047
39107.6105.8288777702741.77112222972558
40101100.5569791474820.443020852518057
4195.493.86480590173331.53519409826673
4296.5104.059206076357-7.55920607635692
4389.284.40678815287754.79321184712246
4487.190.3998926337474-3.29989263374738
45110.5105.8283285243624.67167147563796
46110.8105.9459343387844.8540656612165
47104.297.87807763930676.32192236069331
4888.991.6021195626223-2.70211956262234
4989.895.0374984481689-5.2374984481689
509095.0365372678222-5.03653726782219
5193.9103.180519300687-9.2805193006869
5291.3100.523874666612-9.2238746666121
5387.894.0965372678222-6.29653726782219
5499.7104.886818098103-5.18681809810301
5573.582.2549968963377-8.75499689633769
5679.290.035743344179-10.8357433441791
5796.9105.530388196533-8.63038819653344
5895.2104.489337180510-9.28933718051036
5995.699.500197201929-3.90019720192905
6089.791.8338509287113-2.13385092871126


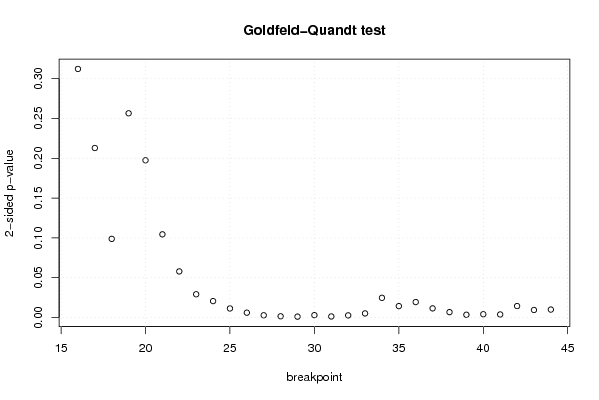
Goldfeld-Quandt test for Heteroskedasticity
p-valuesAlternative Hypothesis
breakpoint indexgreater2-sidedless
160.156095469101240.312190938202480.84390453089876
170.1064562573380050.2129125146760090.893543742661995
180.04941507400941120.09883014801882250.950584925990589
190.1282526460626780.2565052921253560.871747353937322
200.0987481574088180.1974963148176360.901251842591182
210.05225151611258400.1045030322251680.947748483887416
220.02897182112305980.05794364224611960.97102817887694
230.01463157894097020.02926315788194040.98536842105903
240.01033419428335840.02066838856671680.989665805716642
250.005715650776292590.01143130155258520.994284349223707
260.003056420052716080.006112840105432160.996943579947284
270.001429951293328080.002859902586656170.998570048706672
280.0007893882237595720.001578776447519140.99921061177624
290.0005639925425026530.001127985085005310.999436007457497
300.001519426018311120.003038852036622250.99848057398169
310.0006821247222880890.001364249444576180.999317875277712
320.001371107592475510.002742215184951010.998628892407525
330.002601428096414770.005202856192829530.997398571903585
340.01239698422411730.02479396844823450.987603015775883
350.00719278150343620.01438556300687240.992807218496564
360.009723239275519020.01944647855103800.99027676072448
370.005763742910540470.01152748582108090.99423625708946
380.003388121355566090.006776242711132180.996611878644434
390.001758955435495140.003517910870990280.998241044564505
400.00208739689117850.0041747937823570.997912603108821
410.001932967089751730.003865934179503460.998067032910248
420.007227122130655920.01445424426131180.992772877869344
430.00474476298317150.0094895259663430.995255237016828
440.005014087062136810.01002817412427360.994985912937863

\begin{tabular}{lllllllll}
\hline
Goldfeld-Quandt test for Heteroskedasticity \tabularnewline
p-values & Alternative Hypothesis \tabularnewline
breakpoint index & greater & 2-sided & less \tabularnewline
16 & 0.15609546910124 & 0.31219093820248 & 0.84390453089876 \tabularnewline
17 & 0.106456257338005 & 0.212912514676009 & 0.893543742661995 \tabularnewline
18 & 0.0494150740094112 & 0.0988301480188225 & 0.950584925990589 \tabularnewline
19 & 0.128252646062678 & 0.256505292125356 & 0.871747353937322 \tabularnewline
20 & 0.098748157408818 & 0.197496314817636 & 0.901251842591182 \tabularnewline
21 & 0.0522515161125840 & 0.104503032225168 & 0.947748483887416 \tabularnewline
22 & 0.0289718211230598 & 0.0579436422461196 & 0.97102817887694 \tabularnewline
23 & 0.0146315789409702 & 0.0292631578819404 & 0.98536842105903 \tabularnewline
24 & 0.0103341942833584 & 0.0206683885667168 & 0.989665805716642 \tabularnewline
25 & 0.00571565077629259 & 0.0114313015525852 & 0.994284349223707 \tabularnewline
26 & 0.00305642005271608 & 0.00611284010543216 & 0.996943579947284 \tabularnewline
27 & 0.00142995129332808 & 0.00285990258665617 & 0.998570048706672 \tabularnewline
28 & 0.000789388223759572 & 0.00157877644751914 & 0.99921061177624 \tabularnewline
29 & 0.000563992542502653 & 0.00112798508500531 & 0.999436007457497 \tabularnewline
30 & 0.00151942601831112 & 0.00303885203662225 & 0.99848057398169 \tabularnewline
31 & 0.000682124722288089 & 0.00136424944457618 & 0.999317875277712 \tabularnewline
32 & 0.00137110759247551 & 0.00274221518495101 & 0.998628892407525 \tabularnewline
33 & 0.00260142809641477 & 0.00520285619282953 & 0.997398571903585 \tabularnewline
34 & 0.0123969842241173 & 0.0247939684482345 & 0.987603015775883 \tabularnewline
35 & 0.0071927815034362 & 0.0143855630068724 & 0.992807218496564 \tabularnewline
36 & 0.00972323927551902 & 0.0194464785510380 & 0.99027676072448 \tabularnewline
37 & 0.00576374291054047 & 0.0115274858210809 & 0.99423625708946 \tabularnewline
38 & 0.00338812135556609 & 0.00677624271113218 & 0.996611878644434 \tabularnewline
39 & 0.00175895543549514 & 0.00351791087099028 & 0.998241044564505 \tabularnewline
40 & 0.0020873968911785 & 0.004174793782357 & 0.997912603108821 \tabularnewline
41 & 0.00193296708975173 & 0.00386593417950346 & 0.998067032910248 \tabularnewline
42 & 0.00722712213065592 & 0.0144542442613118 & 0.992772877869344 \tabularnewline
43 & 0.0047447629831715 & 0.009489525966343 & 0.995255237016828 \tabularnewline
44 & 0.00501408706213681 & 0.0100281741242736 & 0.994985912937863 \tabularnewline
\hline
\end{tabular}
%Source: https://freestatistics.org/blog/index.php?pk=58662&T=5

[TABLE]
[ROW][C]Goldfeld-Quandt test for Heteroskedasticity[/C][/ROW]
[ROW][C]p-values[/C][C]Alternative Hypothesis[/C][/ROW]
[ROW][C]breakpoint index[/C][C]greater[/C][C]2-sided[/C][C]less[/C][/ROW]
[ROW][C]16[/C][C]0.15609546910124[/C][C]0.31219093820248[/C][C]0.84390453089876[/C][/ROW]
[ROW][C]17[/C][C]0.106456257338005[/C][C]0.212912514676009[/C][C]0.893543742661995[/C][/ROW]
[ROW][C]18[/C][C]0.0494150740094112[/C][C]0.0988301480188225[/C][C]0.950584925990589[/C][/ROW]
[ROW][C]19[/C][C]0.128252646062678[/C][C]0.256505292125356[/C][C]0.871747353937322[/C][/ROW]
[ROW][C]20[/C][C]0.098748157408818[/C][C]0.197496314817636[/C][C]0.901251842591182[/C][/ROW]
[ROW][C]21[/C][C]0.0522515161125840[/C][C]0.104503032225168[/C][C]0.947748483887416[/C][/ROW]
[ROW][C]22[/C][C]0.0289718211230598[/C][C]0.0579436422461196[/C][C]0.97102817887694[/C][/ROW]
[ROW][C]23[/C][C]0.0146315789409702[/C][C]0.0292631578819404[/C][C]0.98536842105903[/C][/ROW]
[ROW][C]24[/C][C]0.0103341942833584[/C][C]0.0206683885667168[/C][C]0.989665805716642[/C][/ROW]
[ROW][C]25[/C][C]0.00571565077629259[/C][C]0.0114313015525852[/C][C]0.994284349223707[/C][/ROW]
[ROW][C]26[/C][C]0.00305642005271608[/C][C]0.00611284010543216[/C][C]0.996943579947284[/C][/ROW]
[ROW][C]27[/C][C]0.00142995129332808[/C][C]0.00285990258665617[/C][C]0.998570048706672[/C][/ROW]
[ROW][C]28[/C][C]0.000789388223759572[/C][C]0.00157877644751914[/C][C]0.99921061177624[/C][/ROW]
[ROW][C]29[/C][C]0.000563992542502653[/C][C]0.00112798508500531[/C][C]0.999436007457497[/C][/ROW]
[ROW][C]30[/C][C]0.00151942601831112[/C][C]0.00303885203662225[/C][C]0.99848057398169[/C][/ROW]
[ROW][C]31[/C][C]0.000682124722288089[/C][C]0.00136424944457618[/C][C]0.999317875277712[/C][/ROW]
[ROW][C]32[/C][C]0.00137110759247551[/C][C]0.00274221518495101[/C][C]0.998628892407525[/C][/ROW]
[ROW][C]33[/C][C]0.00260142809641477[/C][C]0.00520285619282953[/C][C]0.997398571903585[/C][/ROW]
[ROW][C]34[/C][C]0.0123969842241173[/C][C]0.0247939684482345[/C][C]0.987603015775883[/C][/ROW]
[ROW][C]35[/C][C]0.0071927815034362[/C][C]0.0143855630068724[/C][C]0.992807218496564[/C][/ROW]
[ROW][C]36[/C][C]0.00972323927551902[/C][C]0.0194464785510380[/C][C]0.99027676072448[/C][/ROW]
[ROW][C]37[/C][C]0.00576374291054047[/C][C]0.0115274858210809[/C][C]0.99423625708946[/C][/ROW]
[ROW][C]38[/C][C]0.00338812135556609[/C][C]0.00677624271113218[/C][C]0.996611878644434[/C][/ROW]
[ROW][C]39[/C][C]0.00175895543549514[/C][C]0.00351791087099028[/C][C]0.998241044564505[/C][/ROW]
[ROW][C]40[/C][C]0.0020873968911785[/C][C]0.004174793782357[/C][C]0.997912603108821[/C][/ROW]
[ROW][C]41[/C][C]0.00193296708975173[/C][C]0.00386593417950346[/C][C]0.998067032910248[/C][/ROW]
[ROW][C]42[/C][C]0.00722712213065592[/C][C]0.0144542442613118[/C][C]0.992772877869344[/C][/ROW]
[ROW][C]43[/C][C]0.0047447629831715[/C][C]0.009489525966343[/C][C]0.995255237016828[/C][/ROW]
[ROW][C]44[/C][C]0.00501408706213681[/C][C]0.0100281741242736[/C][C]0.994985912937863[/C][/ROW]
[/TABLE]
Source: https://freestatistics.org/blog/index.php?pk=58662&T=5

Globally Unique Identifier (entire table): ba.freestatistics.org/blog/index.php?pk=58662&T=5

As an alternative you can also use a QR Code:  

The GUIDs for individual cells are displayed in the table below:

Goldfeld-Quandt test for Heteroskedasticity
p-valuesAlternative Hypothesis
breakpoint indexgreater2-sidedless
160.156095469101240.312190938202480.84390453089876
170.1064562573380050.2129125146760090.893543742661995
180.04941507400941120.09883014801882250.950584925990589
190.1282526460626780.2565052921253560.871747353937322
200.0987481574088180.1974963148176360.901251842591182
210.05225151611258400.1045030322251680.947748483887416
220.02897182112305980.05794364224611960.97102817887694
230.01463157894097020.02926315788194040.98536842105903
240.01033419428335840.02066838856671680.989665805716642
250.005715650776292590.01143130155258520.994284349223707
260.003056420052716080.006112840105432160.996943579947284
270.001429951293328080.002859902586656170.998570048706672
280.0007893882237595720.001578776447519140.99921061177624
290.0005639925425026530.001127985085005310.999436007457497
300.001519426018311120.003038852036622250.99848057398169
310.0006821247222880890.001364249444576180.999317875277712
320.001371107592475510.002742215184951010.998628892407525
330.002601428096414770.005202856192829530.997398571903585
340.01239698422411730.02479396844823450.987603015775883
350.00719278150343620.01438556300687240.992807218496564
360.009723239275519020.01944647855103800.99027676072448
370.005763742910540470.01152748582108090.99423625708946
380.003388121355566090.006776242711132180.996611878644434
390.001758955435495140.003517910870990280.998241044564505
400.00208739689117850.0041747937823570.997912603108821
410.001932967089751730.003865934179503460.998067032910248
420.007227122130655920.01445424426131180.992772877869344
430.00474476298317150.0094895259663430.995255237016828
440.005014087062136810.01002817412427360.994985912937863


Meta Analysis of Goldfeld-Quandt test for Heteroskedasticity
Description# significant tests% significant testsOK/NOK
1% type I error level130.448275862068966NOK
5% type I error level220.758620689655172NOK
10% type I error level240.827586206896552NOK

\begin{tabular}{lllllllll}
\hline
Meta Analysis of Goldfeld-Quandt test for Heteroskedasticity \tabularnewline
Description & # significant tests & % significant tests & OK/NOK \tabularnewline
1% type I error level & 13 & 0.448275862068966 & NOK \tabularnewline
5% type I error level & 22 & 0.758620689655172 & NOK \tabularnewline
10% type I error level & 24 & 0.827586206896552 & NOK \tabularnewline
\hline
\end{tabular}
%Source: https://freestatistics.org/blog/index.php?pk=58662&T=6

[TABLE]
[ROW][C]Meta Analysis of Goldfeld-Quandt test for Heteroskedasticity[/C][/ROW]
[ROW][C]Description[/C][C]# significant tests[/C][C]% significant tests[/C][C]OK/NOK[/C][/ROW]
[ROW][C]1% type I error level[/C][C]13[/C][C]0.448275862068966[/C][C]NOK[/C][/ROW]
[ROW][C]5% type I error level[/C][C]22[/C][C]0.758620689655172[/C][C]NOK[/C][/ROW]
[ROW][C]10% type I error level[/C][C]24[/C][C]0.827586206896552[/C][C]NOK[/C][/ROW]
[/TABLE]
Source: https://freestatistics.org/blog/index.php?pk=58662&T=6

Globally Unique Identifier (entire table): ba.freestatistics.org/blog/index.php?pk=58662&T=6

As an alternative you can also use a QR Code:  

The GUIDs for individual cells are displayed in the table below:

Meta Analysis of Goldfeld-Quandt test for Heteroskedasticity
Description# significant tests% significant testsOK/NOK
1% type I error level130.448275862068966NOK
5% type I error level220.758620689655172NOK
10% type I error level240.827586206896552NOK


Parameters (Session):
par1 = 1 ; par2 = Include Monthly Dummies ; par3 = No Linear Trend ;
Parameters (R input):
par1 = 1 ; par2 = Include Monthly Dummies ; par3 = No Linear Trend ;
R code (references can be found in the software module):
library(lattice)
library(lmtest)
n25 <- 25 #minimum number of obs. for Goldfeld-Quandt test
par1 <- as.numeric(par1)
x <- t(y)
k <- length(x[1,])
n <- length(x[,1])
x1 <- cbind(x[,par1], x[,1:k!=par1])
mycolnames <- c(colnames(x)[par1], colnames(x)[1:k!=par1])
colnames(x1) <- mycolnames #colnames(x)[par1]
x <- x1
if (par3 == 'First Differences'){
x2 <- array(0, dim=c(n-1,k), dimnames=list(1:(n-1), paste('(1-B)',colnames(x),sep='')))
for (i in 1:n-1) {
for (j in 1:k) {
x2[i,j] <- x[i+1,j] - x[i,j]
}
}
x <- x2
}
if (par2 == 'Include Monthly Dummies'){
x2 <- array(0, dim=c(n,11), dimnames=list(1:n, paste('M', seq(1:11), sep ='')))
for (i in 1:11){
x2[seq(i,n,12),i] <- 1
}
x <- cbind(x, x2)
}
if (par2 == 'Include Quarterly Dummies'){
x2 <- array(0, dim=c(n,3), dimnames=list(1:n, paste('Q', seq(1:3), sep ='')))
for (i in 1:3){
x2[seq(i,n,4),i] <- 1
}
x <- cbind(x, x2)
}
k <- length(x[1,])
if (par3 == 'Linear Trend'){
x <- cbind(x, c(1:n))
colnames(x)[k+1] <- 't'
}
x
k <- length(x[1,])
df <- as.data.frame(x)
(mylm <- lm(df))
(mysum <- summary(mylm))
if (n > n25) {
kp3 <- k + 3
nmkm3 <- n - k - 3
gqarr <- array(NA, dim=c(nmkm3-kp3+1,3))
numgqtests <- 0
numsignificant1 <- 0
numsignificant5 <- 0
numsignificant10 <- 0
for (mypoint in kp3:nmkm3) {
j <- 0
numgqtests <- numgqtests + 1
for (myalt in c('greater', 'two.sided', 'less')) {
j <- j + 1
gqarr[mypoint-kp3+1,j] <- gqtest(mylm, point=mypoint, alternative=myalt)$p.value
}
if (gqarr[mypoint-kp3+1,2] < 0.01) numsignificant1 <- numsignificant1 + 1
if (gqarr[mypoint-kp3+1,2] < 0.05) numsignificant5 <- numsignificant5 + 1
if (gqarr[mypoint-kp3+1,2] < 0.10) numsignificant10 <- numsignificant10 + 1
}
gqarr
}
bitmap(file='test0.png')
plot(x[,1], type='l', main='Actuals and Interpolation', ylab='value of Actuals and Interpolation (dots)', xlab='time or index')
points(x[,1]-mysum$resid)
grid()
dev.off()
bitmap(file='test1.png')
plot(mysum$resid, type='b', pch=19, main='Residuals', ylab='value of Residuals', xlab='time or index')
grid()
dev.off()
bitmap(file='test2.png')
hist(mysum$resid, main='Residual Histogram', xlab='values of Residuals')
grid()
dev.off()
bitmap(file='test3.png')
densityplot(~mysum$resid,col='black',main='Residual Density Plot', xlab='values of Residuals')
dev.off()
bitmap(file='test4.png')
qqnorm(mysum$resid, main='Residual Normal Q-Q Plot')
qqline(mysum$resid)
grid()
dev.off()
(myerror <- as.ts(mysum$resid))
bitmap(file='test5.png')
dum <- cbind(lag(myerror,k=1),myerror)
dum
dum1 <- dum[2:length(myerror),]
dum1
z <- as.data.frame(dum1)
z
plot(z,main=paste('Residual Lag plot, lowess, and regression line'), ylab='values of Residuals', xlab='lagged values of Residuals')
lines(lowess(z))
abline(lm(z))
grid()
dev.off()
bitmap(file='test6.png')
acf(mysum$resid, lag.max=length(mysum$resid)/2, main='Residual Autocorrelation Function')
grid()
dev.off()
bitmap(file='test7.png')
pacf(mysum$resid, lag.max=length(mysum$resid)/2, main='Residual Partial Autocorrelation Function')
grid()
dev.off()
bitmap(file='test8.png')
opar <- par(mfrow = c(2,2), oma = c(0, 0, 1.1, 0))
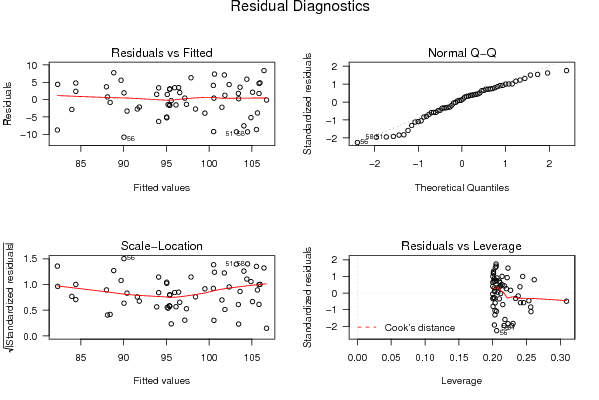
plot(mylm, las = 1, sub='Residual Diagnostics')
par(opar)
dev.off()
if (n > n25) {
bitmap(file='test9.png')
plot(kp3:nmkm3,gqarr[,2], main='Goldfeld-Quandt test',ylab='2-sided p-value',xlab='breakpoint')
grid()
dev.off()
}
load(file='createtable')
a<-table.start()
a<-table.row.start(a)
a<-table.element(a, 'Multiple Linear Regression - Estimated Regression Equation', 1, TRUE)
a<-table.row.end(a)
myeq <- colnames(x)[1]
myeq <- paste(myeq, '[t] = ', sep='')
for (i in 1:k){
if (mysum$coefficients[i,1] > 0) myeq <- paste(myeq, '+', '')
myeq <- paste(myeq, mysum$coefficients[i,1], sep=' ')
if (rownames(mysum$coefficients)[i] != '(Intercept)') {
myeq <- paste(myeq, rownames(mysum$coefficients)[i], sep='')
if (rownames(mysum$coefficients)[i] != 't') myeq <- paste(myeq, '[t]', sep='')
}
}
myeq <- paste(myeq, ' + e[t]')
a<-table.row.start(a)
a<-table.element(a, myeq)
a<-table.row.end(a)
a<-table.end(a)
table.save(a,file='mytable1.tab')
a<-table.start()
a<-table.row.start(a)
a<-table.element(a,hyperlink('ols1.htm','Multiple Linear Regression - Ordinary Least Squares',''), 6, TRUE)
a<-table.row.end(a)
a<-table.row.start(a)
a<-table.element(a,'Variable',header=TRUE)
a<-table.element(a,'Parameter',header=TRUE)
a<-table.element(a,'S.D.',header=TRUE)
a<-table.element(a,'T-STAT
H0: parameter = 0',header=TRUE)
a<-table.element(a,'2-tail p-value',header=TRUE)
a<-table.element(a,'1-tail p-value',header=TRUE)
a<-table.row.end(a)
for (i in 1:k){
a<-table.row.start(a)
a<-table.element(a,rownames(mysum$coefficients)[i],header=TRUE)
a<-table.element(a,mysum$coefficients[i,1])
a<-table.element(a, round(mysum$coefficients[i,2],6))
a<-table.element(a, round(mysum$coefficients[i,3],4))
a<-table.element(a, round(mysum$coefficients[i,4],6))
a<-table.element(a, round(mysum$coefficients[i,4]/2,6))
a<-table.row.end(a)
}
a<-table.end(a)
table.save(a,file='mytable2.tab')
a<-table.start()
a<-table.row.start(a)
a<-table.element(a, 'Multiple Linear Regression - Regression Statistics', 2, TRUE)
a<-table.row.end(a)
a<-table.row.start(a)
a<-table.element(a, 'Multiple R',1,TRUE)
a<-table.element(a, sqrt(mysum$r.squared))
a<-table.row.end(a)
a<-table.row.start(a)
a<-table.element(a, 'R-squared',1,TRUE)
a<-table.element(a, mysum$r.squared)
a<-table.row.end(a)
a<-table.row.start(a)
a<-table.element(a, 'Adjusted R-squared',1,TRUE)
a<-table.element(a, mysum$adj.r.squared)
a<-table.row.end(a)
a<-table.row.start(a)
a<-table.element(a, 'F-TEST (value)',1,TRUE)
a<-table.element(a, mysum$fstatistic[1])
a<-table.row.end(a)
a<-table.row.start(a)
a<-table.element(a, 'F-TEST (DF numerator)',1,TRUE)
a<-table.element(a, mysum$fstatistic[2])
a<-table.row.end(a)
a<-table.row.start(a)
a<-table.element(a, 'F-TEST (DF denominator)',1,TRUE)
a<-table.element(a, mysum$fstatistic[3])
a<-table.row.end(a)
a<-table.row.start(a)
a<-table.element(a, 'p-value',1,TRUE)
a<-table.element(a, 1-pf(mysum$fstatistic[1],mysum$fstatistic[2],mysum$fstatistic[3]))
a<-table.row.end(a)
a<-table.row.start(a)
a<-table.element(a, 'Multiple Linear Regression - Residual Statistics', 2, TRUE)
a<-table.row.end(a)
a<-table.row.start(a)
a<-table.element(a, 'Residual Standard Deviation',1,TRUE)
a<-table.element(a, mysum$sigma)
a<-table.row.end(a)
a<-table.row.start(a)
a<-table.element(a, 'Sum Squared Residuals',1,TRUE)
a<-table.element(a, sum(myerror*myerror))
a<-table.row.end(a)
a<-table.end(a)
table.save(a,file='mytable3.tab')
a<-table.start()
a<-table.row.start(a)
a<-table.element(a, 'Multiple Linear Regression - Actuals, Interpolation, and Residuals', 4, TRUE)
a<-table.row.end(a)
a<-table.row.start(a)
a<-table.element(a, 'Time or Index', 1, TRUE)
a<-table.element(a, 'Actuals', 1, TRUE)
a<-table.element(a, 'Interpolation
Forecast', 1, TRUE)
a<-table.element(a, 'Residuals
Prediction Error', 1, TRUE)
a<-table.row.end(a)
for (i in 1:n) {
a<-table.row.start(a)
a<-table.element(a,i, 1, TRUE)
a<-table.element(a,x[i])
a<-table.element(a,x[i]-mysum$resid[i])
a<-table.element(a,mysum$resid[i])
a<-table.row.end(a)
}
a<-table.end(a)
table.save(a,file='mytable4.tab')
if (n > n25) {
a<-table.start()
a<-table.row.start(a)
a<-table.element(a,'Goldfeld-Quandt test for Heteroskedasticity',4,TRUE)
a<-table.row.end(a)
a<-table.row.start(a)
a<-table.element(a,'p-values',header=TRUE)
a<-table.element(a,'Alternative Hypothesis',3,header=TRUE)
a<-table.row.end(a)
a<-table.row.start(a)
a<-table.element(a,'breakpoint index',header=TRUE)
a<-table.element(a,'greater',header=TRUE)
a<-table.element(a,'2-sided',header=TRUE)
a<-table.element(a,'less',header=TRUE)
a<-table.row.end(a)
for (mypoint in kp3:nmkm3) {
a<-table.row.start(a)
a<-table.element(a,mypoint,header=TRUE)
a<-table.element(a,gqarr[mypoint-kp3+1,1])
a<-table.element(a,gqarr[mypoint-kp3+1,2])
a<-table.element(a,gqarr[mypoint-kp3+1,3])
a<-table.row.end(a)
}
a<-table.end(a)
table.save(a,file='mytable5.tab')
a<-table.start()
a<-table.row.start(a)
a<-table.element(a,'Meta Analysis of Goldfeld-Quandt test for Heteroskedasticity',4,TRUE)
a<-table.row.end(a)
a<-table.row.start(a)
a<-table.element(a,'Description',header=TRUE)
a<-table.element(a,'# significant tests',header=TRUE)
a<-table.element(a,'% significant tests',header=TRUE)
a<-table.element(a,'OK/NOK',header=TRUE)
a<-table.row.end(a)
a<-table.row.start(a)
a<-table.element(a,'1% type I error level',header=TRUE)
a<-table.element(a,numsignificant1)
a<-table.element(a,numsignificant1/numgqtests)
if (numsignificant1/numgqtests < 0.01) dum <- 'OK' else dum <- 'NOK'
a<-table.element(a,dum)
a<-table.row.end(a)
a<-table.row.start(a)
a<-table.element(a,'5% type I error level',header=TRUE)
a<-table.element(a,numsignificant5)
a<-table.element(a,numsignificant5/numgqtests)
if (numsignificant5/numgqtests < 0.05) dum <- 'OK' else dum <- 'NOK'
a<-table.element(a,dum)
a<-table.row.end(a)
a<-table.row.start(a)
a<-table.element(a,'10% type I error level',header=TRUE)
a<-table.element(a,numsignificant10)
a<-table.element(a,numsignificant10/numgqtests)
if (numsignificant10/numgqtests < 0.1) dum <- 'OK' else dum <- 'NOK'
a<-table.element(a,dum)
a<-table.row.end(a)
a<-table.end(a)
table.save(a,file='mytable6.tab')
}