| Multiple Linear Regression - Estimated Regression Equation |
| TotProd[t] = + 16.3383193313249 + 0.800894252855453ProdMetal[t] + e[t] |
| Multiple Linear Regression - Ordinary Least Squares | |||||
| Variable | Parameter | S.D. | T-STAT H0: parameter = 0 | 2-tail p-value | 1-tail p-value |
| (Intercept) | 16.3383193313249 | 8.960284 | 1.8234 | 0.073395 | 0.036697 |
| ProdMetal | 0.800894252855453 | 0.088747 | 9.0245 | 0 | 0 |
| Multiple Linear Regression - Regression Statistics | |
| Multiple R | 0.764233944431027 |
| R-squared | 0.584053521820605 |
| Adjusted R-squared | 0.576882030817512 |
| F-TEST (value) | 81.441017156503 |
| F-TEST (DF numerator) | 1 |
| F-TEST (DF denominator) | 58 |
| p-value | 1.20836674000202e-12 |
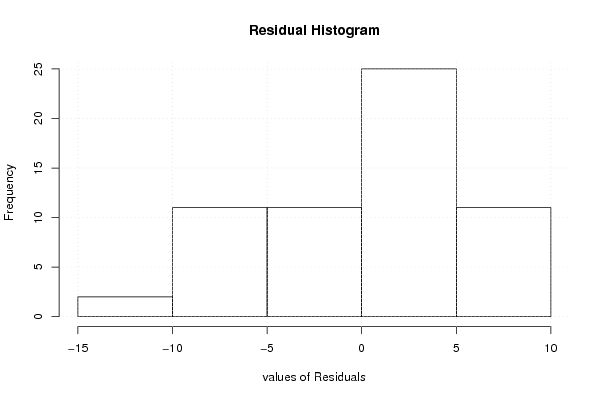
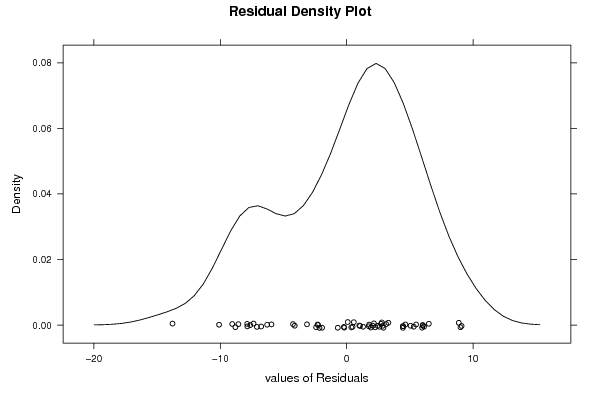
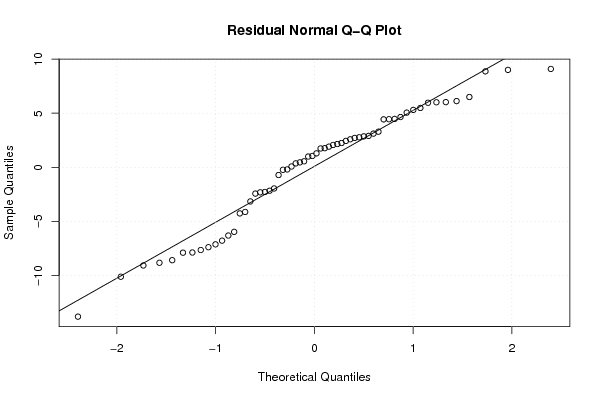
| Multiple Linear Regression - Residual Statistics | |
| Residual Standard Deviation | 5.39997904308062 |
| Sum Squared Residuals | 1691.26687261117 |
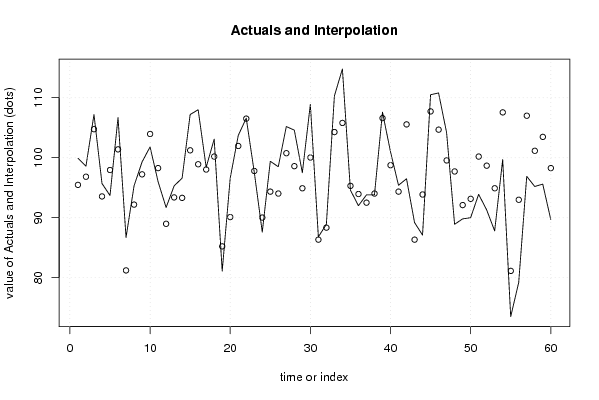
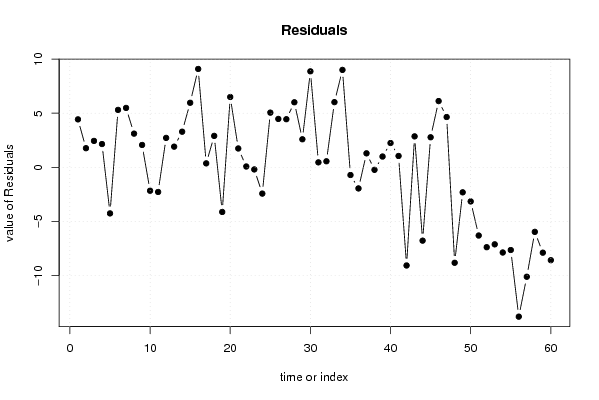
| Multiple Linear Regression - Actuals, Interpolation, and Residuals | |||
| Time or Index | Actuals | Interpolation Forecast | Residuals Prediction Error |
| 1 | 99.9 | 95.4666715134433 | 4.43332848655675 |
| 2 | 98.6 | 96.8281917432979 | 1.77180825670211 |
| 3 | 107.2 | 104.757044846567 | 2.44295515343312 |
| 4 | 95.7 | 93.5445253065905 | 2.15547469340946 |
| 5 | 93.7 | 97.9494436972955 | -4.24944369729553 |
| 6 | 106.7 | 101.393288984574 | 5.30671101542603 |
| 7 | 86.7 | 81.2107538126166 | 5.48924618738344 |
| 8 | 95.3 | 92.1830050767363 | 3.11699492326373 |
| 9 | 99.3 | 97.2286388697256 | 2.07136113027438 |
| 10 | 101.8 | 103.956150593711 | -2.15615059371143 |
| 11 | 96 | 98.2698013984377 | -2.26980139843770 |
| 12 | 91.7 | 88.9794280653145 | 2.72057193468554 |
| 13 | 95.3 | 93.3843464560194 | 1.91565354398055 |
| 14 | 96.6 | 93.3042570307339 | 3.2957429692661 |
| 15 | 107.2 | 101.233110134003 | 5.96688986599712 |
| 16 | 108 | 98.9105168007221 | 9.08948319927793 |
| 17 | 98.4 | 98.029533122581 | 0.370466877418934 |
| 18 | 103.1 | 100.191947605291 | 2.9080523947092 |
| 19 | 81.1 | 85.2152250768938 | -4.11522507689383 |
| 20 | 96.6 | 90.100680019312 | 6.49931998068791 |
| 21 | 103.7 | 101.953914961573 | 1.74608503842721 |
| 22 | 106.6 | 106.519012202849 | 0.0809877971511289 |
| 23 | 97.6 | 97.7892648467244 | -0.189264846724444 |
| 24 | 87.6 | 90.0205905940265 | -2.42059059402655 |
| 25 | 99.4 | 94.345419559446 | 5.05458044055401 |
| 26 | 98.5 | 94.0250618583038 | 4.47493814169619 |
| 27 | 105.2 | 100.752573582290 | 4.44742641771039 |
| 28 | 104.6 | 98.59015909958 | 6.0098409004201 |
| 29 | 97.5 | 94.9060455364448 | 2.5939544635552 |
| 30 | 108.9 | 100.031768754720 | 8.8682312452803 |
| 31 | 86.8 | 86.3364770308915 | 0.46352296910853 |
| 32 | 88.9 | 88.3387126630301 | 0.561287336969906 |
| 33 | 110.3 | 104.276508294854 | 6.0234917051464 |
| 34 | 114.8 | 105.798207375279 | 9.00179262472103 |
| 35 | 94.6 | 95.3064926628725 | -0.706492662872534 |
| 36 | 92 | 93.9449724330183 | -1.94497243301827 |
| 37 | 93.8 | 92.5033627778785 | 1.29663722212155 |
| 38 | 93.8 | 94.0250618583038 | -0.225061858303811 |
| 39 | 107.6 | 106.599101628134 | 1.00089837186558 |
| 40 | 101 | 98.750337950151 | 2.24966204984902 |
| 41 | 95.4 | 94.345419559446 | 1.05458044055401 |
| 42 | 96.5 | 105.557939099422 | -9.05793909942233 |
| 43 | 89.2 | 86.3364770308915 | 2.86352296910854 |
| 44 | 87.1 | 93.8648830077327 | -6.76488300773272 |
| 45 | 110.5 | 107.720353582132 | 2.77964641786796 |
| 46 | 110.8 | 104.676955421281 | 6.12304457871867 |
| 47 | 104.2 | 99.5512322030064 | 4.64876779699357 |
| 48 | 88.9 | 97.7091754214389 | -8.80917542143888 |
| 49 | 89.8 | 92.1029156514507 | -2.30291565145072 |
| 50 | 90 | 93.1440781801628 | -3.14407818016281 |
| 51 | 93.9 | 100.191947605291 | -6.29194760529079 |
| 52 | 91.3 | 98.6702485248654 | -7.37024852486543 |
| 53 | 87.8 | 94.9060455364448 | -7.1060455364448 |
| 54 | 99.7 | 107.560174731561 | -7.86017473156096 |
| 55 | 73.5 | 81.130664387331 | -7.63066438733102 |
| 56 | 79.2 | 92.9838993295917 | -13.7838993295917 |
| 57 | 96.9 | 106.999548754562 | -10.0995487545621 |
| 58 | 95.2 | 101.153020708717 | -5.95302070871734 |
| 59 | 95.6 | 103.475614041998 | -7.87561404199815 |
| 60 | 89.7 | 98.2698013984377 | -8.5698013984377 |
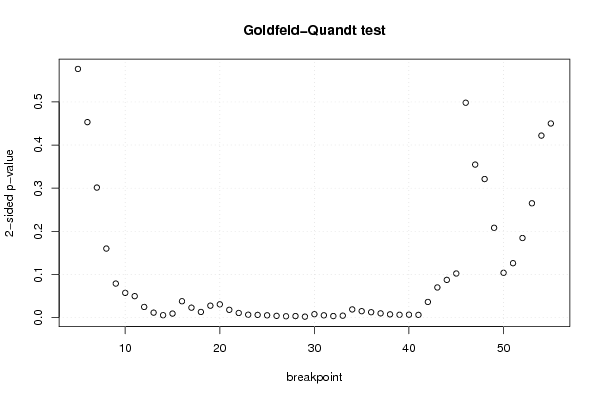
| Goldfeld-Quandt test for Heteroskedasticity | |||
| p-values | Alternative Hypothesis | ||
| breakpoint index | greater | 2-sided | less |
| 5 | 0.28820754290826 | 0.57641508581652 | 0.71179245709174 |
| 6 | 0.226556915056469 | 0.453113830112939 | 0.77344308494353 |
| 7 | 0.150701834725078 | 0.301403669450155 | 0.849298165274922 |
| 8 | 0.0800047727624063 | 0.160009545524813 | 0.919995227237594 |
| 9 | 0.0394187152855106 | 0.0788374305710212 | 0.96058128471449 |
| 10 | 0.0286418034517264 | 0.0572836069034528 | 0.971358196548274 |
| 11 | 0.0248373215388841 | 0.0496746430777683 | 0.975162678461116 |
| 12 | 0.0123144313391165 | 0.024628862678233 | 0.987685568660883 |
| 13 | 0.00572207118084090 | 0.0114441423616818 | 0.99427792881916 |
| 14 | 0.00275724838707733 | 0.00551449677415467 | 0.997242751612923 |
| 15 | 0.00463152921769821 | 0.00926305843539641 | 0.995368470782302 |
| 16 | 0.0189473385279612 | 0.0378946770559224 | 0.981052661472039 |
| 17 | 0.0114716912849693 | 0.0229433825699385 | 0.98852830871503 |
| 18 | 0.0065113870350074 | 0.0130227740700148 | 0.993488612964993 |
| 19 | 0.0137924120037852 | 0.0275848240075705 | 0.986207587996215 |
| 20 | 0.0153634994966310 | 0.0307269989932620 | 0.984636500503369 |
| 21 | 0.00897658253776942 | 0.0179531650755388 | 0.99102341746223 |
| 22 | 0.00533959181080014 | 0.0106791836216003 | 0.9946604081892 |
| 23 | 0.00328417967476883 | 0.00656835934953766 | 0.996715820325231 |
| 24 | 0.00308648300203185 | 0.00617296600406371 | 0.996913516997968 |
| 25 | 0.00262495605021207 | 0.00524991210042414 | 0.997375043949788 |
| 26 | 0.00200202607384317 | 0.00400405214768634 | 0.997997973926157 |
| 27 | 0.00151140952428088 | 0.00302281904856177 | 0.998488590475719 |
| 28 | 0.00172843289761186 | 0.00345686579522372 | 0.998271567102388 |
| 29 | 0.00106935808663315 | 0.0021387161732663 | 0.998930641913367 |
| 30 | 0.003908105076335 | 0.00781621015267 | 0.996091894923665 |
| 31 | 0.00262076068560393 | 0.00524152137120786 | 0.997379239314396 |
| 32 | 0.00175926858902727 | 0.00351853717805453 | 0.998240731410973 |
| 33 | 0.00221464041566051 | 0.00442928083132103 | 0.99778535958434 |
| 34 | 0.00946502032425226 | 0.0189300406485045 | 0.990534979675748 |
| 35 | 0.00742764904941115 | 0.0148552980988223 | 0.992572350950589 |
| 36 | 0.00620167445654422 | 0.0124033489130884 | 0.993798325543456 |
| 37 | 0.0049002854835543 | 0.0098005709671086 | 0.995099714516446 |
| 38 | 0.00372855913482909 | 0.00745711826965817 | 0.996271440865171 |
| 39 | 0.00324248520971889 | 0.00648497041943778 | 0.996757514790281 |
| 40 | 0.00332971732905676 | 0.00665943465811352 | 0.996670282670943 |
| 41 | 0.00312271192739483 | 0.00624542385478965 | 0.996877288072605 |
| 42 | 0.0181100341126104 | 0.0362200682252208 | 0.98188996588739 |
| 43 | 0.0349249230363314 | 0.0698498460726629 | 0.965075076963669 |
| 44 | 0.0436932079988374 | 0.087386415997675 | 0.956306792001163 |
| 45 | 0.051088789150932 | 0.102177578301864 | 0.948911210849068 |
| 46 | 0.249038905974161 | 0.498077811948322 | 0.750961094025839 |
| 47 | 0.822652210993679 | 0.354695578012642 | 0.177347789006321 |
| 48 | 0.839430151663031 | 0.321139696673937 | 0.160569848336969 |
| 49 | 0.895918189522991 | 0.208163620954017 | 0.104081810477009 |
| 50 | 0.94809230187468 | 0.103815396250640 | 0.0519076981253202 |
| 51 | 0.936959971829901 | 0.126080056340198 | 0.0630400281700988 |
| 52 | 0.907779015019027 | 0.184441969961947 | 0.0922209849809733 |
| 53 | 0.867510026484353 | 0.264979947031293 | 0.132489973515647 |
| 54 | 0.789059669004185 | 0.421880661991630 | 0.210940330995815 |
| 55 | 0.77499353320415 | 0.4500129335917 | 0.22500646679585 |
| Meta Analysis of Goldfeld-Quandt test for Heteroskedasticity | |||
| Description | # significant tests | % significant tests | OK/NOK |
| 1% type I error level | 18 | 0.352941176470588 | NOK |
| 5% type I error level | 32 | 0.627450980392157 | NOK |
| 10% type I error level | 36 | 0.705882352941177 | NOK |