| Multiple Linear Regression - Estimated Regression Equation |
| Yt[t] = + 201.730817279814 -11.4118617949622X[t] + 1.21358991033072`Yt-1`[t] -0.250695764968951`Yt-2 `[t] -2.51442156104134t + e[t] |
| Multiple Linear Regression - Ordinary Least Squares | |||||
| Variable | Parameter | S.D. | T-STAT H0: parameter = 0 | 2-tail p-value | 1-tail p-value |
| (Intercept) | 201.730817279814 | 182.919049 | 1.1028 | 0.275078 | 0.137539 |
| X | -11.4118617949622 | 86.199045 | -0.1324 | 0.895177 | 0.447589 |
| `Yt-1` | 1.21358991033072 | 0.136841 | 8.8686 | 0 | 0 |
| `Yt-2 ` | -0.250695764968951 | 0.134741 | -1.8606 | 0.068356 | 0.034178 |
| t | -2.51442156104134 | 1.824066 | -1.3785 | 0.173849 | 0.086925 |
| Multiple Linear Regression - Regression Statistics | |
| Multiple R | 0.980150857748208 |
| R-squared | 0.960695703944548 |
| Adjusted R-squared | 0.957729341978098 |
| F-TEST (value) | 323.863275894988 |
| F-TEST (DF numerator) | 4 |
| F-TEST (DF denominator) | 53 |
| p-value | 0 |
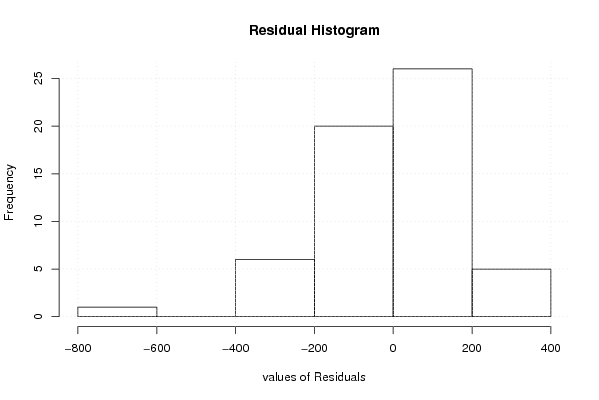
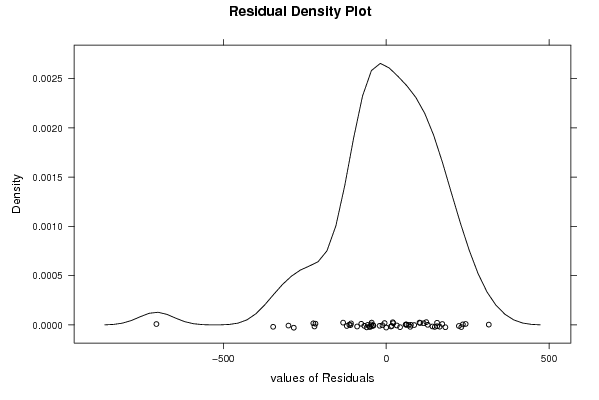
| Multiple Linear Regression - Residual Statistics | |
| Residual Standard Deviation | 176.239030887663 |
| Sum Squared Residuals | 1646190.38843581 |
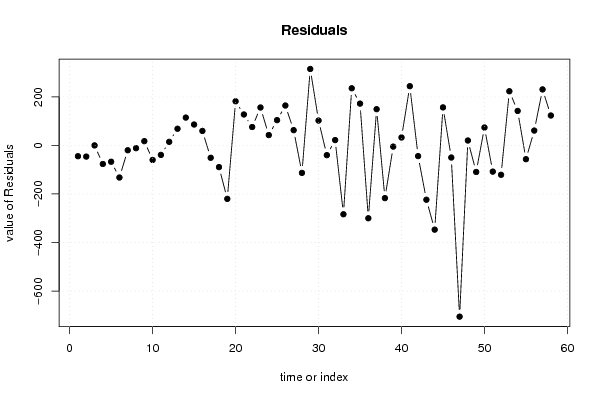
| Multiple Linear Regression - Actuals, Interpolation, and Residuals | |||
| Time or Index | Actuals | Interpolation Forecast | Residuals Prediction Error |
| 1 | 2921.44 | 2965.95366249096 | -44.5136624909641 |
| 2 | 2981.85 | 3027.83215954121 | -45.9821595412143 |
| 3 | 3080.58 | 3080.53799110544 | 0.0420088945597845 |
| 4 | 3106.22 | 3182.69677022958 | -76.4767702295774 |
| 5 | 3119.31 | 3186.54760109403 | -67.2376010940309 |
| 6 | 3061.26 | 3193.49123204541 | -132.231232045415 |
| 7 | 3097.31 | 3117.24630862623 | -19.9363086262322 |
| 8 | 3161.69 | 3173.03469248906 | -11.3446924890602 |
| 9 | 3257.16 | 3239.61360702798 | 17.54639297202 |
| 10 | 3277.01 | 3336.82082085751 | -59.8108208575104 |
| 11 | 3295.32 | 3334.46223433495 | -39.1422343349486 |
| 12 | 3363.99 | 3349.19233309743 | 14.7976669025708 |
| 13 | 3494.17 | 3425.42489122222 | 68.7451087777843 |
| 14 | 3667.03 | 3552.26846421265 | 114.761535787353 |
| 15 | 3813.06 | 3726.89961986772 | 86.1603801322848 |
| 16 | 3917.96 | 3858.27046297973 | 59.689537020265 |
| 17 | 3895.51 | 3946.45252045397 | -50.9425204539698 |
| 18 | 3801.06 | 3890.39501966076 | -89.3350196607614 |
| 19 | 3570.12 | 3790.2970127875 | -220.177012787499 |
| 20 | 3701.61 | 3519.78249054104 | 181.827509458963 |
| 21 | 3862.27 | 3734.73868625131 | 127.531313748689 |
| 22 | 3970.1 | 3894.23563354824 | 75.8643664517647 |
| 23 | 4138.52 | 3982.30583041824 | 156.214169581757 |
| 24 | 4199.75 | 4157.1516972185 | 42.5983027815003 |
| 25 | 4290.89 | 4186.72320513094 | 104.166794869064 |
| 26 | 4443.91 | 4279.46526630839 | 164.444733691612 |
| 27 | 4502.64 | 4439.80596080688 | 62.8340391931181 |
| 28 | 4356.98 | 4470.20420872402 | -113.224208724016 |
| 29 | 4591.27 | 4276.19491854758 | 315.075081452426 |
| 30 | 4696.96 | 4594.52882220330 | 102.431177796705 |
| 31 | 4621.4 | 4661.54320749053 | -40.1432074905315 |
| 32 | 4562.84 | 4540.83389690533 | 22.0061030946679 |
| 33 | 4202.52 | 4486.19422219638 | -283.674222196379 |
| 34 | 4296.49 | 4061.07982814156 | 235.410171858444 |
| 35 | 4435.23 | 4262.93714848790 | 172.292851512096 |
| 36 | 4105.18 | 4405.23831005201 | -300.058310052013 |
| 37 | 4116.68 | 3967.39700815453 | 149.282991845472 |
| 38 | 3844.49 | 4061.58100779029 | -217.091007790292 |
| 39 | 3720.98 | 3725.85654723919 | -4.87654723918963 |
| 40 | 3674.4 | 3641.6885161201 | 32.7114838798993 |
| 41 | 3857.62 | 3613.60851046717 | 244.01148953283 |
| 42 | 3801.06 | 3845.12544100918 | -44.0654410091757 |
| 43 | 3504.37 | 3728.03789606222 | -223.667896062218 |
| 44 | 3032.6 | 3379.6428364718 | -347.042836471801 |
| 45 | 3047.03 | 2890.38389121764 | 156.646108782362 |
| 46 | 2962.34 | 3012.24045130711 | -49.9004513071086 |
| 47 | 2197.82 | 2903.32956035166 | -705.509560351657 |
| 48 | 2014.45 | 1994.23280487980 | 20.2171951202023 |
| 49 | 1862.83 | 1972.25618949044 | -109.426189490438 |
| 50 | 1905.41 | 1831.70734814741 | 73.7026518525904 |
| 51 | 1810.99 | 1918.87807685284 | -107.888076852843 |
| 52 | 1670.07 | 1791.10187028600 | -121.031870285997 |
| 53 | 1864.44 | 1641.23905268952 | 223.200947310480 |
| 54 | 2052.02 | 1909.93814919888 | 142.081850801116 |
| 55 | 2029.6 | 2086.34118718066 | -56.7411871806635 |
| 56 | 2070.83 | 2009.59256823713 | 61.2374317628683 |
| 57 | 2293.41 | 2062.73505772963 | 230.674942270370 |
| 58 | 2443.27 | 2320.00529202033 | 123.264707979671 |
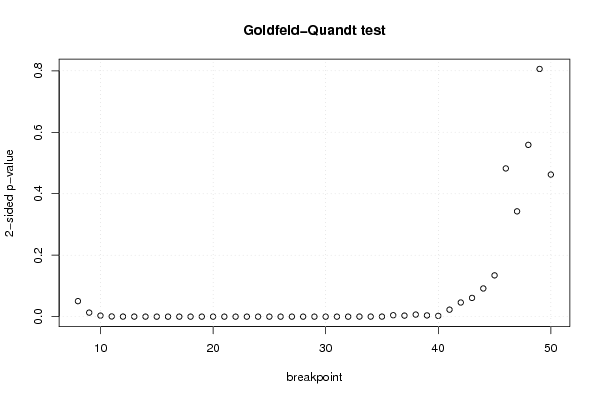
| Goldfeld-Quandt test for Heteroskedasticity | |||
| p-values | Alternative Hypothesis | ||
| breakpoint index | greater | 2-sided | less |
| 8 | 0.0252343081545159 | 0.0504686163090318 | 0.974765691845484 |
| 9 | 0.00656368250845884 | 0.0131273650169177 | 0.993436317491541 |
| 10 | 0.00166380128279802 | 0.00332760256559605 | 0.998336198717202 |
| 11 | 0.00033551430099687 | 0.00067102860199374 | 0.999664485699003 |
| 12 | 9.94039969136015e-05 | 0.000198807993827203 | 0.999900596003086 |
| 13 | 8.87730405038833e-05 | 0.000177546081007767 | 0.999911226959496 |
| 14 | 1.83271373831402e-05 | 3.66542747662804e-05 | 0.999981672862617 |
| 15 | 3.87007249306162e-06 | 7.74014498612324e-06 | 0.999996129927507 |
| 16 | 8.85036074456956e-07 | 1.77007214891391e-06 | 0.999999114963926 |
| 17 | 2.81652575828228e-07 | 5.63305151656455e-07 | 0.999999718347424 |
| 18 | 8.36061282742958e-08 | 1.67212256548592e-07 | 0.999999916393872 |
| 19 | 1.32731845468959e-07 | 2.65463690937917e-07 | 0.999999867268154 |
| 20 | 6.09986080470123e-08 | 1.21997216094025e-07 | 0.999999939001392 |
| 21 | 9.65616590253932e-08 | 1.93123318050786e-07 | 0.99999990343834 |
| 22 | 3.27885151841174e-08 | 6.55770303682348e-08 | 0.999999967211485 |
| 23 | 3.86834103249615e-08 | 7.7366820649923e-08 | 0.99999996131659 |
| 24 | 9.83309044968994e-09 | 1.96661808993799e-08 | 0.99999999016691 |
| 25 | 1.96536410661777e-08 | 3.93072821323555e-08 | 0.99999998034636 |
| 26 | 1.44420318442585e-07 | 2.8884063688517e-07 | 0.999999855579682 |
| 27 | 5.75952884216035e-08 | 1.15190576843207e-07 | 0.999999942404712 |
| 28 | 4.78530189974977e-08 | 9.57060379949955e-08 | 0.999999952146981 |
| 29 | 8.50853888702006e-06 | 1.70170777740401e-05 | 0.999991491461113 |
| 30 | 4.94201208278786e-06 | 9.88402416557571e-06 | 0.999995057987917 |
| 31 | 2.04659715280308e-06 | 4.09319430560616e-06 | 0.999997953402847 |
| 32 | 7.36716771532692e-07 | 1.47343354306538e-06 | 0.999999263283228 |
| 33 | 0.000113982665160248 | 0.000227965330320495 | 0.99988601733484 |
| 34 | 8.6135049290247e-05 | 0.000172270098580494 | 0.99991386495071 |
| 35 | 8.46750682219367e-05 | 0.000169350136443873 | 0.999915324931778 |
| 36 | 0.00232037279934471 | 0.00464074559868942 | 0.997679627200655 |
| 37 | 0.00169233333964721 | 0.00338466667929442 | 0.998307666660353 |
| 38 | 0.00337692732193543 | 0.00675385464387087 | 0.996623072678064 |
| 39 | 0.00200072596466625 | 0.00400145192933250 | 0.997999274035334 |
| 40 | 0.00127840572456559 | 0.00255681144913119 | 0.998721594275434 |
| 41 | 0.0113589525210454 | 0.0227179050420909 | 0.988641047478955 |
| 42 | 0.0230178572558169 | 0.0460357145116339 | 0.976982142744183 |
| 43 | 0.0304533357676292 | 0.0609066715352584 | 0.96954666423237 |
| 44 | 0.0458646419024157 | 0.0917292838048314 | 0.954135358097584 |
| 45 | 0.0671960792496803 | 0.134392158499361 | 0.93280392075032 |
| 46 | 0.758823994072697 | 0.482352011854607 | 0.241176005927303 |
| 47 | 0.828669162538752 | 0.342661674922496 | 0.171330837461248 |
| 48 | 0.720514667027303 | 0.558970665945395 | 0.279485332972697 |
| 49 | 0.59699426609762 | 0.80601146780476 | 0.40300573390238 |
| 50 | 0.768820456703445 | 0.46235908659311 | 0.231179543296555 |
| Meta Analysis of Goldfeld-Quandt test for Heteroskedasticity | |||
| Description | # significant tests | % significant tests | OK/NOK |
| 1% type I error level | 31 | 0.72093023255814 | NOK |
| 5% type I error level | 34 | 0.790697674418605 | NOK |
| 10% type I error level | 37 | 0.86046511627907 | NOK |