| Multiple Linear Regression - Estimated Regression Equation |
| Y[t] = + 9387.4473706367 -0.208349443842813X[t] + 129.516229799319M1[t] -556.032767060951M2[t] + 383.208337781761M3[t] + 148.071092904942M4[t] + 536.948383907607M5[t] + 686.295868512073M6[t] + 1256.28633537861M7[t] + 1249.82740380037M8[t] + 946.679869485758M9[t] + 487.085170332202M10[t] -533.952818160934M11[t] + 19.6360507434562t + e[t] |
| Multiple Linear Regression - Ordinary Least Squares | |||||
| Variable | Parameter | S.D. | T-STAT H0: parameter = 0 | 2-tail p-value | 1-tail p-value |
| (Intercept) | 9387.4473706367 | 248.828986 | 37.7265 | 0 | 0 |
| X | -0.208349443842813 | 0.106474 | -1.9568 | 0.056456 | 0.028228 |
| M1 | 129.516229799319 | 169.928878 | 0.7622 | 0.449844 | 0.224922 |
| M2 | -556.032767060951 | 148.61417 | -3.7415 | 0.000506 | 0.000253 |
| M3 | 383.208337781761 | 148.740468 | 2.5764 | 0.01326 | 0.00663 |
| M4 | 148.071092904942 | 185.679248 | 0.7975 | 0.429283 | 0.214642 |
| M5 | 536.948383907607 | 294.309868 | 1.8244 | 0.074586 | 0.037293 |
| M6 | 686.295868512073 | 343.500351 | 1.9979 | 0.051655 | 0.025827 |
| M7 | 1256.28633537861 | 351.850852 | 3.5705 | 0.000848 | 0.000424 |
| M8 | 1249.82740380037 | 414.822958 | 3.0129 | 0.004197 | 0.002099 |
| M9 | 946.679869485758 | 344.252864 | 2.75 | 0.008492 | 0.004246 |
| M10 | 487.085170332202 | 171.74094 | 2.8362 | 0.006766 | 0.003383 |
| M11 | -533.952818160934 | 151.818432 | -3.517 | 0.000994 | 0.000497 |
| t | 19.6360507434562 | 1.925746 | 10.1966 | 0 | 0 |
| Multiple Linear Regression - Regression Statistics | |
| Multiple R | 0.917773465845367 |
| R-squared | 0.842308134609817 |
| Adjusted R-squared | 0.797743042216939 |
| F-TEST (value) | 18.9006257898936 |
| F-TEST (DF numerator) | 13 |
| F-TEST (DF denominator) | 46 |
| p-value | 3.16413562018170e-14 |
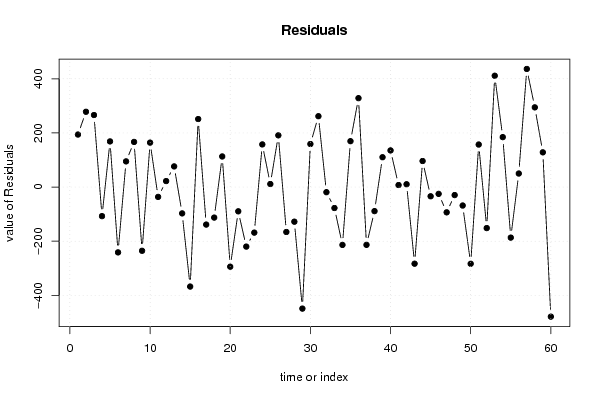
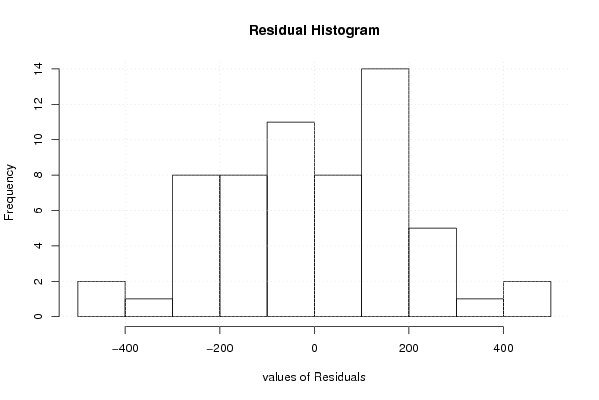
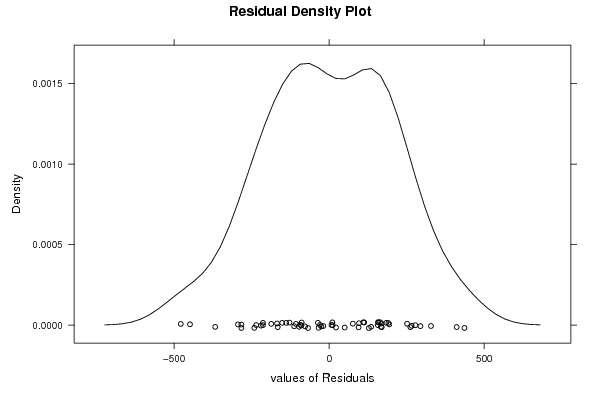
| Multiple Linear Regression - Residual Statistics | |
| Residual Standard Deviation | 233.245923115510 |
| Sum Squared Residuals | 2502568.3899003 |
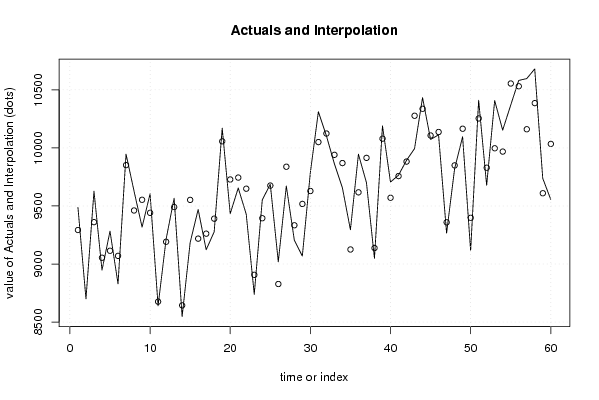
| Multiple Linear Regression - Actuals, Interpolation, and Residuals | |||
| Time or Index | Actuals | Interpolation Forecast | Residuals Prediction Error |
| 1 | 9487 | 9293.0391513272 | 193.960848672802 |
| 2 | 8700 | 8421.90200302524 | 278.097996974755 |
| 3 | 9627 | 9360.98596144635 | 266.014038553654 |
| 4 | 8947 | 9054.22771090983 | -107.227710909832 |
| 5 | 9283 | 9114.38078255077 | 168.619217449232 |
| 6 | 8829 | 9070.2228368475 | -241.222836847493 |
| 7 | 9947 | 9852.1558911244 | 94.8441088755972 |
| 8 | 9628 | 9461.3434386784 | 166.656561321594 |
| 9 | 9318 | 9553.277652912 | -235.277652911996 |
| 10 | 9605 | 9440.8443302228 | 164.1556697772 |
| 11 | 8640 | 8676.3357101224 | -36.3357101223976 |
| 12 | 9214 | 9191.79663080355 | 22.2033691964461 |
| 13 | 9567 | 9490.75216146931 | 76.2478385306889 |
| 14 | 8547 | 8644.20024754078 | -97.2002475407793 |
| 15 | 9185 | 9552.44848827314 | -367.448488273143 |
| 16 | 9470 | 9218.8131594809 | 251.186840519094 |
| 17 | 9123 | 9261.46487783905 | -138.464877839047 |
| 18 | 9278 | 9390.653669413 | -112.653669412992 |
| 19 | 10170 | 10056.9527823571 | 113.04721764286 |
| 20 | 9434 | 9728.02011473246 | -294.020114732459 |
| 21 | 9655 | 9744.53183029495 | -89.5318302949524 |
| 22 | 9429 | 9648.76646311318 | -219.76646311318 |
| 23 | 8739 | 8907.17628183549 | -168.176281835487 |
| 24 | 9552 | 9394.51002759786 | 157.489972402137 |
| 25 | 9687 | 9675.75585553698 | 11.2441444630183 |
| 26 | 9019 | 8827.9538449454 | 191.046155054608 |
| 27 | 9672 | 9837.87661427305 | -165.87661427305 |
| 28 | 9206 | 9333.8114404174 | -127.811440417392 |
| 29 | 9069 | 9517.72408170096 | -448.72408170096 |
| 30 | 9788 | 9628.99482110442 | 159.005178895577 |
| 31 | 10312 | 10050.2749880894 | 261.725011910577 |
| 32 | 10105 | 10123.8734459691 | -18.8734459690554 |
| 33 | 9863 | 9940.36969544245 | -77.3696954424489 |
| 34 | 9656 | 9869.60626152181 | -213.606261521814 |
| 35 | 9295 | 9125.515886918 | 169.484113081992 |
| 36 | 9946 | 9617.64166988877 | 328.358330111231 |
| 37 | 9701 | 9914.30535667226 | -213.305356672255 |
| 38 | 9049 | 9137.7588558749 | -88.7588558749075 |
| 39 | 10190 | 10079.7597065098 | 110.240293490192 |
| 40 | 9706 | 9570.69414600192 | 135.305853998078 |
| 41 | 9765 | 9757.5236794993 | 7.47632050070986 |
| 42 | 9893 | 9882.54548219638 | 10.4545178036213 |
| 43 | 9994 | 10276.9485709257 | -282.948570925656 |
| 44 | 10433 | 10336.7959655117 | 96.204034488337 |
| 45 | 10073 | 10107.0386384520 | -34.0386384519522 |
| 46 | 10112 | 10137.1163353512 | -25.1163353512387 |
| 47 | 9266 | 9359.2733508449 | -93.2733508448967 |
| 48 | 9820 | 9849.52398882107 | -29.523988821072 |
| 49 | 10097 | 10165.1474749943 | -68.1474749942544 |
| 50 | 9115 | 9398.18504861368 | -283.185048613676 |
| 51 | 10411 | 10253.9292294977 | 157.070770502348 |
| 52 | 9678 | 9829.45354318995 | -151.453543189949 |
| 53 | 10408 | 9996.90657840993 | 411.093421590065 |
| 54 | 10153 | 9968.58319043871 | 184.416809561287 |
| 55 | 10368 | 10554.6677675034 | -186.667767503378 |
| 56 | 10581 | 10530.9670351084 | 50.032964891583 |
| 57 | 10597 | 10160.7821828987 | 436.217817101349 |
| 58 | 10680 | 10385.6666097910 | 294.333390209033 |
| 59 | 9738 | 9609.69877027921 | 128.301229720790 |
| 60 | 9556 | 10034.5276828887 | -478.527682888742 |
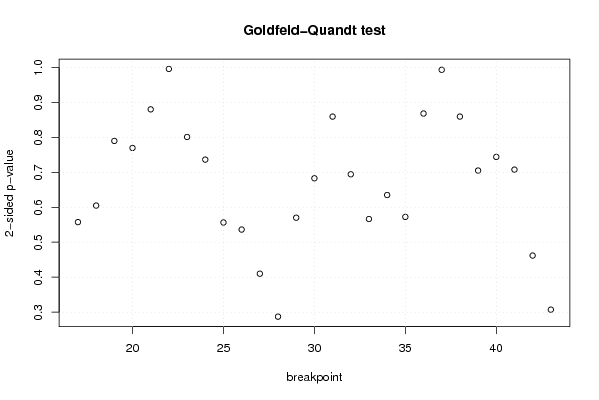
| Goldfeld-Quandt test for Heteroskedasticity | |||
| p-values | Alternative Hypothesis | ||
| breakpoint index | greater | 2-sided | less |
| 17 | 0.721197820278868 | 0.557604359442264 | 0.278802179721132 |
| 18 | 0.697573611594279 | 0.604852776811442 | 0.302426388405721 |
| 19 | 0.605192444732662 | 0.789615110534676 | 0.394807555267338 |
| 20 | 0.615244038713369 | 0.769511922573262 | 0.384755961286631 |
| 21 | 0.560084757655123 | 0.879830484689753 | 0.439915242344877 |
| 22 | 0.497661938619243 | 0.995323877238487 | 0.502338061380757 |
| 23 | 0.40044309303713 | 0.80088618607426 | 0.59955690696287 |
| 24 | 0.368110104587685 | 0.73622020917537 | 0.631889895412315 |
| 25 | 0.278221658199597 | 0.556443316399195 | 0.721778341800403 |
| 26 | 0.268122614864691 | 0.536245229729383 | 0.731877385135309 |
| 27 | 0.205005895960106 | 0.410011791920212 | 0.794994104039894 |
| 28 | 0.143653282783491 | 0.287306565566981 | 0.85634671721651 |
| 29 | 0.285061061878549 | 0.570122123757098 | 0.714938938121451 |
| 30 | 0.341406363551338 | 0.682812727102677 | 0.658593636448662 |
| 31 | 0.42954298276571 | 0.85908596553142 | 0.57045701723429 |
| 32 | 0.347116607666212 | 0.694233215332424 | 0.652883392333788 |
| 33 | 0.283182617428917 | 0.566365234857833 | 0.716817382571084 |
| 34 | 0.317502443722642 | 0.635004887445284 | 0.682497556277358 |
| 35 | 0.286240006158942 | 0.572480012317884 | 0.713759993841058 |
| 36 | 0.566072996435624 | 0.867854007128753 | 0.433927003564376 |
| 37 | 0.496465896149105 | 0.99293179229821 | 0.503534103850895 |
| 38 | 0.42957046024808 | 0.85914092049616 | 0.57042953975192 |
| 39 | 0.352487042267325 | 0.70497408453465 | 0.647512957732675 |
| 40 | 0.371943302531563 | 0.743886605063125 | 0.628056697468437 |
| 41 | 0.353778179645111 | 0.707556359290221 | 0.64622182035489 |
| 42 | 0.230958296836677 | 0.461916593673353 | 0.769041703163323 |
| 43 | 0.153630787491261 | 0.307261574982522 | 0.84636921250874 |
| Meta Analysis of Goldfeld-Quandt test for Heteroskedasticity | |||
| Description | # significant tests | % significant tests | OK/NOK |
| 1% type I error level | 0 | 0 | OK |
| 5% type I error level | 0 | 0 | OK |
| 10% type I error level | 0 | 0 | OK |