| Multiple Linear Regression - Estimated Regression Equation |
| Y[t] = + 9128.86904445696 + 0.213587516625750X[t] + 271.322214098642M1[t] -710.28396584075M2[t] + 192.138024434725M3[t] -428.591426532646M4[t] -587.75207140093M5[t] -642.310737709253M6[t] -92.4306817753984M7[t] -353.006262562185M8[t] -335.761080711350M9[t] + 105.537806513191M10[t] -408.611329287392M11[t] + e[t] |
| Multiple Linear Regression - Ordinary Least Squares | |||||
| Variable | Parameter | S.D. | T-STAT H0: parameter = 0 | 2-tail p-value | 1-tail p-value |
| (Intercept) | 9128.86904445696 | 442.168472 | 20.6457 | 0 | 0 |
| X | 0.213587516625750 | 0.175243 | 1.2188 | 0.229 | 0.1145 |
| M1 | 271.322214098642 | 302.525411 | 0.8969 | 0.374366 | 0.187183 |
| M2 | -710.28396584075 | 264.090333 | -2.6895 | 0.009872 | 0.004936 |
| M3 | 192.138024434725 | 263.57794 | 0.729 | 0.469643 | 0.234821 |
| M4 | -428.591426532646 | 315.919282 | -1.3566 | 0.181374 | 0.090687 |
| M5 | -587.75207140093 | 487.407022 | -1.2059 | 0.233901 | 0.116951 |
| M6 | -642.310737709253 | 567.73567 | -1.1314 | 0.263645 | 0.131823 |
| M7 | -92.4306817753984 | 582.408115 | -0.1587 | 0.874582 | 0.437291 |
| M8 | -353.006262562185 | 685.734879 | -0.5148 | 0.609116 | 0.304558 |
| M9 | -335.761080711350 | 572.428687 | -0.5866 | 0.560309 | 0.280155 |
| M10 | 105.537806513191 | 299.410264 | 0.3525 | 0.72605 | 0.363025 |
| M11 | -408.611329287392 | 270.302608 | -1.5117 | 0.13731 | 0.068655 |
| Multiple Linear Regression - Regression Statistics | |
| Multiple R | 0.697057008729458 |
| R-squared | 0.48588847341886 |
| Adjusted R-squared | 0.354625955993888 |
| F-TEST (value) | 3.70165438657374 |
| F-TEST (DF numerator) | 12 |
| F-TEST (DF denominator) | 47 |
| p-value | 0.000596500404973055 |
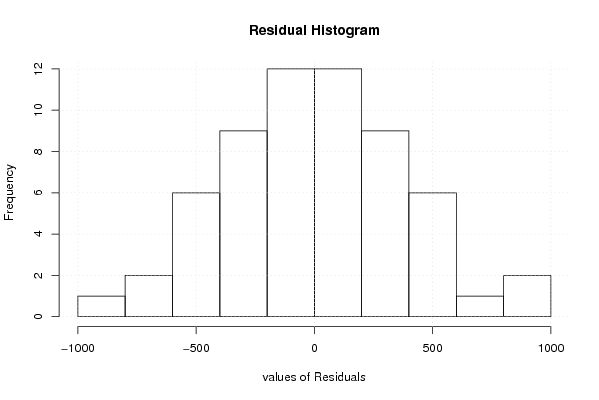
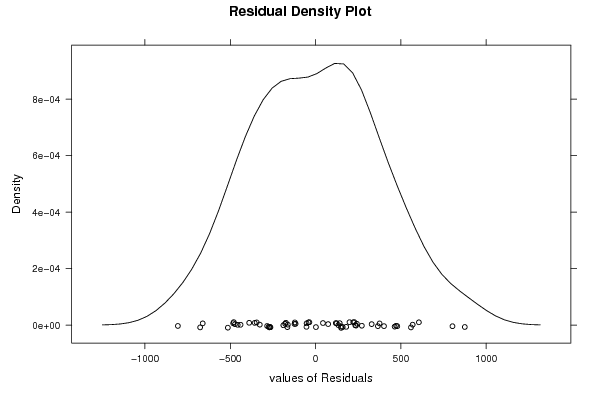
| Multiple Linear Regression - Residual Statistics | |
| Residual Standard Deviation | 416.646822002174 |
| Sum Squared Residuals | 8158944.99137204 |
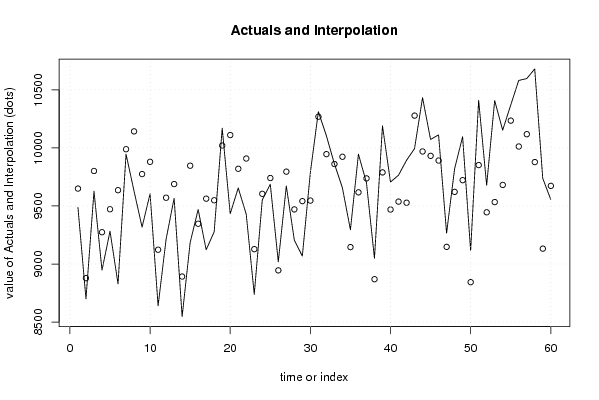
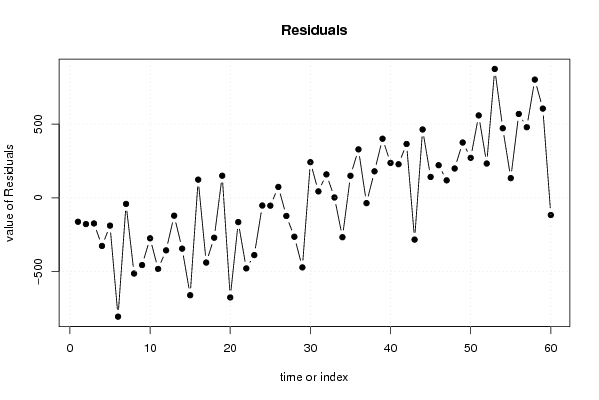
| Multiple Linear Regression - Actuals, Interpolation, and Residuals | |||
| Time or Index | Actuals | Interpolation Forecast | Residuals Prediction Error |
| 1 | 9487 | 9649.87506549107 | -162.875065491074 |
| 2 | 8700 | 8878.65258942807 | -178.652589428074 |
| 3 | 9627 | 9801.365393783 | -174.365393782995 |
| 4 | 8947 | 9274.1872750977 | -327.187275097703 |
| 5 | 9283 | 9472.14495802767 | -189.144958027674 |
| 6 | 8829 | 9636.0863212275 | -807.086321227493 |
| 7 | 9947 | 9988.82509931578 | -41.8250993157801 |
| 8 | 9628 | 10142.3957132663 | -514.395713266323 |
| 9 | 9318 | 9774.75619015756 | -456.756190157556 |
| 10 | 9605 | 9880.29550124642 | -275.295501246418 |
| 11 | 8640 | 9123.29735904236 | -483.297359042357 |
| 12 | 9214 | 9570.99520387226 | -356.995203872261 |
| 13 | 9567 | 9688.7479935170 | -121.747993516989 |
| 14 | 8547 | 8892.32219049212 | -345.322190492122 |
| 15 | 9185 | 9846.64594730765 | -661.645947307654 |
| 16 | 9470 | 9347.02061826708 | 122.979381732916 |
| 17 | 9123 | 9562.91965259362 | -439.919652593617 |
| 18 | 9278 | 9549.15620196081 | -271.156201960813 |
| 19 | 10170 | 10020.4360517764 | 149.563948223609 |
| 20 | 9434 | 10110.5711732891 | -676.571173289086 |
| 21 | 9655 | 9820.25033119884 | -165.250331198841 |
| 22 | 9429 | 9908.70264095764 | -479.702640957643 |
| 23 | 8739 | 9128.20987192475 | -389.209871924749 |
| 24 | 9552 | 9604.74203149913 | -52.7420314991297 |
| 25 | 9687 | 9740.64976005705 | -53.6497600570461 |
| 26 | 9019 | 8945.50548213193 | 73.4945178680658 |
| 27 | 9672 | 9795.5985308341 | -123.598530834100 |
| 28 | 9206 | 9470.6877903934 | -264.687790393394 |
| 29 | 9069 | 9541.77448844767 | -472.774488447668 |
| 30 | 9788 | 9546.37956424468 | 241.620435755322 |
| 31 | 10312 | 10268.8383336121 | 43.1616663878614 |
| 32 | 10105 | 9946.32237300388 | 158.677626996116 |
| 33 | 9863 | 9861.04554687436 | 1.95445312564103 |
| 34 | 9656 | 9923.86735463807 | -267.867354638071 |
| 35 | 9295 | 9145.93763580469 | 149.062364195314 |
| 36 | 9946 | 9617.55728249667 | 328.442717503325 |
| 37 | 9701 | 9737.65953482429 | -36.6595348242857 |
| 38 | 9049 | 8869.46832621317 | 179.531673786833 |
| 39 | 10190 | 9789.19090533533 | 400.809094664673 |
| 40 | 9706 | 9469.40626529364 | 236.593734706361 |
| 41 | 9765 | 9537.50273811515 | 227.497261884847 |
| 42 | 9893 | 9528.01103781486 | 364.988962185137 |
| 43 | 9994 | 10278.0225968270 | -284.022596827046 |
| 44 | 10433 | 9969.6034123161 | 463.396587683909 |
| 45 | 10073 | 9931.74301487748 | 141.256985122518 |
| 46 | 10112 | 9891.18846459433 | 220.811535405668 |
| 47 | 9266 | 9147.85992345432 | 118.140076545682 |
| 48 | 9820 | 9621.40185779594 | 198.598142204062 |
| 49 | 10097 | 9722.0676461106 | 374.932353889394 |
| 50 | 9115 | 8844.0514117347 | 270.948588265297 |
| 51 | 10411 | 9852.19922273992 | 558.800777260076 |
| 52 | 9678 | 9445.69805094818 | 232.301949051819 |
| 53 | 10408 | 9533.6581628159 | 874.34183718411 |
| 54 | 10153 | 9681.36687475215 | 471.633125247848 |
| 55 | 10368 | 10234.8779184686 | 133.122081531356 |
| 56 | 10581 | 10012.1073281246 | 568.892671875385 |
| 57 | 10597 | 10118.2049168918 | 478.795083108238 |
| 58 | 10680 | 9877.94603856354 | 802.053961436465 |
| 59 | 9738 | 9132.69520977389 | 605.30479022611 |
| 60 | 9556 | 9673.303624336 | -117.303624335996 |
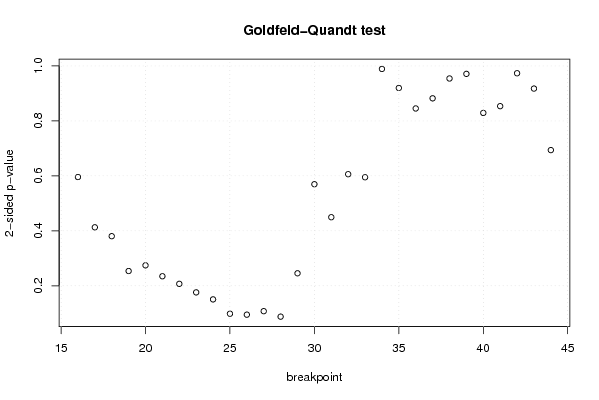
| Goldfeld-Quandt test for Heteroskedasticity | |||
| p-values | Alternative Hypothesis | ||
| breakpoint index | greater | 2-sided | less |
| 16 | 0.297866954263022 | 0.595733908526043 | 0.702133045736978 |
| 17 | 0.206405991838846 | 0.412811983677692 | 0.793594008161154 |
| 18 | 0.190242652887006 | 0.380485305774012 | 0.809757347112994 |
| 19 | 0.126845161254860 | 0.253690322509721 | 0.87315483874514 |
| 20 | 0.13726200146111 | 0.27452400292222 | 0.86273799853889 |
| 21 | 0.117361863893614 | 0.234723727787228 | 0.882638136106386 |
| 22 | 0.103562497899591 | 0.207124995799181 | 0.89643750210041 |
| 23 | 0.0880303104802777 | 0.176060620960555 | 0.911969689519722 |
| 24 | 0.0752818391624606 | 0.150563678324921 | 0.92471816083754 |
| 25 | 0.0491912430752624 | 0.0983824861505248 | 0.950808756924738 |
| 26 | 0.0474824705389019 | 0.0949649410778038 | 0.952517529461098 |
| 27 | 0.0538254956110305 | 0.107650991222061 | 0.94617450438897 |
| 28 | 0.0438750746339446 | 0.0877501492678892 | 0.956124925366055 |
| 29 | 0.122753338494420 | 0.245506676988839 | 0.87724666150558 |
| 30 | 0.284787974060412 | 0.569575948120823 | 0.715212025939588 |
| 31 | 0.224754429159455 | 0.449508858318911 | 0.775245570840545 |
| 32 | 0.303017358585395 | 0.60603471717079 | 0.696982641414605 |
| 33 | 0.297482324022435 | 0.59496464804487 | 0.702517675977565 |
| 34 | 0.494497240554337 | 0.988994481108673 | 0.505502759445663 |
| 35 | 0.540136075962006 | 0.919727848075988 | 0.459863924037994 |
| 36 | 0.577373847681587 | 0.845252304636826 | 0.422626152318413 |
| 37 | 0.558945010059005 | 0.88210997988199 | 0.441054989940996 |
| 38 | 0.477153181118847 | 0.954306362237693 | 0.522846818881153 |
| 39 | 0.48554012989518 | 0.97108025979036 | 0.51445987010482 |
| 40 | 0.414512044111328 | 0.829024088222656 | 0.585487955888672 |
| 41 | 0.573208547410865 | 0.85358290517827 | 0.426791452589135 |
| 42 | 0.486670822421124 | 0.973341644842248 | 0.513329177578876 |
| 43 | 0.458796564482613 | 0.917593128965226 | 0.541203435517387 |
| 44 | 0.346891288375522 | 0.693782576751044 | 0.653108711624478 |
| Meta Analysis of Goldfeld-Quandt test for Heteroskedasticity | |||
| Description | # significant tests | % significant tests | OK/NOK |
| 1% type I error level | 0 | 0 | OK |
| 5% type I error level | 0 | 0 | OK |
| 10% type I error level | 3 | 0.103448275862069 | NOK |