| Multiple Linear Regression - Estimated Regression Equation |
| In_IEU[t] = + 9.33769007937115e-13 + 6.08020428710746e-16Uit_IEU[t] + 1`Yt-1`[t] -3.41313721623565e-17`Yt-2`[t] + 5.63140213847878e-17`Yt-3`[t] -1.54334763119424e-17`Yt-4`[t] -5.14745364092699e-14M1[t] -5.59444995553869e-14M2[t] + 2.95547134569282e-13M3[t] + 3.65302175293353e-14M4[t] + 5.83751278725918e-14M5[t] -9.64817250070245e-14M6[t] + 2.90609718457503e-14M7[t] + 4.92318432510924e-14M8[t] -8.81005101561148e-14M9[t] + 1.13199821482918e-14M10[t] + 4.89132576919884e-14M11[t] -1.69914286080596e-15t + e[t] |
| Multiple Linear Regression - Ordinary Least Squares | |||||
| Variable | Parameter | S.D. | T-STAT H0: parameter = 0 | 2-tail p-value | 1-tail p-value |
| (Intercept) | 9.33769007937115e-13 | 0 | 2.2666 | 0.02919 | 0.014595 |
| Uit_IEU | 6.08020428710746e-16 | 0 | 5.821 | 1e-06 | 1e-06 |
| `Yt-1` | 1 | 0 | 9364916267901080 | 0 | 0 |
| `Yt-2` | -3.41313721623565e-17 | 0 | -0.8885 | 0.379848 | 0.189924 |
| `Yt-3` | 5.63140213847878e-17 | 0 | 1.4331 | 0.159998 | 0.079999 |
| `Yt-4` | -1.54334763119424e-17 | 0 | -0.3978 | 0.692975 | 0.346487 |
| M1 | -5.14745364092699e-14 | 0 | -0.2464 | 0.806725 | 0.403363 |
| M2 | -5.59444995553869e-14 | 0 | -0.3252 | 0.746844 | 0.373422 |
| M3 | 2.95547134569282e-13 | 0 | 1.6831 | 0.100563 | 0.050282 |
| M4 | 3.65302175293353e-14 | 0 | 0.2127 | 0.832723 | 0.416362 |
| M5 | 5.83751278725918e-14 | 0 | 0.3855 | 0.702028 | 0.351014 |
| M6 | -9.64817250070245e-14 | 0 | -0.6315 | 0.53152 | 0.26576 |
| M7 | 2.90609718457503e-14 | 0 | 0.1556 | 0.877136 | 0.438568 |
| M8 | 4.92318432510924e-14 | 0 | 0.3121 | 0.756663 | 0.378331 |
| M9 | -8.81005101561148e-14 | 0 | -0.4553 | 0.651481 | 0.32574 |
| M10 | 1.13199821482918e-14 | 0 | 0.0539 | 0.957282 | 0.478641 |
| M11 | 4.89132576919884e-14 | 0 | 0.2889 | 0.774258 | 0.387129 |
| t | -1.69914286080596e-15 | 0 | -0.737 | 0.465657 | 0.232829 |
| Multiple Linear Regression - Regression Statistics | |
| Multiple R | 1 |
| R-squared | 1 |
| Adjusted R-squared | 1 |
| F-TEST (value) | 2.00609417868962e+32 |
| F-TEST (DF numerator) | 17 |
| F-TEST (DF denominator) | 38 |
| p-value | 0 |
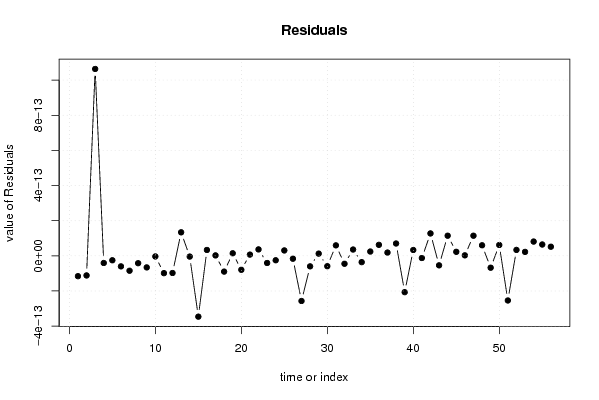
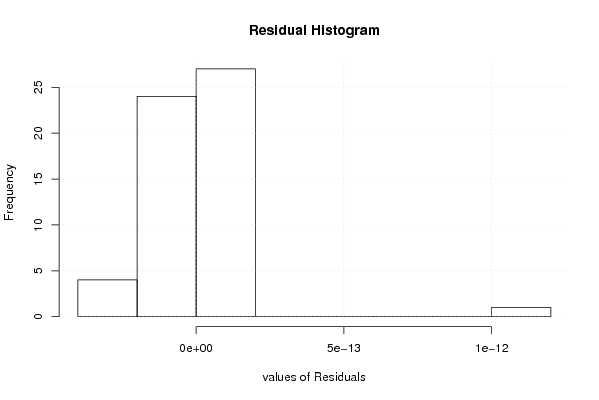
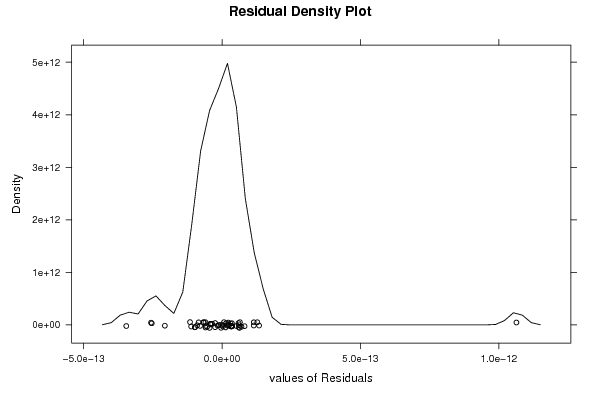
| Multiple Linear Regression - Residual Statistics | |
| Residual Standard Deviation | 2.06882713278502e-13 |
| Sum Squared Residuals | 1.62641736803205e-24 |
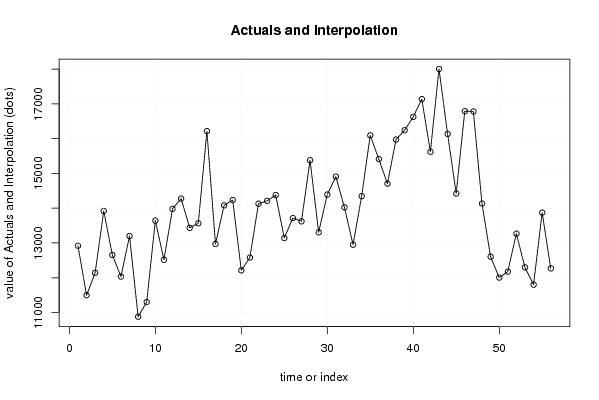
| Multiple Linear Regression - Actuals, Interpolation, and Residuals | |||
| Time or Index | Actuals | Interpolation Forecast | Residuals Prediction Error |
| 1 | 12919.9 | 12919.9 | -1.15687740511203e-13 |
| 2 | 11497.3 | 11497.3 | -1.11571156397268e-13 |
| 3 | 12142 | 12142 | 1.06359826058060e-12 |
| 4 | 13919.4 | 13919.4 | -4.05993368457645e-14 |
| 5 | 12656.8 | 12656.8 | -2.51774014860363e-14 |
| 6 | 12034.1 | 12034.1 | -6.00121655853554e-14 |
| 7 | 13199.7 | 13199.7 | -8.46927260993712e-14 |
| 8 | 10881.3 | 10881.3 | -4.19424696724649e-14 |
| 9 | 11301.2 | 11301.2 | -6.58784157846455e-14 |
| 10 | 13643.9 | 13643.9 | -3.45907733778767e-15 |
| 11 | 12517 | 12517 | -9.84696567476705e-14 |
| 12 | 13981.1 | 13981.1 | -9.75045326013207e-14 |
| 13 | 14275.7 | 14275.7 | 1.33839947854674e-13 |
| 14 | 13435 | 13435 | -4.15601283799536e-15 |
| 15 | 13565.7 | 13565.7 | -3.46093314443156e-13 |
| 16 | 16216.3 | 16216.3 | 3.33844272443606e-14 |
| 17 | 12970 | 12970 | 2.49179536106758e-15 |
| 18 | 14079.9 | 14079.9 | -8.97259012924684e-14 |
| 19 | 14235 | 14235 | 1.45411498973402e-14 |
| 20 | 12213.4 | 12213.4 | -7.94746923257248e-14 |
| 21 | 12581 | 12581 | 7.04527599489535e-15 |
| 22 | 14130.4 | 14130.4 | 3.65401126113927e-14 |
| 23 | 14210.8 | 14210.8 | -4.0638454214342e-14 |
| 24 | 14378.5 | 14378.5 | -2.51741352550464e-14 |
| 25 | 13142.8 | 13142.8 | 3.06953214359383e-14 |
| 26 | 13714.7 | 13714.7 | -1.62655978882567e-14 |
| 27 | 13621.9 | 13621.9 | -2.56787644647873e-13 |
| 28 | 15379.8 | 15379.8 | -5.98501993942027e-14 |
| 29 | 13306.3 | 13306.3 | 1.26737341014917e-14 |
| 30 | 14391.2 | 14391.2 | -5.89634485458661e-14 |
| 31 | 14909.9 | 14909.9 | 5.96286946024191e-14 |
| 32 | 14025.4 | 14025.4 | -4.51323340448021e-14 |
| 33 | 12951.2 | 12951.2 | 3.588482180933e-14 |
| 34 | 14344.3 | 14344.3 | -3.59044682020389e-14 |
| 35 | 16093.4 | 16093.4 | 2.45345201397967e-14 |
| 36 | 15413.6 | 15413.6 | 6.26302591948495e-14 |
| 37 | 14705.7 | 14705.7 | 1.86638903115609e-14 |
| 38 | 15972.8 | 15972.8 | 7.02227226804949e-14 |
| 39 | 16241.4 | 16241.4 | -2.06731654273643e-13 |
| 40 | 16626.4 | 16626.4 | 3.33149325249005e-14 |
| 41 | 17136.2 | 17136.2 | -1.23990543922619e-14 |
| 42 | 15622.9 | 15622.9 | 1.27456892173898e-13 |
| 43 | 18003.9 | 18003.9 | -5.39988983066923e-14 |
| 44 | 16136.1 | 16136.1 | 1.14635179935757e-13 |
| 45 | 14423.7 | 14423.7 | 2.29483179804199e-14 |
| 46 | 16789.4 | 16789.4 | 2.82343292843405e-15 |
| 47 | 16782.2 | 16782.2 | 1.14573590822216e-13 |
| 48 | 14133.8 | 14133.8 | 6.00484086615178e-14 |
| 49 | 12607 | 12607 | -6.75114190909698e-14 |
| 50 | 12004.5 | 12004.5 | 6.17700444430254e-14 |
| 51 | 12175.4 | 12175.4 | -2.53985647215925e-13 |
| 52 | 13268 | 13268 | 3.37501764707062e-14 |
| 53 | 12299.3 | 12299.3 | 2.24109264157388e-14 |
| 54 | 11800.6 | 11800.6 | 8.12446232497919e-14 |
| 55 | 13873.3 | 13873.3 | 6.45217799063042e-14 |
| 56 | 12269.6 | 12269.6 | 5.19143161072346e-14 |
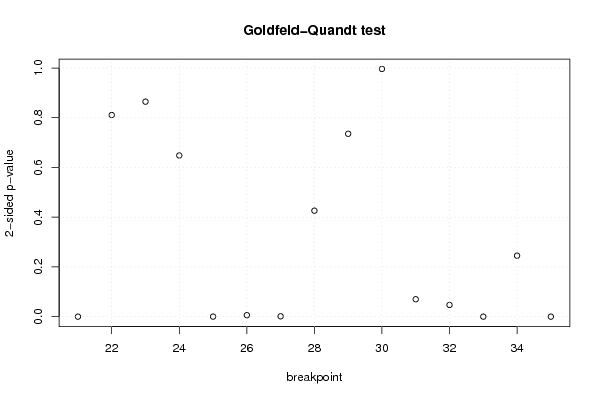
| Goldfeld-Quandt test for Heteroskedasticity | |||
| p-values | Alternative Hypothesis | ||
| breakpoint index | greater | 2-sided | less |
| 21 | 0.999999244687085 | 1.51062582947339e-06 | 7.55312914736697e-07 |
| 22 | 0.405428953870852 | 0.810857907741704 | 0.594571046129148 |
| 23 | 0.432307184198012 | 0.864614368396025 | 0.567692815801988 |
| 24 | 0.324098188664894 | 0.648196377329788 | 0.675901811335106 |
| 25 | 0.9999055373173 | 0.000188925365399688 | 9.44626826998439e-05 |
| 26 | 0.997067272343084 | 0.00586545531383273 | 0.00293272765691636 |
| 27 | 0.999306647832956 | 0.00138670433408823 | 0.000693352167044117 |
| 28 | 0.213104414250848 | 0.426208828501696 | 0.786895585749152 |
| 29 | 0.632289633009002 | 0.735420733981995 | 0.367710366990998 |
| 30 | 0.501892466048736 | 0.996215067902528 | 0.498107533951264 |
| 31 | 0.964981201271688 | 0.070037597456624 | 0.035018798728312 |
| 32 | 0.0235333089142237 | 0.0470666178284474 | 0.976466691085776 |
| 33 | 1 | 0 | 0 |
| 34 | 0.87738602648395 | 0.245227947032098 | 0.122613973516049 |
| 35 | 1 | 0 | 0 |
| Meta Analysis of Goldfeld-Quandt test for Heteroskedasticity | |||
| Description | # significant tests | % significant tests | OK/NOK |
| 1% type I error level | 6 | 0.4 | NOK |
| 5% type I error level | 7 | 0.466666666666667 | NOK |
| 10% type I error level | 8 | 0.533333333333333 | NOK |