| Multiple Linear Regression - Estimated Regression Equation |
| In_IEU[t] = -1635.22504557635 + 1.03943856780702Uit_IEU[t] + 740.557383587982M1[t] -145.111303853829M2[t] -351.020823840440M3[t] -32.611497252725M4[t] + 1167.19484531337M5[t] + 83.2395019644493M6[t] + 290.322167129069M7[t] + 235.841552106109M8[t] -17.9343189263537M9[t] -22.0519148000427M10[t] -142.433773462613M11[t] + 11.9322542827837t + e[t] |
| Multiple Linear Regression - Ordinary Least Squares | |||||
| Variable | Parameter | S.D. | T-STAT H0: parameter = 0 | 2-tail p-value | 1-tail p-value |
| (Intercept) | -1635.22504557635 | 504.143869 | -3.2436 | 0.002201 | 0.001101 |
| Uit_IEU | 1.03943856780702 | 0.03671 | 28.3146 | 0 | 0 |
| M1 | 740.557383587982 | 227.168341 | 3.2599 | 0.002101 | 0.00105 |
| M2 | -145.111303853829 | 231.786449 | -0.6261 | 0.534373 | 0.267186 |
| M3 | -351.020823840440 | 234.349808 | -1.4978 | 0.141004 | 0.070502 |
| M4 | -32.611497252725 | 227.675438 | -0.1432 | 0.886729 | 0.443364 |
| M5 | 1167.19484531337 | 223.458312 | 5.2233 | 4e-06 | 2e-06 |
| M6 | 83.2395019644493 | 223.060105 | 0.3732 | 0.710736 | 0.355368 |
| M7 | 290.322167129069 | 222.836866 | 1.3028 | 0.199112 | 0.099556 |
| M8 | 235.841552106109 | 232.267613 | 1.0154 | 0.315232 | 0.157616 |
| M9 | -17.9343189263537 | 223.626566 | -0.0802 | 0.936428 | 0.468214 |
| M10 | -22.0519148000427 | 223.09909 | -0.0988 | 0.921692 | 0.460846 |
| M11 | -142.433773462613 | 232.23903 | -0.6133 | 0.542694 | 0.271347 |
| t | 11.9322542827837 | 2.853347 | 4.1818 | 0.000128 | 6.4e-05 |
| Multiple Linear Regression - Regression Statistics | |
| Multiple R | 0.982637569441814 |
| R-squared | 0.965576592878516 |
| Adjusted R-squared | 0.95584823869201 |
| F-TEST (value) | 99.253848530496 |
| F-TEST (DF numerator) | 13 |
| F-TEST (DF denominator) | 46 |
| p-value | 0 |
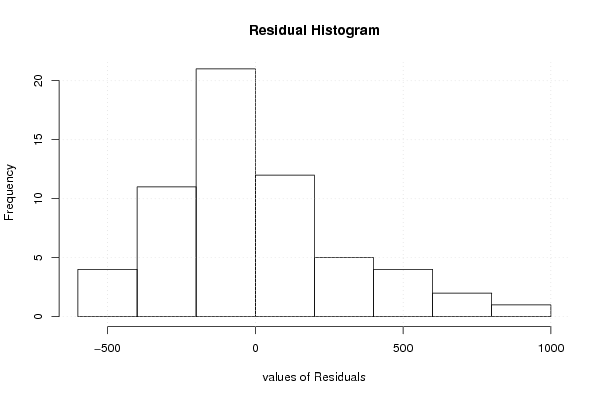
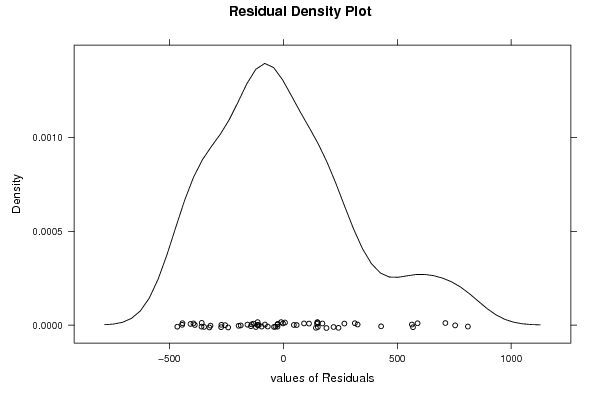
| Multiple Linear Regression - Residual Statistics | |
| Residual Standard Deviation | 351.141979660972 |
| Sum Squared Residuals | 5671831.73449042 |
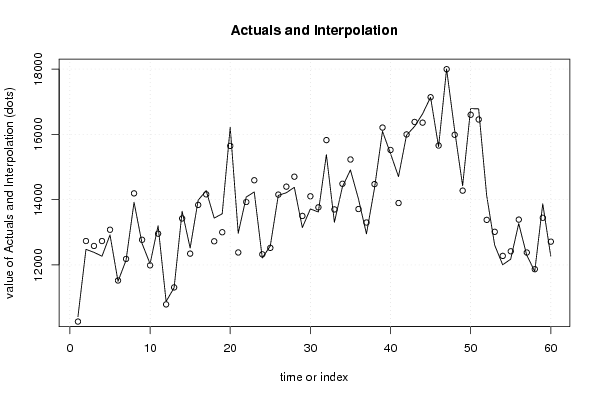
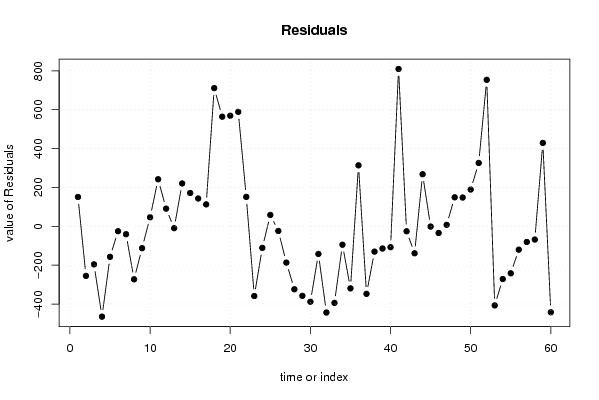
| Multiple Linear Regression - Actuals, Interpolation, and Residuals | |||
| Time or Index | Actuals | Interpolation Forecast | Residuals Prediction Error |
| 1 | 10414.9 | 10263.9959057434 | 150.904094256648 |
| 2 | 12476.8 | 12732.1584119406 | -255.358411940591 |
| 3 | 12384.6 | 12580.6941836601 | -196.094183660072 |
| 4 | 12266.7 | 12731.8365554406 | -465.136555440641 |
| 5 | 12919.9 | 13077.2031060224 | -157.303106022370 |
| 6 | 11497.3 | 11522.776577637 | -25.4765776370010 |
| 7 | 12142 | 12182.8252814049 | -40.8252814049234 |
| 8 | 13919.4 | 14192.3365412294 | -272.936541229355 |
| 9 | 12656.8 | 12769.4828237373 | -112.682823737346 |
| 10 | 12034.1 | 11987.843889897 | 46.2561101029888 |
| 11 | 13199.7 | 12957.6039119034 | 242.096088096559 |
| 12 | 10881.3 | 10790.4878423087 | 90.8121576913492 |
| 13 | 11301.2 | 11310.8708479881 | -9.67084798810856 |
| 14 | 13643.9 | 13423.4414201386 | 220.458579861361 |
| 15 | 12517 | 12345.6295402285 | 171.370459771496 |
| 16 | 13981.1 | 13838.0634399072 | 143.036560092754 |
| 17 | 14275.7 | 14162.9530507032 | 112.746949296823 |
| 18 | 13435 | 12723.8002594876 | 711.199740512395 |
| 19 | 13565.7 | 13001.5434580161 | 564.156541983896 |
| 20 | 16216.3 | 15647.1911213384 | 569.108878661566 |
| 21 | 12970 | 12380.9970476975 | 589.002952302539 |
| 22 | 14079.9 | 13928.5320565991 | 151.367943400912 |
| 23 | 14235 | 14594.0484098084 | -359.048409808405 |
| 24 | 12213.4 | 12324.4436974278 | -111.043697427842 |
| 25 | 12581 | 12522.6007470871 | 58.3992529128742 |
| 26 | 14130.4 | 14154.3270377701 | -23.9270377701293 |
| 27 | 14210.8 | 14397.7455213995 | -186.945521399493 |
| 28 | 14378.5 | 14702.7248012155 | -324.224801215501 |
| 29 | 13142.8 | 13500.7830997597 | -357.983099759706 |
| 30 | 13714.7 | 14103.1915995739 | -388.491599573892 |
| 31 | 13621.9 | 13764.2358958225 | -142.335895822491 |
| 32 | 15379.8 | 15823.6402069017 | -443.840206901663 |
| 33 | 13306.3 | 13700.6206701348 | -394.320670134846 |
| 34 | 14391.2 | 14486.1432649771 | -94.9432649771486 |
| 35 | 14909.9 | 15229.5135669152 | -319.613566915213 |
| 36 | 14025.4 | 13711.6308267727 | 313.769173227319 |
| 37 | 12951.2 | 13298.805886275 | -347.605886275002 |
| 38 | 14344.3 | 14474.7383649746 | -130.438364974631 |
| 39 | 16093.4 | 16207.7762601282 | -114.376260128228 |
| 40 | 15413.6 | 15521.2350901131 | -107.635090113123 |
| 41 | 14705.7 | 13895.8261161328 | 809.87388386725 |
| 42 | 15972.8 | 15998.4563008628 | -25.6563008628048 |
| 43 | 16241.4 | 16380.3512438856 | -138.951243885565 |
| 44 | 16626.4 | 16358.4877106447 | 267.912289355252 |
| 45 | 17136.2 | 17137.5806551951 | -1.38065519512051 |
| 46 | 15622.9 | 15657.3350599317 | -34.4350599316925 |
| 47 | 18003.9 | 17996.4514511671 | 7.44854883291681 |
| 48 | 16136.1 | 15987.0182123086 | 149.081787691385 |
| 49 | 14423.7 | 14275.7266129064 | 147.973387093588 |
| 50 | 16789.4 | 16600.134765176 | 189.265234823990 |
| 51 | 16782.2 | 16456.1544945837 | 326.045505416298 |
| 52 | 14133.8 | 13379.8401133235 | 753.959886676512 |
| 53 | 12607 | 13014.334627382 | -407.334627381998 |
| 54 | 12004.5 | 12276.0752624387 | -271.575262438697 |
| 55 | 12175.4 | 12417.4441208709 | -242.044120870916 |
| 56 | 13268 | 13388.2444198858 | -120.244419885800 |
| 57 | 12299.3 | 12379.9188032352 | -80.6188032352273 |
| 58 | 11800.6 | 11868.8457285951 | -68.2457285950599 |
| 59 | 13873.3 | 13444.1826602059 | 429.117339794142 |
| 60 | 12269.6 | 12712.2194211822 | -442.619421182211 |
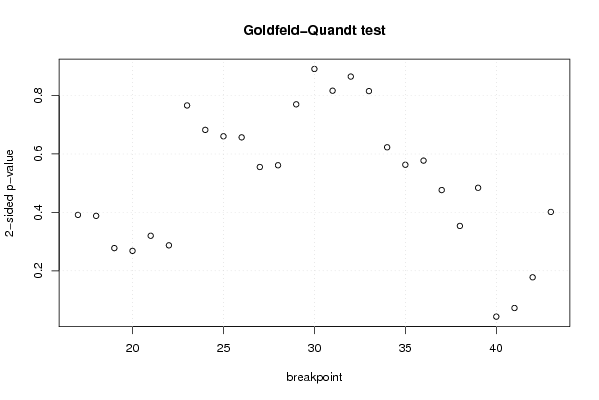
| Goldfeld-Quandt test for Heteroskedasticity | |||
| p-values | Alternative Hypothesis | ||
| breakpoint index | greater | 2-sided | less |
| 17 | 0.195657384781905 | 0.39131476956381 | 0.804342615218095 |
| 18 | 0.194063652900467 | 0.388127305800934 | 0.805936347099533 |
| 19 | 0.138820903247369 | 0.277641806494739 | 0.86117909675263 |
| 20 | 0.134119372613347 | 0.268238745226695 | 0.865880627386653 |
| 21 | 0.159971493769724 | 0.319942987539447 | 0.840028506230276 |
| 22 | 0.143590384638628 | 0.287180769277256 | 0.856409615361372 |
| 23 | 0.38308469437813 | 0.76616938875626 | 0.61691530562187 |
| 24 | 0.341248670057270 | 0.682497340114541 | 0.65875132994273 |
| 25 | 0.330300072913153 | 0.660600145826306 | 0.669699927086847 |
| 26 | 0.328462386183632 | 0.656924772367265 | 0.671537613816368 |
| 27 | 0.277700562632804 | 0.555401125265608 | 0.722299437367196 |
| 28 | 0.280698498516566 | 0.561396997033133 | 0.719301501483434 |
| 29 | 0.385020167831237 | 0.770040335662474 | 0.614979832168763 |
| 30 | 0.445591669561847 | 0.891183339123694 | 0.554408330438153 |
| 31 | 0.408333409893542 | 0.816666819787084 | 0.591666590106458 |
| 32 | 0.432566886641347 | 0.865133773282694 | 0.567433113358653 |
| 33 | 0.407703147953962 | 0.815406295907923 | 0.592296852046039 |
| 34 | 0.311466602406775 | 0.62293320481355 | 0.688533397593225 |
| 35 | 0.281529208925604 | 0.563058417851208 | 0.718470791074396 |
| 36 | 0.288603994779372 | 0.577207989558745 | 0.711396005220628 |
| 37 | 0.238224507249945 | 0.476449014499889 | 0.761775492750055 |
| 38 | 0.176788364493332 | 0.353576728986664 | 0.823211635506668 |
| 39 | 0.242091349941485 | 0.48418269988297 | 0.757908650058515 |
| 40 | 0.97853614576133 | 0.0429277084773388 | 0.0214638542386694 |
| 41 | 0.96373959150614 | 0.0725208169877183 | 0.0362604084938592 |
| 42 | 0.911159494011774 | 0.177681011976453 | 0.0888405059882265 |
| 43 | 0.799261300526034 | 0.401477398947932 | 0.200738699473966 |
| Meta Analysis of Goldfeld-Quandt test for Heteroskedasticity | |||
| Description | # significant tests | % significant tests | OK/NOK |
| 1% type I error level | 0 | 0 | OK |
| 5% type I error level | 1 | 0.0370370370370370 | OK |
| 10% type I error level | 2 | 0.0740740740740741 | OK |