| Multiple Linear Regression - Estimated Regression Equation |
| TW[t] = + 0.211999605127861 + 0.527374917646042WM[t] + 0.424575943486697WV[t] + 0.00763345863895995WJ[t] -0.0107192009268042M1[t] -0.0253430461300658M2[t] + 0.0173207640937708M3[t] -0.0147025622825291M4[t] -0.0111383824972702M5[t] -0.0127332059870329M6[t] + 0.0137345467647528M7[t] -0.0027356307527948M8[t] + 0.0198790659864952M9[t] + 0.00495812503304638M10[t] + 0.0148365517192163M11[t] + 0.000127469705657836t + e[t] |
| Multiple Linear Regression - Ordinary Least Squares | |||||
| Variable | Parameter | S.D. | T-STAT H0: parameter = 0 | 2-tail p-value | 1-tail p-value |
| (Intercept) | 0.211999605127861 | 0.08483 | 2.4991 | 0.015851 | 0.007925 |
| WM | 0.527374917646042 | 0.011295 | 46.6927 | 0 | 0 |
| WV | 0.424575943486697 | 0.010829 | 39.209 | 0 | 0 |
| WJ | 0.00763345863895995 | 0.00403 | 1.894 | 0.064136 | 0.032068 |
| M1 | -0.0107192009268042 | 0.02007 | -0.5341 | 0.595695 | 0.297847 |
| M2 | -0.0253430461300658 | 0.020091 | -1.2614 | 0.213138 | 0.106569 |
| M3 | 0.0173207640937708 | 0.022227 | 0.7793 | 0.439563 | 0.219781 |
| M4 | -0.0147025622825291 | 0.024848 | -0.5917 | 0.556773 | 0.278387 |
| M5 | -0.0111383824972702 | 0.024261 | -0.4591 | 0.648191 | 0.324096 |
| M6 | -0.0127332059870329 | 0.023597 | -0.5396 | 0.591904 | 0.295952 |
| M7 | 0.0137345467647528 | 0.021752 | 0.6314 | 0.530701 | 0.265351 |
| M8 | -0.0027356307527948 | 0.020922 | -0.1308 | 0.896507 | 0.448253 |
| M9 | 0.0198790659864952 | 0.020771 | 0.9571 | 0.34323 | 0.171615 |
| M10 | 0.00495812503304638 | 0.020789 | 0.2385 | 0.812486 | 0.406243 |
| M11 | 0.0148365517192163 | 0.02064 | 0.7188 | 0.475655 | 0.237827 |
| t | 0.000127469705657836 | 0.000426 | 0.2993 | 0.76599 | 0.382995 |
| Multiple Linear Regression - Regression Statistics | |
| Multiple R | 0.999180255803478 |
| R-squared | 0.998361183587504 |
| Adjusted R-squared | 0.997859505093883 |
| F-TEST (value) | 1990.04182216648 |
| F-TEST (DF numerator) | 15 |
| F-TEST (DF denominator) | 49 |
| p-value | 0 |
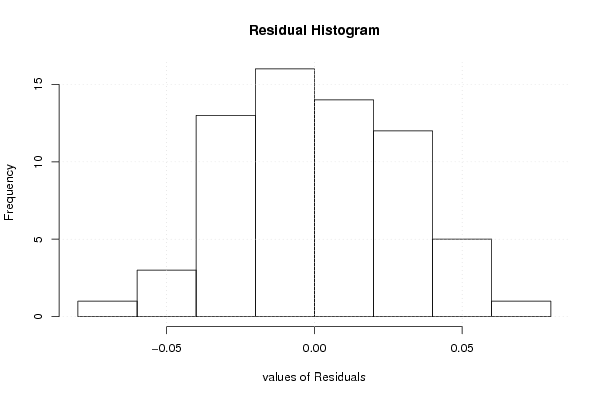
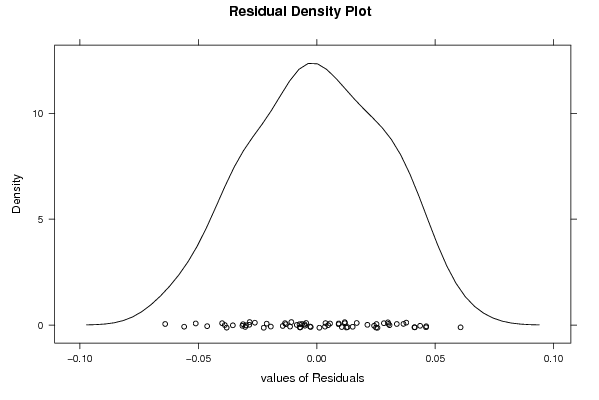
| Multiple Linear Regression - Residual Statistics | |
| Residual Standard Deviation | 0.0324139473504168 |
| Sum Squared Residuals | 0.0514825351589441 |
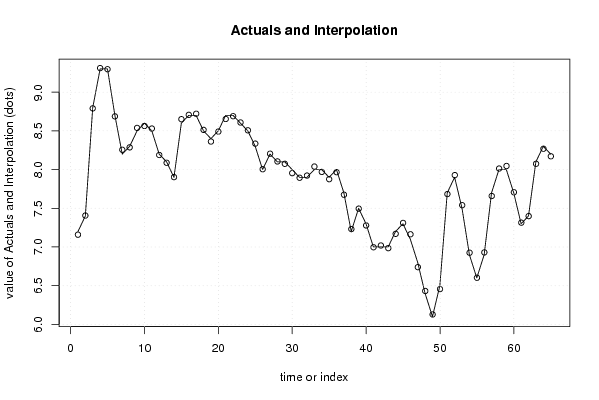
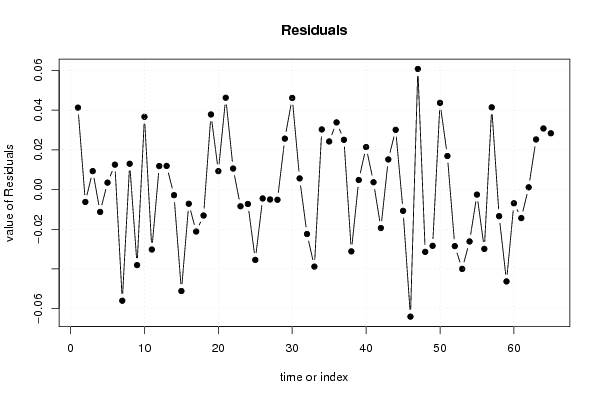
| Multiple Linear Regression - Actuals, Interpolation, and Residuals | |||
| Time or Index | Actuals | Interpolation Forecast | Residuals Prediction Error |
| 1 | 7.2 | 7.15877456681749 | 0.0412254331825123 |
| 2 | 7.4 | 7.40625027137223 | -0.00625027137223209 |
| 3 | 8.8 | 8.79074422021145 | 0.00925577978854648 |
| 4 | 9.3 | 9.31127555114588 | -0.0112755511458815 |
| 5 | 9.3 | 9.2965297292542 | 0.00347027074580880 |
| 6 | 8.7 | 8.68749048785962 | 0.0125095121403803 |
| 7 | 8.2 | 8.25597309231226 | -0.055973092312265 |
| 8 | 8.3 | 8.2870244552177 | 0.0129755447822942 |
| 9 | 8.5 | 8.5380343130545 | -0.0380343130544964 |
| 10 | 8.6 | 8.56340839856369 | 0.0365916014363128 |
| 11 | 8.5 | 8.53019335474295 | -0.0301933547429491 |
| 12 | 8.2 | 8.1882047659048 | 0.0117952340952040 |
| 13 | 8.1 | 8.08811777080293 | 0.0118822291970658 |
| 14 | 7.9 | 7.9028389850039 | -0.00283898500389447 |
| 15 | 8.6 | 8.65109422092743 | -0.051094220927429 |
| 16 | 8.7 | 8.70716693640971 | -0.00716693640971106 |
| 17 | 8.7 | 8.72113848331656 | -0.0211384833165615 |
| 18 | 8.5 | 8.51308298002167 | -0.0130829800216662 |
| 19 | 8.4 | 8.36221436644547 | 0.0377856335545296 |
| 20 | 8.5 | 8.49075085305588 | 0.0092491469441242 |
| 21 | 8.7 | 8.65379213873974 | 0.046207861260258 |
| 22 | 8.7 | 8.68944612166487 | 0.0105538783351330 |
| 23 | 8.6 | 8.60843006244819 | -0.00843006244818653 |
| 24 | 8.5 | 8.5072791000095 | -0.00727910000949656 |
| 25 | 8.3 | 8.33542151003895 | -0.0354215100389536 |
| 26 | 8 | 8.00450018395373 | -0.00450018395372530 |
| 27 | 8.2 | 8.2050093944422 | -0.00500939444220988 |
| 28 | 8.1 | 8.10515967222237 | -0.00515967222236557 |
| 29 | 8.1 | 8.07438358718886 | 0.0256164128111402 |
| 30 | 8 | 7.95388971136828 | 0.0461102886317216 |
| 31 | 7.9 | 7.89439945458588 | 0.00560054541412379 |
| 32 | 7.9 | 7.92239743403573 | -0.0223974340357345 |
| 33 | 8 | 8.03880799486616 | -0.0388079948661648 |
| 34 | 8 | 7.96975034012598 | 0.0302496598740227 |
| 35 | 7.9 | 7.8758079447164 | 0.0241920552836112 |
| 36 | 8 | 7.96621744504675 | 0.033782554953248 |
| 37 | 7.7 | 7.67497693185445 | 0.0250230681455531 |
| 38 | 7.2 | 7.23113585064391 | -0.0311358506439103 |
| 39 | 7.5 | 7.49520753854108 | 0.00479246145892127 |
| 40 | 7.3 | 7.27862133187645 | 0.0213786681235531 |
| 41 | 7 | 6.99632077834893 | 0.00367922165106692 |
| 42 | 7 | 7.0193976628586 | -0.0193976628586033 |
| 43 | 7 | 6.98485858904859 | 0.0151414109514131 |
| 44 | 7.2 | 7.16994929674308 | 0.030050703256925 |
| 45 | 7.3 | 7.31073638172485 | -0.0107363817248539 |
| 46 | 7.1 | 7.16399005224768 | -0.0639900522476777 |
| 47 | 6.8 | 6.7393078218793 | 0.0606921781206996 |
| 48 | 6.4 | 6.43138002288696 | -0.0313800228869595 |
| 49 | 6.1 | 6.12833292055093 | -0.0283329205509286 |
| 50 | 6.5 | 6.45638296915584 | 0.0436170308441603 |
| 51 | 7.7 | 7.68314290377361 | 0.0168570962263866 |
| 52 | 7.9 | 7.92848604443326 | -0.0284860444332596 |
| 53 | 7.5 | 7.53994716151264 | -0.0399471615126423 |
| 54 | 6.9 | 6.92613915789183 | -0.0261391578918324 |
| 55 | 6.6 | 6.6025544976078 | -0.00255449760780150 |
| 56 | 6.9 | 6.92987796094761 | -0.0298779609476088 |
| 57 | 7.7 | 7.65862917161474 | 0.0413708283852571 |
| 58 | 8 | 8.0134050873978 | -0.0134050873977908 |
| 59 | 8 | 8.04626081621318 | -0.0462608162131751 |
| 60 | 7.7 | 7.706918666152 | -0.00691866615199587 |
| 61 | 7.3 | 7.31437629993525 | -0.0143762999352490 |
| 62 | 7.4 | 7.3988917398704 | 0.00110826012960181 |
| 63 | 8.1 | 8.07480172210422 | 0.0251982778957845 |
| 64 | 8.3 | 8.26929046391234 | 0.0307095360876646 |
| 65 | 8.2 | 8.17168026037881 | 0.0283197396211879 |
| Goldfeld-Quandt test for Heteroskedasticity | |||
| p-values | Alternative Hypothesis | ||
| breakpoint index | greater | 2-sided | less |
| 19 | 0.788536238017317 | 0.422927523965366 | 0.211463761982683 |
| 20 | 0.657884034790941 | 0.684231930418118 | 0.342115965209059 |
| 21 | 0.731877116478965 | 0.536245767042069 | 0.268122883521034 |
| 22 | 0.715834236381099 | 0.568331527237803 | 0.284165763618901 |
| 23 | 0.607085298161478 | 0.785829403677044 | 0.392914701838522 |
| 24 | 0.525523396694702 | 0.948953206610595 | 0.474476603305298 |
| 25 | 0.646387585020649 | 0.707224829958703 | 0.353612414979351 |
| 26 | 0.561972531240254 | 0.876054937519493 | 0.438027468759746 |
| 27 | 0.49078300875173 | 0.98156601750346 | 0.50921699124827 |
| 28 | 0.411955331367317 | 0.823910662734634 | 0.588044668632683 |
| 29 | 0.325076217395206 | 0.650152434790412 | 0.674923782604794 |
| 30 | 0.31961182494046 | 0.63922364988092 | 0.68038817505954 |
| 31 | 0.244089627255098 | 0.488179254510196 | 0.755910372744902 |
| 32 | 0.271358446271108 | 0.542716892542217 | 0.728641553728892 |
| 33 | 0.465949928113051 | 0.931899856226102 | 0.534050071886949 |
| 34 | 0.382361250707983 | 0.764722501415966 | 0.617638749292017 |
| 35 | 0.338422818489542 | 0.676845636979084 | 0.661577181510458 |
| 36 | 0.282465873613098 | 0.564931747226195 | 0.717534126386902 |
| 37 | 0.301135535947727 | 0.602271071895455 | 0.698864464052273 |
| 38 | 0.249268221981106 | 0.498536443962212 | 0.750731778018894 |
| 39 | 0.182683509643585 | 0.365367019287170 | 0.817316490356415 |
| 40 | 0.146455238902516 | 0.292910477805032 | 0.853544761097484 |
| 41 | 0.125889067468071 | 0.251778134936142 | 0.87411093253193 |
| 42 | 0.105615902276104 | 0.211231804552207 | 0.894384097723896 |
| 43 | 0.060842997946705 | 0.121685995893410 | 0.939157002053295 |
| 44 | 0.105973546658404 | 0.211947093316807 | 0.894026453341596 |
| 45 | 0.056001108392844 | 0.112002216785688 | 0.943998891607156 |
| 46 | 0.223734712428962 | 0.447469424857925 | 0.776265287571038 |
| Meta Analysis of Goldfeld-Quandt test for Heteroskedasticity | |||
| Description | # significant tests | % significant tests | OK/NOK |
| 1% type I error level | 0 | 0 | OK |
| 5% type I error level | 0 | 0 | OK |
| 10% type I error level | 0 | 0 | OK |