| Multiple Linear Regression - Estimated Regression Equation |
| WMan>25[t] = + 0.205529147155612 -0.006701733132186Infl[t] + 1.46424310835333`Yt-1`[t] -0.572214153777315`Yt-2`[t] -0.306648555087636`Yt-3`[t] + 0.404540471386374`Yt-4`[t] + 0.00841686847188313M1[t] -0.192488288817357M2[t] -0.133691692405834M3[t] -0.162225291504273M4[t] -0.213984572812024M5[t] -0.354608452344717M6[t] -0.0590469925769761M7[t] -0.43876956278108M8[t] -0.336609775414806M9[t] -0.209948728671440M10[t] -0.200347599504354M11[t] + 0.00233719208955934t + e[t] |
| Multiple Linear Regression - Ordinary Least Squares | |||||
| Variable | Parameter | S.D. | T-STAT H0: parameter = 0 | 2-tail p-value | 1-tail p-value |
| (Intercept) | 0.205529147155612 | 0.627458 | 0.3276 | 0.745044 | 0.372522 |
| Infl | -0.006701733132186 | 0.020618 | -0.325 | 0.746932 | 0.373466 |
| `Yt-1` | 1.46424310835333 | 0.157152 | 9.3174 | 0 | 0 |
| `Yt-2` | -0.572214153777315 | 0.2819 | -2.0298 | 0.049417 | 0.024708 |
| `Yt-3` | -0.306648555087636 | 0.283438 | -1.0819 | 0.28612 | 0.14306 |
| `Yt-4` | 0.404540471386374 | 0.170919 | 2.3669 | 0.023138 | 0.011569 |
| M1 | 0.00841686847188313 | 0.120462 | 0.0699 | 0.944662 | 0.472331 |
| M2 | -0.192488288817357 | 0.127934 | -1.5046 | 0.140695 | 0.070348 |
| M3 | -0.133691692405834 | 0.132805 | -1.0067 | 0.320459 | 0.160229 |
| M4 | -0.162225291504273 | 0.133475 | -1.2154 | 0.231713 | 0.115856 |
| M5 | -0.213984572812024 | 0.130341 | -1.6417 | 0.108898 | 0.054449 |
| M6 | -0.354608452344717 | 0.129565 | -2.7369 | 0.00938 | 0.00469 |
| M7 | -0.0590469925769761 | 0.129365 | -0.4564 | 0.650674 | 0.325337 |
| M8 | -0.43876956278108 | 0.127628 | -3.4379 | 0.001436 | 0.000718 |
| M9 | -0.336609775414806 | 0.140883 | -2.3893 | 0.02195 | 0.010975 |
| M10 | -0.209948728671440 | 0.127155 | -1.6511 | 0.106954 | 0.053477 |
| M11 | -0.200347599504354 | 0.123495 | -1.6223 | 0.113004 | 0.056502 |
| t | 0.00233719208955934 | 0.002109 | 1.1085 | 0.274629 | 0.137315 |
| Multiple Linear Regression - Regression Statistics | |
| Multiple R | 0.965451375198482 |
| R-squared | 0.932096357872639 |
| Adjusted R-squared | 0.901718412710399 |
| F-TEST (value) | 30.6833247902241 |
| F-TEST (DF numerator) | 17 |
| F-TEST (DF denominator) | 38 |
| p-value | 0 |
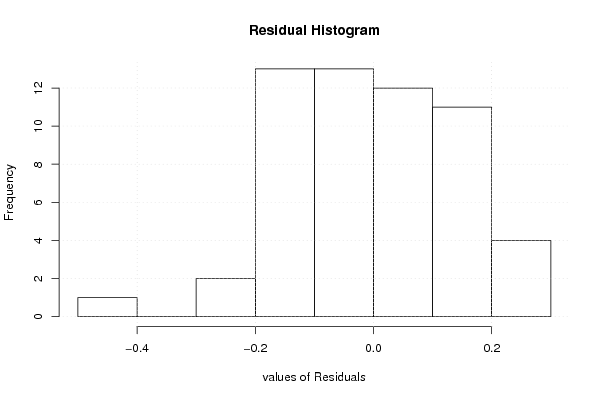
| Multiple Linear Regression - Residual Statistics | |
| Residual Standard Deviation | 0.172463277800623 |
| Sum Squared Residuals | 1.13025612320992 |
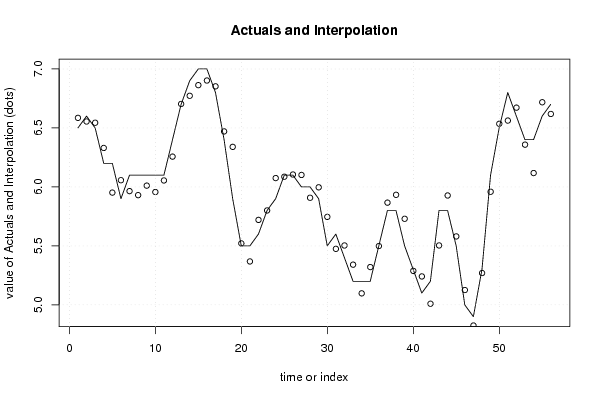
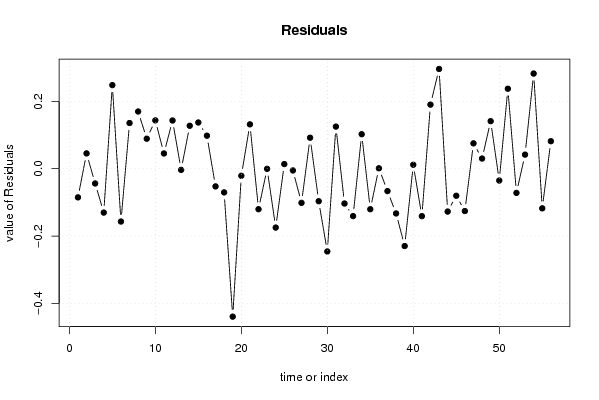
| Multiple Linear Regression - Actuals, Interpolation, and Residuals | |||
| Time or Index | Actuals | Interpolation Forecast | Residuals Prediction Error |
| 1 | 6.5 | 6.58515908754108 | -0.08515908754108 |
| 2 | 6.6 | 6.55453754831352 | 0.0454624516864788 |
| 3 | 6.5 | 6.54385853879865 | -0.0438585387986542 |
| 4 | 6.2 | 6.33024392227036 | -0.130243922270363 |
| 5 | 6.2 | 5.95169424794529 | 0.248305752054712 |
| 6 | 5.9 | 6.05686088259597 | -0.156860882595968 |
| 7 | 6.1 | 5.96434642808205 | 0.135653571917952 |
| 8 | 6.1 | 5.93011177635545 | 0.169888223644548 |
| 9 | 6.1 | 6.01082014495567 | 0.0891798550443245 |
| 10 | 6.1 | 5.95645635804194 | 0.143543641958056 |
| 11 | 6.1 | 6.05466416008161 | 0.0453358399183878 |
| 12 | 6.4 | 6.2566787783623 | 0.143321221637694 |
| 13 | 6.7 | 6.70335490486366 | -0.00335490486365748 |
| 14 | 6.9 | 6.77239562603678 | 0.127604373963219 |
| 15 | 7 | 6.86271922354905 | 0.137280776450954 |
| 16 | 7 | 6.90189291138897 | 0.0981070886110306 |
| 17 | 6.8 | 6.85260114393856 | -0.0526011439385567 |
| 18 | 6.4 | 6.47036872696683 | -0.0703687269668295 |
| 19 | 5.9 | 6.33947753331655 | -0.439477533316553 |
| 20 | 5.5 | 5.52085614686701 | -0.0208561468670132 |
| 21 | 5.5 | 5.36818446094117 | 0.131815539058832 |
| 22 | 5.6 | 5.72025714352716 | -0.120257143527163 |
| 23 | 5.8 | 5.80034930858745 | -0.000349308587445725 |
| 24 | 5.9 | 6.07483459798009 | -0.174834597980089 |
| 25 | 6.1 | 6.08623510979942 | 0.0137648902005789 |
| 26 | 6.1 | 6.10509938026666 | -0.00509938026665854 |
| 27 | 6 | 6.10136340346757 | -0.101363403467571 |
| 28 | 6 | 5.90786702174447 | 0.0921329782555311 |
| 29 | 5.9 | 5.99657444218128 | -0.0965744421812821 |
| 30 | 5.5 | 5.74587916597767 | -0.245879165977672 |
| 31 | 5.6 | 5.47484794273273 | 0.125152057267267 |
| 32 | 5.4 | 5.50343739247321 | -0.103437392473210 |
| 33 | 5.2 | 5.34073988309028 | -0.140739883090282 |
| 34 | 5.2 | 5.09751094031825 | 0.102489059681746 |
| 35 | 5.2 | 5.32031446398078 | -0.120314463980777 |
| 36 | 5.5 | 5.49872965912241 | 0.00127034087758668 |
| 37 | 5.8 | 5.86650821128614 | -0.0665082112861441 |
| 38 | 5.8 | 5.93286823920639 | -0.132868239206394 |
| 39 | 5.5 | 5.72967304173477 | -0.229673041734773 |
| 40 | 5.3 | 5.28820989060377 | 0.0117901093962337 |
| 41 | 5.1 | 5.24097608720367 | -0.140976087203669 |
| 42 | 5.2 | 5.00957644223944 | 0.190423557760564 |
| 43 | 5.8 | 5.50361859209662 | 0.296381407903381 |
| 44 | 5.8 | 5.92730910704338 | -0.127309107043377 |
| 45 | 5.5 | 5.58025551101287 | -0.0802555110128746 |
| 46 | 5 | 5.12577555811264 | -0.125775558112639 |
| 47 | 4.9 | 4.82467206735017 | 0.075327932649835 |
| 48 | 5.3 | 5.26975696453519 | 0.0302430354648085 |
| 49 | 6.1 | 5.9587426865097 | 0.141257313490303 |
| 50 | 6.5 | 6.53509920617665 | -0.0350992061766451 |
| 51 | 6.8 | 6.56238579244996 | 0.237614207550044 |
| 52 | 6.6 | 6.67178625399243 | -0.0717862539924327 |
| 53 | 6.4 | 6.3581540787312 | 0.0418459212687959 |
| 54 | 6.4 | 6.11731478222009 | 0.282685217779906 |
| 55 | 6.6 | 6.71770950377205 | -0.117709503772046 |
| 56 | 6.7 | 6.61828557726095 | 0.0817144227390516 |
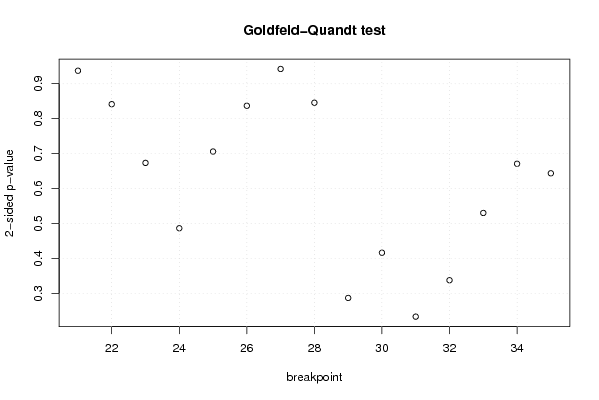
| Goldfeld-Quandt test for Heteroskedasticity | |||
| p-values | Alternative Hypothesis | ||
| breakpoint index | greater | 2-sided | less |
| 21 | 0.531418945737452 | 0.937162108525097 | 0.468581054262548 |
| 22 | 0.420735770288982 | 0.841471540577964 | 0.579264229711018 |
| 23 | 0.663305654576485 | 0.67338869084703 | 0.336694345423515 |
| 24 | 0.75679832714974 | 0.486403345700519 | 0.243201672850260 |
| 25 | 0.647019330916226 | 0.705961338167547 | 0.352980669083774 |
| 26 | 0.58154623193991 | 0.83690753612018 | 0.41845376806009 |
| 27 | 0.47113896236484 | 0.94227792472968 | 0.52886103763516 |
| 28 | 0.577203536739751 | 0.845592926520497 | 0.422796463260249 |
| 29 | 0.85657481084853 | 0.28685037830294 | 0.14342518915147 |
| 30 | 0.791855379951965 | 0.41628924009607 | 0.208144620048035 |
| 31 | 0.883315572785402 | 0.233368854429197 | 0.116684427214598 |
| 32 | 0.831202943163046 | 0.337594113673909 | 0.168797056836954 |
| 33 | 0.734940841180339 | 0.530118317639323 | 0.265059158819661 |
| 34 | 0.664558535493557 | 0.670882929012885 | 0.335441464506443 |
| 35 | 0.678185020686193 | 0.643629958627615 | 0.321814979313807 |
| Meta Analysis of Goldfeld-Quandt test for Heteroskedasticity | |||
| Description | # significant tests | % significant tests | OK/NOK |
| 1% type I error level | 0 | 0 | OK |
| 5% type I error level | 0 | 0 | OK |
| 10% type I error level | 0 | 0 | OK |