| Multiple Linear Regression - Estimated Regression Equation |
| Y[t] = + 7.98971428571429 + 0.291428571428571X[t] -0.0081111111111108M1[t] -0.296793650793651M2[t] -0.473285714285714M3[t] -0.549777777777779M4[t] -0.306269841269842M5[t] -0.00104761904761940M6[t] + 0.142460317460317M7[t] + 0.0859682539682537M8[t] -0.0305238095238098M9[t] -0.227015873015873M10[t] -0.403507936507937M11[t] -0.0235079365079365t + e[t] |
| Multiple Linear Regression - Ordinary Least Squares | |||||
| Variable | Parameter | S.D. | T-STAT H0: parameter = 0 | 2-tail p-value | 1-tail p-value |
| (Intercept) | 7.98971428571429 | 0.337456 | 23.6763 | 0 | 0 |
| X | 0.291428571428571 | 0.29259 | 0.996 | 0.324335 | 0.162168 |
| M1 | -0.0081111111111108 | 0.372191 | -0.0218 | 0.982705 | 0.491353 |
| M2 | -0.296793650793651 | 0.390476 | -0.7601 | 0.451002 | 0.225501 |
| M3 | -0.473285714285714 | 0.389954 | -1.2137 | 0.230928 | 0.115464 |
| M4 | -0.549777777777779 | 0.389587 | -1.4112 | 0.164777 | 0.082388 |
| M5 | -0.306269841269842 | 0.389374 | -0.7866 | 0.435481 | 0.217741 |
| M6 | -0.00104761904761940 | 0.390607 | -0.0027 | 0.997871 | 0.498936 |
| M7 | 0.142460317460317 | 0.389757 | 0.3655 | 0.71637 | 0.358185 |
| M8 | 0.0859682539682537 | 0.38906 | 0.221 | 0.826077 | 0.413039 |
| M9 | -0.0305238095238098 | 0.388517 | -0.0786 | 0.937712 | 0.468856 |
| M10 | -0.227015873015873 | 0.388129 | -0.5849 | 0.561414 | 0.280707 |
| M11 | -0.403507936507937 | 0.387895 | -1.0402 | 0.303546 | 0.151773 |
| t | -0.0235079365079365 | 0.007766 | -3.0272 | 0.003998 | 0.001999 |
| Multiple Linear Regression - Regression Statistics | |
| Multiple R | 0.574299977559274 |
| R-squared | 0.329820464224582 |
| Adjusted R-squared | 0.144451656456913 |
| F-TEST (value) | 1.77926625410442 |
| F-TEST (DF numerator) | 13 |
| F-TEST (DF denominator) | 47 |
| p-value | 0.0752311735750701 |
| Multiple Linear Regression - Residual Statistics | |
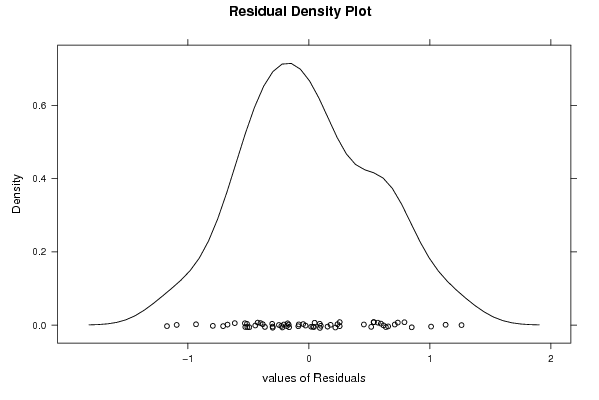
| Residual Standard Deviation | 0.613193676007708 |
| Sum Squared Residuals | 17.6723047619048 |
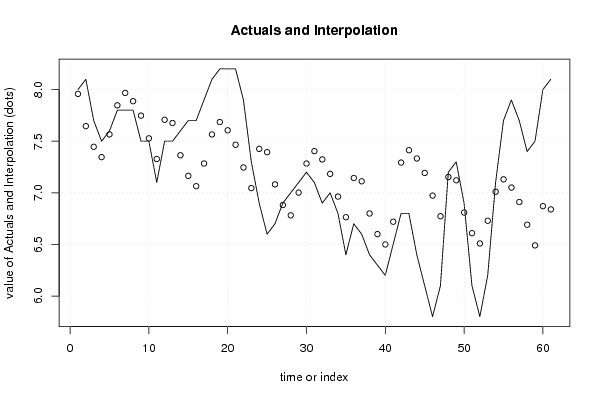
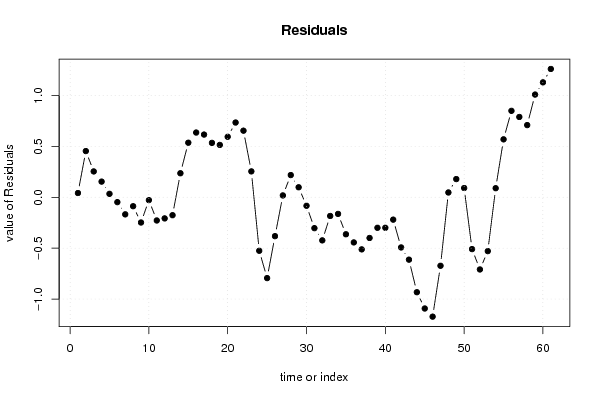
| Multiple Linear Regression - Actuals, Interpolation, and Residuals | |||
| Time or Index | Actuals | Interpolation Forecast | Residuals Prediction Error |
| 1 | 8 | 7.95809523809523 | 0.0419047619047665 |
| 2 | 8.1 | 7.64590476190476 | 0.454095238095238 |
| 3 | 7.7 | 7.44590476190476 | 0.254095238095238 |
| 4 | 7.5 | 7.34590476190476 | 0.154095238095236 |
| 5 | 7.6 | 7.56590476190476 | 0.0340952380952374 |
| 6 | 7.8 | 7.84761904761905 | -0.0476190476190475 |
| 7 | 7.8 | 7.96761904761905 | -0.167619047619048 |
| 8 | 7.8 | 7.88761904761905 | -0.0876190476190477 |
| 9 | 7.5 | 7.74761904761905 | -0.247619047619048 |
| 10 | 7.5 | 7.52761904761905 | -0.0276190476190476 |
| 11 | 7.1 | 7.32761904761905 | -0.227619047619048 |
| 12 | 7.5 | 7.70761904761905 | -0.207619047619048 |
| 13 | 7.5 | 7.676 | -0.176000000000001 |
| 14 | 7.6 | 7.36380952380952 | 0.236190476190475 |
| 15 | 7.7 | 7.16380952380952 | 0.536190476190476 |
| 16 | 7.7 | 7.06380952380952 | 0.636190476190477 |
| 17 | 7.9 | 7.28380952380952 | 0.616190476190477 |
| 18 | 8.1 | 7.56552380952381 | 0.53447619047619 |
| 19 | 8.2 | 7.68552380952381 | 0.51447619047619 |
| 20 | 8.2 | 7.60552380952381 | 0.59447619047619 |
| 21 | 8.2 | 7.46552380952381 | 0.73447619047619 |
| 22 | 7.9 | 7.24552380952381 | 0.65447619047619 |
| 23 | 7.3 | 7.04552380952381 | 0.254476190476191 |
| 24 | 6.9 | 7.42552380952381 | -0.525523809523809 |
| 25 | 6.6 | 7.39390476190476 | -0.793904761904763 |
| 26 | 6.7 | 7.08171428571428 | -0.381714285714285 |
| 27 | 6.9 | 6.88171428571429 | 0.0182857142857146 |
| 28 | 7 | 6.78171428571429 | 0.218285714285715 |
| 29 | 7.1 | 7.00171428571429 | 0.098285714285714 |
| 30 | 7.2 | 7.28342857142857 | -0.0834285714285712 |
| 31 | 7.1 | 7.40342857142857 | -0.303428571428571 |
| 32 | 6.9 | 7.32342857142857 | -0.423428571428571 |
| 33 | 7 | 7.18342857142857 | -0.183428571428571 |
| 34 | 6.8 | 6.96342857142857 | -0.163428571428572 |
| 35 | 6.4 | 6.76342857142857 | -0.363428571428571 |
| 36 | 6.7 | 7.14342857142857 | -0.443428571428571 |
| 37 | 6.6 | 7.11180952380952 | -0.511809523809525 |
| 38 | 6.4 | 6.79961904761905 | -0.399619047619047 |
| 39 | 6.3 | 6.59961904761905 | -0.299619047619048 |
| 40 | 6.2 | 6.49961904761905 | -0.299619047619047 |
| 41 | 6.5 | 6.71961904761905 | -0.219619047619047 |
| 42 | 6.8 | 7.2927619047619 | -0.492761904761905 |
| 43 | 6.8 | 7.4127619047619 | -0.612761904761905 |
| 44 | 6.4 | 7.3327619047619 | -0.932761904761905 |
| 45 | 6.1 | 7.1927619047619 | -1.09276190476191 |
| 46 | 5.8 | 6.9727619047619 | -1.17276190476190 |
| 47 | 6.1 | 6.7727619047619 | -0.672761904761905 |
| 48 | 7.2 | 7.1527619047619 | 0.0472380952380952 |
| 49 | 7.3 | 7.12114285714286 | 0.178857142857142 |
| 50 | 6.9 | 6.80895238095238 | 0.0910476190476197 |
| 51 | 6.1 | 6.60895238095238 | -0.508952380952381 |
| 52 | 5.8 | 6.50895238095238 | -0.70895238095238 |
| 53 | 6.2 | 6.72895238095238 | -0.528952380952381 |
| 54 | 7.1 | 7.01066666666667 | 0.089333333333333 |
| 55 | 7.7 | 7.13066666666667 | 0.569333333333334 |
| 56 | 7.9 | 7.05066666666667 | 0.849333333333334 |
| 57 | 7.7 | 6.91066666666667 | 0.789333333333334 |
| 58 | 7.4 | 6.69066666666667 | 0.709333333333333 |
| 59 | 7.5 | 6.49066666666667 | 1.00933333333333 |
| 60 | 8 | 6.87066666666667 | 1.12933333333333 |
| 61 | 8.1 | 6.83904761904762 | 1.26095238095238 |
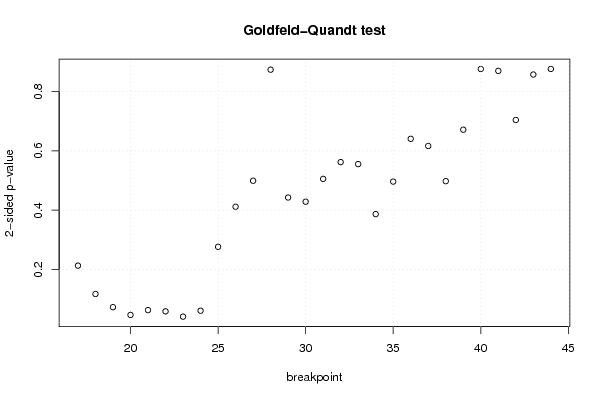
| Goldfeld-Quandt test for Heteroskedasticity | |||
| p-values | Alternative Hypothesis | ||
| breakpoint index | greater | 2-sided | less |
| 17 | 0.106514592759050 | 0.213029185518100 | 0.89348540724095 |
| 18 | 0.0586852418380361 | 0.117370483676072 | 0.941314758161964 |
| 19 | 0.036472185369894 | 0.072944370739788 | 0.963527814630106 |
| 20 | 0.0233517814189055 | 0.0467035628378110 | 0.976648218581095 |
| 21 | 0.0314827450966072 | 0.0629654901932144 | 0.968517254903393 |
| 22 | 0.0293989229416013 | 0.0587978458832025 | 0.970601077058399 |
| 23 | 0.0204355045337913 | 0.0408710090675825 | 0.979564495466209 |
| 24 | 0.030418815546125 | 0.06083763109225 | 0.969581184453875 |
| 25 | 0.138240617459518 | 0.276481234919037 | 0.861759382540482 |
| 26 | 0.205887829011737 | 0.411775658023474 | 0.794112170988263 |
| 27 | 0.249713056310982 | 0.499426112621963 | 0.750286943689018 |
| 28 | 0.437104405032881 | 0.874208810065762 | 0.562895594967119 |
| 29 | 0.778581248628103 | 0.442837502743794 | 0.221418751371897 |
| 30 | 0.785597073491165 | 0.428805853017671 | 0.214402926508835 |
| 31 | 0.747072752763712 | 0.505854494472577 | 0.252927247236288 |
| 32 | 0.718839233349604 | 0.562321533300792 | 0.281160766650396 |
| 33 | 0.722216805877635 | 0.55556638824473 | 0.277783194122365 |
| 34 | 0.806571452361237 | 0.386857095277526 | 0.193428547638763 |
| 35 | 0.751699784128516 | 0.496600431742968 | 0.248300215871484 |
| 36 | 0.679553372234216 | 0.640893255531569 | 0.320446627765784 |
| 37 | 0.691618844572622 | 0.616762310854756 | 0.308381155427378 |
| 38 | 0.750971829339954 | 0.498056341320092 | 0.249028170660046 |
| 39 | 0.664156890004778 | 0.671686219990445 | 0.335843109995222 |
| 40 | 0.561748420419732 | 0.876503159160537 | 0.438251579580268 |
| 41 | 0.435046171994913 | 0.870092343989826 | 0.564953828005087 |
| 42 | 0.647728819579358 | 0.704542360841284 | 0.352271180420642 |
| 43 | 0.571081789589114 | 0.857836420821773 | 0.428918210410886 |
| 44 | 0.43833454304332 | 0.87666908608664 | 0.56166545695668 |
| Meta Analysis of Goldfeld-Quandt test for Heteroskedasticity | |||
| Description | # significant tests | % significant tests | OK/NOK |
| 1% type I error level | 0 | 0 | OK |
| 5% type I error level | 2 | 0.0714285714285714 | NOK |
| 10% type I error level | 6 | 0.214285714285714 | NOK |