| Multiple Linear Regression - Estimated Regression Equation |
| Y[t] = + 7.43134020618557 -0.428350515463918X[t] + 0.0614432989690721M1[t] -0.205670103092784M2[t] -0.405670103092784M3[t] -0.505670103092785M4[t] -0.285670103092784M5[t] + 0.139999999999999M6[t] + 0.259999999999999M7[t] + 0.179999999999999M8[t] + 0.0399999999999992M9[t] -0.180000000000001M10[t] -0.380000000000001M11[t] + e[t] |
| Multiple Linear Regression - Ordinary Least Squares | |||||
| Variable | Parameter | S.D. | T-STAT H0: parameter = 0 | 2-tail p-value | 1-tail p-value |
| (Intercept) | 7.43134020618557 | 0.30567 | 24.3116 | 0 | 0 |
| X | -0.428350515463918 | 0.184438 | -2.3225 | 0.024495 | 0.012247 |
| M1 | 0.0614432989690721 | 0.401832 | 0.1529 | 0.879112 | 0.439556 |
| M2 | -0.205670103092784 | 0.421122 | -0.4884 | 0.6275 | 0.31375 |
| M3 | -0.405670103092784 | 0.421122 | -0.9633 | 0.340221 | 0.17011 |
| M4 | -0.505670103092785 | 0.421122 | -1.2008 | 0.235733 | 0.117866 |
| M5 | -0.285670103092784 | 0.421122 | -0.6784 | 0.500804 | 0.250402 |
| M6 | 0.139999999999999 | 0.419503 | 0.3337 | 0.740038 | 0.370019 |
| M7 | 0.259999999999999 | 0.419503 | 0.6198 | 0.538333 | 0.269167 |
| M8 | 0.179999999999999 | 0.419503 | 0.4291 | 0.669785 | 0.334893 |
| M9 | 0.0399999999999992 | 0.419503 | 0.0954 | 0.924433 | 0.462217 |
| M10 | -0.180000000000001 | 0.419503 | -0.4291 | 0.669785 | 0.334893 |
| M11 | -0.380000000000001 | 0.419503 | -0.9058 | 0.369549 | 0.184774 |
| Multiple Linear Regression - Regression Statistics | |
| Multiple R | 0.446265759861158 |
| R-squared | 0.199153128424457 |
| Adjusted R-squared | -0.00105858946942883 |
| F-TEST (value) | 0.994712649786114 |
| F-TEST (DF numerator) | 12 |
| F-TEST (DF denominator) | 48 |
| p-value | 0.467970416533147 |
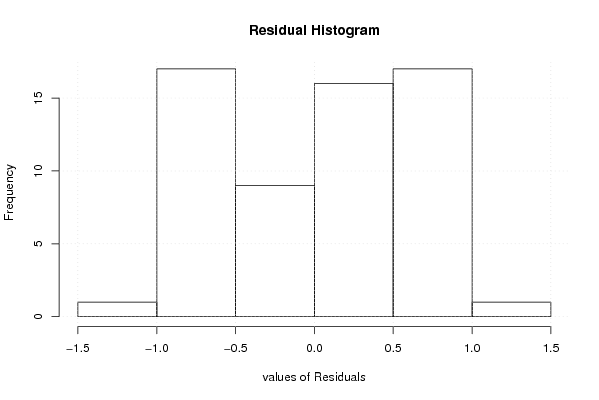
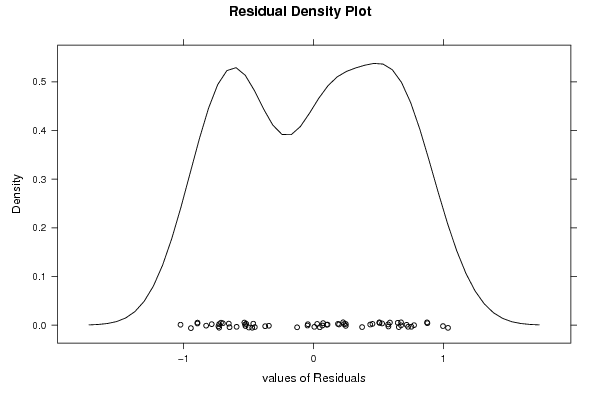
| Multiple Linear Regression - Residual Statistics | |
| Residual Standard Deviation | 0.663292578485196 |
| Sum Squared Residuals | 21.1179381443299 |
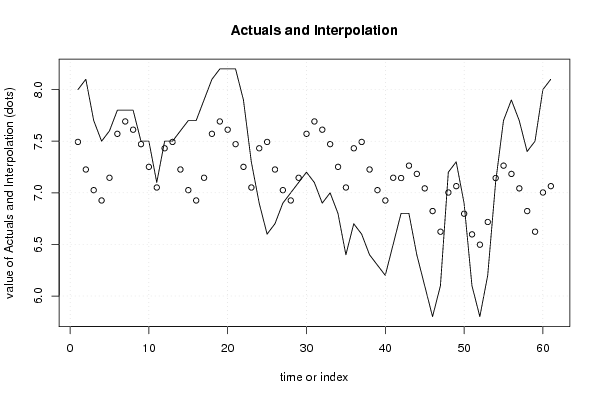
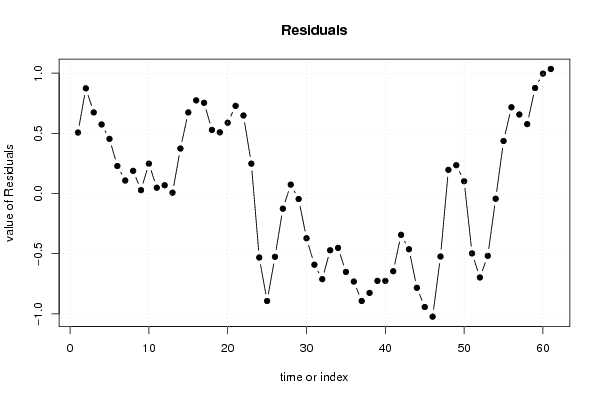
| Multiple Linear Regression - Actuals, Interpolation, and Residuals | |||
| Time or Index | Actuals | Interpolation Forecast | Residuals Prediction Error |
| 1 | 8 | 7.49278350515463 | 0.507216494845367 |
| 2 | 8.1 | 7.22567010309278 | 0.874329896907217 |
| 3 | 7.7 | 7.02567010309278 | 0.674329896907217 |
| 4 | 7.5 | 6.92567010309278 | 0.574329896907215 |
| 5 | 7.6 | 7.14567010309278 | 0.454329896907216 |
| 6 | 7.8 | 7.57134020618557 | 0.228659793814433 |
| 7 | 7.8 | 7.69134020618557 | 0.108659793814433 |
| 8 | 7.8 | 7.61134020618557 | 0.188659793814433 |
| 9 | 7.5 | 7.47134020618557 | 0.0286597938144331 |
| 10 | 7.5 | 7.25134020618557 | 0.248659793814433 |
| 11 | 7.1 | 7.05134020618557 | 0.0486597938144325 |
| 12 | 7.5 | 7.43134020618557 | 0.0686597938144325 |
| 13 | 7.5 | 7.49278350515464 | 0.00721649484536001 |
| 14 | 7.6 | 7.22567010309278 | 0.374329896907217 |
| 15 | 7.7 | 7.02567010309278 | 0.674329896907217 |
| 16 | 7.7 | 6.92567010309278 | 0.774329896907217 |
| 17 | 7.9 | 7.14567010309278 | 0.754329896907217 |
| 18 | 8.1 | 7.57134020618557 | 0.528659793814433 |
| 19 | 8.2 | 7.69134020618557 | 0.508659793814433 |
| 20 | 8.2 | 7.61134020618557 | 0.588659793814432 |
| 21 | 8.2 | 7.47134020618557 | 0.728659793814432 |
| 22 | 7.9 | 7.25134020618557 | 0.648659793814433 |
| 23 | 7.3 | 7.05134020618557 | 0.248659793814433 |
| 24 | 6.9 | 7.43134020618557 | -0.531340206185567 |
| 25 | 6.6 | 7.49278350515464 | -0.89278350515464 |
| 26 | 6.7 | 7.22567010309278 | -0.525670103092783 |
| 27 | 6.9 | 7.02567010309278 | -0.125670103092783 |
| 28 | 7 | 6.92567010309278 | 0.0743298969072169 |
| 29 | 7.1 | 7.14567010309278 | -0.0456701030927837 |
| 30 | 7.2 | 7.57134020618557 | -0.371340206185567 |
| 31 | 7.1 | 7.69134020618557 | -0.591340206185567 |
| 32 | 6.9 | 7.61134020618557 | -0.711340206185567 |
| 33 | 7 | 7.47134020618557 | -0.471340206185567 |
| 34 | 6.8 | 7.25134020618557 | -0.451340206185567 |
| 35 | 6.4 | 7.05134020618557 | -0.651340206185567 |
| 36 | 6.7 | 7.43134020618557 | -0.731340206185568 |
| 37 | 6.6 | 7.49278350515464 | -0.89278350515464 |
| 38 | 6.4 | 7.22567010309278 | -0.825670103092783 |
| 39 | 6.3 | 7.02567010309278 | -0.725670103092784 |
| 40 | 6.2 | 6.92567010309278 | -0.725670103092783 |
| 41 | 6.5 | 7.14567010309278 | -0.645670103092783 |
| 42 | 6.8 | 7.14298969072165 | -0.342989690721649 |
| 43 | 6.8 | 7.26298969072165 | -0.462989690721649 |
| 44 | 6.4 | 7.18298969072165 | -0.78298969072165 |
| 45 | 6.1 | 7.04298969072165 | -0.94298969072165 |
| 46 | 5.8 | 6.82298969072165 | -1.02298969072165 |
| 47 | 6.1 | 6.62298969072165 | -0.52298969072165 |
| 48 | 7.2 | 7.00298969072165 | 0.19701030927835 |
| 49 | 7.3 | 7.06443298969072 | 0.235567010309277 |
| 50 | 6.9 | 6.79731958762887 | 0.102680412371135 |
| 51 | 6.1 | 6.59731958762887 | -0.497319587628867 |
| 52 | 5.8 | 6.49731958762887 | -0.697319587628865 |
| 53 | 6.2 | 6.71731958762887 | -0.517319587628865 |
| 54 | 7.1 | 7.14298969072165 | -0.0429896907216496 |
| 55 | 7.7 | 7.26298969072165 | 0.437010309278351 |
| 56 | 7.9 | 7.18298969072165 | 0.717010309278351 |
| 57 | 7.7 | 7.04298969072165 | 0.657010309278351 |
| 58 | 7.4 | 6.82298969072165 | 0.577010309278351 |
| 59 | 7.5 | 6.62298969072165 | 0.87701030927835 |
| 60 | 8 | 7.00298969072165 | 0.99701030927835 |
| 61 | 8.1 | 7.06443298969072 | 1.03556701030928 |
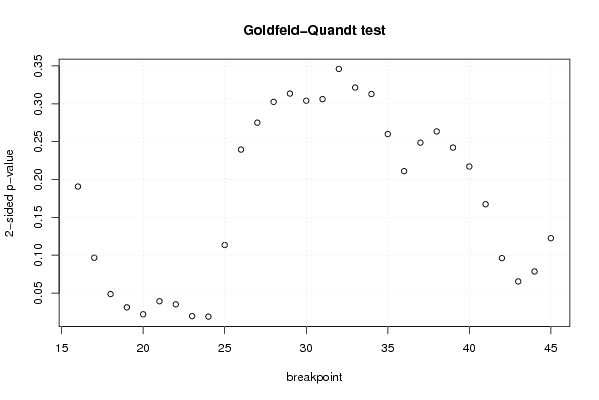
| Goldfeld-Quandt test for Heteroskedasticity | |||
| p-values | Alternative Hypothesis | ||
| breakpoint index | greater | 2-sided | less |
| 16 | 0.0953793667316105 | 0.190758733463221 | 0.90462063326839 |
| 17 | 0.0483540671206405 | 0.096708134241281 | 0.95164593287936 |
| 18 | 0.0243475170311011 | 0.0486950340622023 | 0.975652482968899 |
| 19 | 0.0155892021620359 | 0.0311784043240718 | 0.984410797837964 |
| 20 | 0.0109927949238662 | 0.0219855898477323 | 0.989007205076134 |
| 21 | 0.0196141655782057 | 0.0392283311564113 | 0.980385834421794 |
| 22 | 0.0175842421751386 | 0.0351684843502772 | 0.982415757824861 |
| 23 | 0.00976926058884005 | 0.0195385211776801 | 0.99023073941116 |
| 24 | 0.0094380431986718 | 0.0188760863973436 | 0.990561956801328 |
| 25 | 0.0567596484800693 | 0.113519296960139 | 0.943240351519931 |
| 26 | 0.119787631532279 | 0.239575263064557 | 0.880212368467721 |
| 27 | 0.137556716923897 | 0.275113433847793 | 0.862443283076103 |
| 28 | 0.151320016471579 | 0.302640032943158 | 0.84867998352842 |
| 29 | 0.156793986789835 | 0.313587973579669 | 0.843206013210165 |
| 30 | 0.152067505644162 | 0.304135011288323 | 0.847932494355838 |
| 31 | 0.153091945772326 | 0.306183891544653 | 0.846908054227673 |
| 32 | 0.173047313956359 | 0.346094627912718 | 0.826952686043641 |
| 33 | 0.160767358160553 | 0.321534716321107 | 0.839232641839447 |
| 34 | 0.156476175523885 | 0.31295235104777 | 0.843523824476115 |
| 35 | 0.130028691014554 | 0.260057382029108 | 0.869971308985446 |
| 36 | 0.105551645866392 | 0.211103291732784 | 0.894448354133608 |
| 37 | 0.124369743336329 | 0.248739486672658 | 0.875630256663671 |
| 38 | 0.131775862374726 | 0.263551724749451 | 0.868224137625274 |
| 39 | 0.121113333600433 | 0.242226667200867 | 0.878886666399567 |
| 40 | 0.108580411073130 | 0.217160822146261 | 0.89141958892687 |
| 41 | 0.083678964882828 | 0.167357929765656 | 0.916321035117172 |
| 42 | 0.0481182690631435 | 0.096236538126287 | 0.951881730936857 |
| 43 | 0.0327098088619943 | 0.0654196177239886 | 0.967290191138006 |
| 44 | 0.0392898552201762 | 0.0785797104403524 | 0.960710144779824 |
| 45 | 0.0612634952180893 | 0.122526990436179 | 0.93873650478191 |
| Meta Analysis of Goldfeld-Quandt test for Heteroskedasticity | |||
| Description | # significant tests | % significant tests | OK/NOK |
| 1% type I error level | 0 | 0 | OK |
| 5% type I error level | 7 | 0.233333333333333 | NOK |
| 10% type I error level | 11 | 0.366666666666667 | NOK |