| Multiple Linear Regression - Estimated Regression Equation |
| Y[t] = + 7.30487804878049 -0.359878048780488X[t] + e[t] |
| Multiple Linear Regression - Ordinary Least Squares | |||||
| Variable | Parameter | S.D. | T-STAT H0: parameter = 0 | 2-tail p-value | 1-tail p-value |
| (Intercept) | 7.30487804878049 | 0.100902 | 72.3955 | 0 | 0 |
| X | -0.359878048780488 | 0.176218 | -2.0422 | 0.045607 | 0.022803 |
| Multiple Linear Regression - Regression Statistics | |
| Multiple R | 0.256948656215148 |
| R-squared | 0.0660226119307705 |
| Adjusted R-squared | 0.0501924867092582 |
| F-TEST (value) | 4.17069423058316 |
| F-TEST (DF numerator) | 1 |
| F-TEST (DF denominator) | 59 |
| p-value | 0.0456065207076984 |
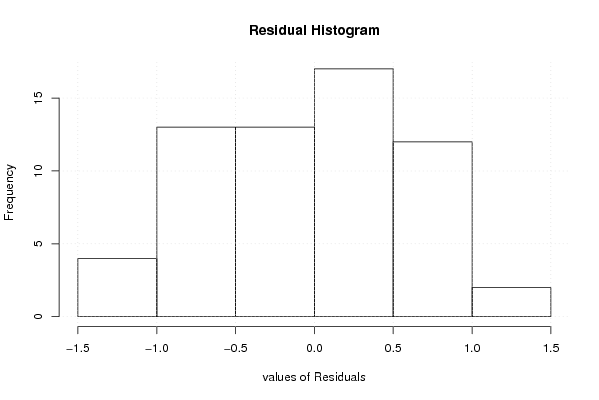
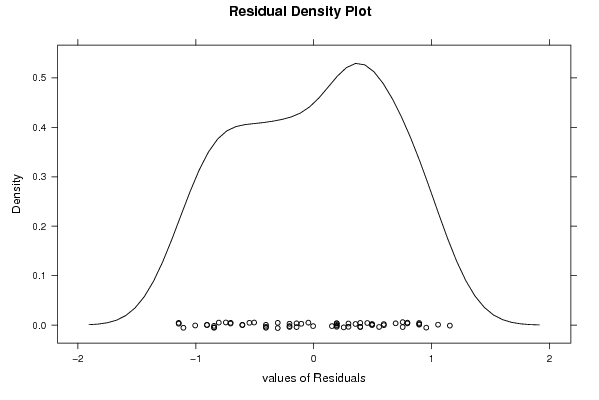
| Multiple Linear Regression - Residual Statistics | |
| Residual Standard Deviation | 0.646090254363734 |
| Sum Squared Residuals | 24.6285243902439 |
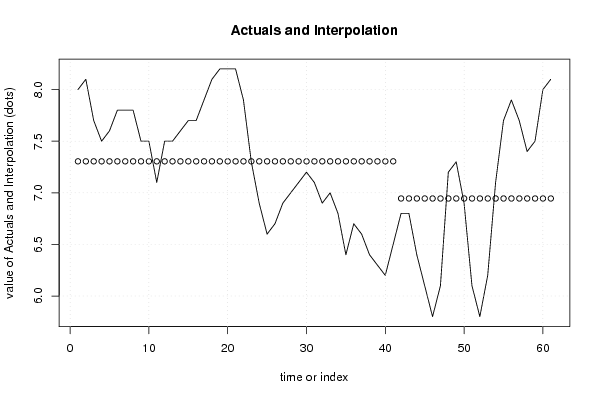
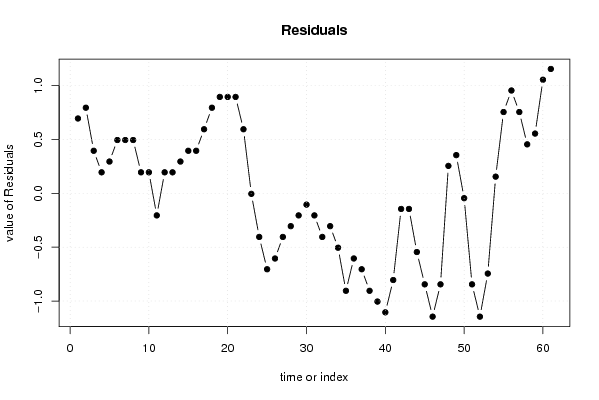
| Multiple Linear Regression - Actuals, Interpolation, and Residuals | |||
| Time or Index | Actuals | Interpolation Forecast | Residuals Prediction Error |
| 1 | 8 | 7.30487804878048 | 0.695121951219518 |
| 2 | 8.1 | 7.30487804878049 | 0.795121951219512 |
| 3 | 7.7 | 7.30487804878049 | 0.395121951219512 |
| 4 | 7.5 | 7.30487804878049 | 0.195121951219512 |
| 5 | 7.6 | 7.30487804878049 | 0.295121951219512 |
| 6 | 7.8 | 7.30487804878049 | 0.495121951219512 |
| 7 | 7.8 | 7.30487804878049 | 0.495121951219512 |
| 8 | 7.8 | 7.30487804878049 | 0.495121951219512 |
| 9 | 7.5 | 7.30487804878049 | 0.195121951219512 |
| 10 | 7.5 | 7.30487804878049 | 0.195121951219512 |
| 11 | 7.1 | 7.30487804878049 | -0.204878048780488 |
| 12 | 7.5 | 7.30487804878049 | 0.195121951219512 |
| 13 | 7.5 | 7.30487804878049 | 0.195121951219512 |
| 14 | 7.6 | 7.30487804878049 | 0.295121951219512 |
| 15 | 7.7 | 7.30487804878049 | 0.395121951219512 |
| 16 | 7.7 | 7.30487804878049 | 0.395121951219512 |
| 17 | 7.9 | 7.30487804878049 | 0.595121951219513 |
| 18 | 8.1 | 7.30487804878049 | 0.795121951219512 |
| 19 | 8.2 | 7.30487804878049 | 0.895121951219511 |
| 20 | 8.2 | 7.30487804878049 | 0.895121951219511 |
| 21 | 8.2 | 7.30487804878049 | 0.895121951219511 |
| 22 | 7.9 | 7.30487804878049 | 0.595121951219513 |
| 23 | 7.3 | 7.30487804878049 | -0.00487804878048807 |
| 24 | 6.9 | 7.30487804878049 | -0.404878048780487 |
| 25 | 6.6 | 7.30487804878049 | -0.704878048780488 |
| 26 | 6.7 | 7.30487804878049 | -0.604878048780488 |
| 27 | 6.9 | 7.30487804878049 | -0.404878048780487 |
| 28 | 7 | 7.30487804878049 | -0.304878048780488 |
| 29 | 7.1 | 7.30487804878049 | -0.204878048780488 |
| 30 | 7.2 | 7.30487804878049 | -0.104878048780488 |
| 31 | 7.1 | 7.30487804878049 | -0.204878048780488 |
| 32 | 6.9 | 7.30487804878049 | -0.404878048780487 |
| 33 | 7 | 7.30487804878049 | -0.304878048780488 |
| 34 | 6.8 | 7.30487804878049 | -0.504878048780488 |
| 35 | 6.4 | 7.30487804878049 | -0.904878048780488 |
| 36 | 6.7 | 7.30487804878049 | -0.604878048780488 |
| 37 | 6.6 | 7.30487804878049 | -0.704878048780488 |
| 38 | 6.4 | 7.30487804878049 | -0.904878048780488 |
| 39 | 6.3 | 7.30487804878049 | -1.00487804878049 |
| 40 | 6.2 | 7.30487804878049 | -1.10487804878049 |
| 41 | 6.5 | 7.30487804878049 | -0.804878048780488 |
| 42 | 6.8 | 6.945 | -0.145000000000000 |
| 43 | 6.8 | 6.945 | -0.145000000000000 |
| 44 | 6.4 | 6.945 | -0.545 |
| 45 | 6.1 | 6.945 | -0.845 |
| 46 | 5.8 | 6.945 | -1.145 |
| 47 | 6.1 | 6.945 | -0.845 |
| 48 | 7.2 | 6.945 | 0.255 |
| 49 | 7.3 | 6.945 | 0.355 |
| 50 | 6.9 | 6.945 | -0.0449999999999997 |
| 51 | 6.1 | 6.945 | -0.845 |
| 52 | 5.8 | 6.945 | -1.145 |
| 53 | 6.2 | 6.945 | -0.745 |
| 54 | 7.1 | 6.945 | 0.155000000000000 |
| 55 | 7.7 | 6.945 | 0.755 |
| 56 | 7.9 | 6.945 | 0.955 |
| 57 | 7.7 | 6.945 | 0.755 |
| 58 | 7.4 | 6.945 | 0.455 |
| 59 | 7.5 | 6.945 | 0.555 |
| 60 | 8 | 6.945 | 1.055 |
| 61 | 8.1 | 6.945 | 1.155 |
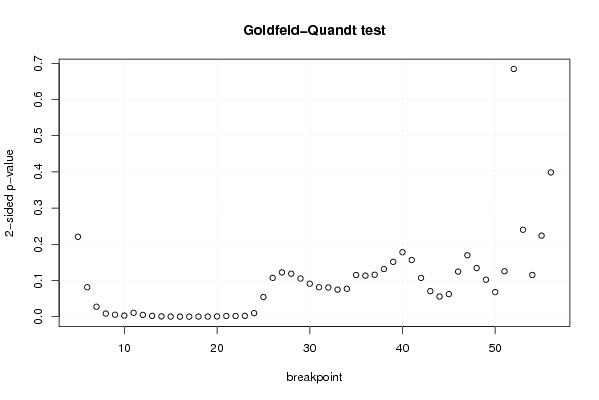
| Goldfeld-Quandt test for Heteroskedasticity | |||
| p-values | Alternative Hypothesis | ||
| breakpoint index | greater | 2-sided | less |
| 5 | 0.110302267475276 | 0.220604534950553 | 0.889697732524724 |
| 6 | 0.0406779196453908 | 0.0813558392907816 | 0.95932208035461 |
| 7 | 0.0137628158657740 | 0.0275256317315480 | 0.986237184134226 |
| 8 | 0.00433976423617628 | 0.00867952847235256 | 0.995660235763824 |
| 9 | 0.00267857615942861 | 0.00535715231885722 | 0.997321423840571 |
| 10 | 0.00142888888723015 | 0.0028577777744603 | 0.99857111111277 |
| 11 | 0.00532505267216458 | 0.0106501053443292 | 0.994674947327835 |
| 12 | 0.00243958605574751 | 0.00487917211149502 | 0.997560413944252 |
| 13 | 0.00107012896945466 | 0.00214025793890931 | 0.998929871030545 |
| 14 | 0.000411761434482467 | 0.000823522868964933 | 0.999588238565517 |
| 15 | 0.000159184406919298 | 0.000318368813838596 | 0.99984081559308 |
| 16 | 6.02970242099036e-05 | 0.000120594048419807 | 0.99993970297579 |
| 17 | 3.81328847550035e-05 | 7.6265769510007e-05 | 0.999961867115245 |
| 18 | 6.57123831294717e-05 | 0.000131424766258943 | 0.99993428761687 |
| 19 | 0.000177807812158332 | 0.000355615624316664 | 0.999822192187842 |
| 20 | 0.000419687217221266 | 0.000839374434442532 | 0.999580312782779 |
| 21 | 0.00099501251094332 | 0.00199002502188664 | 0.999004987489057 |
| 22 | 0.000945005598180436 | 0.00189001119636087 | 0.99905499440182 |
| 23 | 0.00119069200007553 | 0.00238138400015106 | 0.998809307999925 |
| 24 | 0.0048585061497506 | 0.0097170122995012 | 0.99514149385025 |
| 25 | 0.0270769676793208 | 0.0541539353586415 | 0.972923032320679 |
| 26 | 0.0535750066316422 | 0.107150013263284 | 0.946424993368358 |
| 27 | 0.0611394564567509 | 0.122278912913502 | 0.93886054354325 |
| 28 | 0.0593573484381841 | 0.118714696876368 | 0.940642651561816 |
| 29 | 0.052755358193442 | 0.105510716386884 | 0.947244641806558 |
| 30 | 0.0454798851328147 | 0.0909597702656294 | 0.954520114867185 |
| 31 | 0.0406686001204387 | 0.0813372002408774 | 0.959331399879561 |
| 32 | 0.0403260453934386 | 0.0806520907868771 | 0.959673954606561 |
| 33 | 0.0373845163174436 | 0.0747690326348872 | 0.962615483682556 |
| 34 | 0.0385390391116068 | 0.0770780782232136 | 0.961460960888393 |
| 35 | 0.0574796525920831 | 0.114959305184166 | 0.942520347407917 |
| 36 | 0.0567060347831372 | 0.113412069566274 | 0.943293965216863 |
| 37 | 0.0578974434468685 | 0.115794886893737 | 0.942102556553132 |
| 38 | 0.0658303875666323 | 0.131660775133265 | 0.934169612433368 |
| 39 | 0.0757368179422416 | 0.151473635884483 | 0.924263182057758 |
| 40 | 0.0889984380819412 | 0.177996876163882 | 0.911001561918059 |
| 41 | 0.0782648382976196 | 0.156529676595239 | 0.92173516170238 |
| 42 | 0.0534942245223366 | 0.106988449044673 | 0.946505775477663 |
| 43 | 0.0352760202704949 | 0.0705520405409898 | 0.964723979729505 |
| 44 | 0.0278423535849081 | 0.0556847071698163 | 0.972157646415092 |
| 45 | 0.0311113796344805 | 0.0622227592689609 | 0.96888862036552 |
| 46 | 0.062286170849134 | 0.124572341698268 | 0.937713829150866 |
| 47 | 0.084810421641936 | 0.169620843283872 | 0.915189578358064 |
| 48 | 0.0670700816622988 | 0.134140163324598 | 0.932929918337701 |
| 49 | 0.0510907359076763 | 0.102181471815353 | 0.948909264092324 |
| 50 | 0.0339365944875603 | 0.0678731889751206 | 0.96606340551244 |
| 51 | 0.0627607417239202 | 0.125521483447840 | 0.93723925827608 |
| 52 | 0.342155754363544 | 0.684311508727088 | 0.657844245636456 |
| 53 | 0.879923465737701 | 0.240153068524598 | 0.120076534262299 |
| 54 | 0.942371536573815 | 0.115256926852369 | 0.0576284634261846 |
| 55 | 0.888037592171673 | 0.223924815656654 | 0.111962407828327 |
| 56 | 0.800727562599092 | 0.398544874801816 | 0.199272437400908 |
| Meta Analysis of Goldfeld-Quandt test for Heteroskedasticity | |||
| Description | # significant tests | % significant tests | OK/NOK |
| 1% type I error level | 16 | 0.307692307692308 | NOK |
| 5% type I error level | 18 | 0.346153846153846 | NOK |
| 10% type I error level | 29 | 0.557692307692308 | NOK |