| Multiple Linear Regression - Estimated Regression Equation |
| TW[t] = + 0.137478831210173 + 0.53055726280852WM[t] + 0.43158336885857WV[t] + 0.00605746119417265WJ[t] + 0.00172169418001913M1[t] + 0.00222234476380082M2[t] + 0.0287546597955706M3[t] + 0.0101104864524246M4[t] + 0.0303651906903672M5[t] + 0.0148706587567332M6[t] + 0.0254744210331318M7[t] + 0.0123528305229541M8[t] -0.00557343797333338M9[t] -0.0101279204730681M10[t] + 0.0287035908541254M11[t] + 0.000459327773782868t + e[t] |
| Multiple Linear Regression - Ordinary Least Squares | |||||
| Variable | Parameter | S.D. | T-STAT H0: parameter = 0 | 2-tail p-value | 1-tail p-value |
| (Intercept) | 0.137478831210173 | 0.10248 | 1.3415 | 0.186482 | 0.093241 |
| WM | 0.53055726280852 | 0.013579 | 39.073 | 0 | 0 |
| WV | 0.43158336885857 | 0.013553 | 31.8441 | 0 | 0 |
| WJ | 0.00605746119417265 | 0.005799 | 1.0446 | 0.301767 | 0.150884 |
| M1 | 0.00172169418001913 | 0.020053 | 0.0859 | 0.93196 | 0.46598 |
| M2 | 0.00222234476380082 | 0.022019 | 0.1009 | 0.920057 | 0.460028 |
| M3 | 0.0287546597955706 | 0.024511 | 1.1731 | 0.246915 | 0.123458 |
| M4 | 0.0101104864524246 | 0.026524 | 0.3812 | 0.704858 | 0.352429 |
| M5 | 0.0303651906903672 | 0.02876 | 1.0558 | 0.296692 | 0.148346 |
| M6 | 0.0148706587567332 | 0.029743 | 0.5 | 0.619535 | 0.309767 |
| M7 | 0.0254744210331318 | 0.029985 | 0.8496 | 0.400056 | 0.200028 |
| M8 | 0.0123528305229541 | 0.028821 | 0.4286 | 0.670252 | 0.335126 |
| M9 | -0.00557343797333338 | 0.029608 | -0.1882 | 0.851535 | 0.425767 |
| M10 | -0.0101279204730681 | 0.027349 | -0.3703 | 0.712882 | 0.356441 |
| M11 | 0.0287035908541254 | 0.021024 | 1.3653 | 0.178957 | 0.089478 |
| t | 0.000459327773782868 | 0.000521 | 0.881 | 0.382987 | 0.191493 |
| Multiple Linear Regression - Regression Statistics | |
| Multiple R | 0.999124703391936 |
| R-squared | 0.998250172928024 |
| Adjusted R-squared | 0.997666897237365 |
| F-TEST (value) | 1711.45512990729 |
| F-TEST (DF numerator) | 15 |
| F-TEST (DF denominator) | 45 |
| p-value | 0 |
| Multiple Linear Regression - Residual Statistics | |
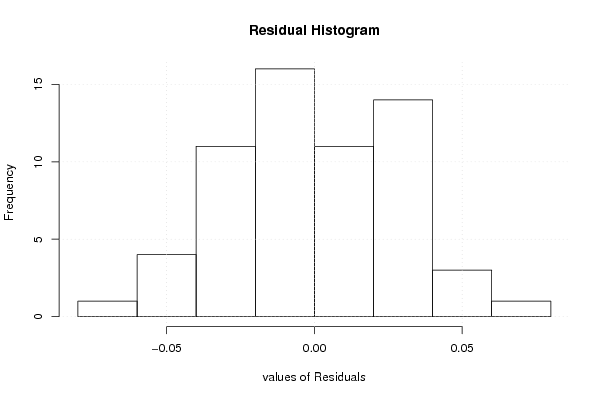
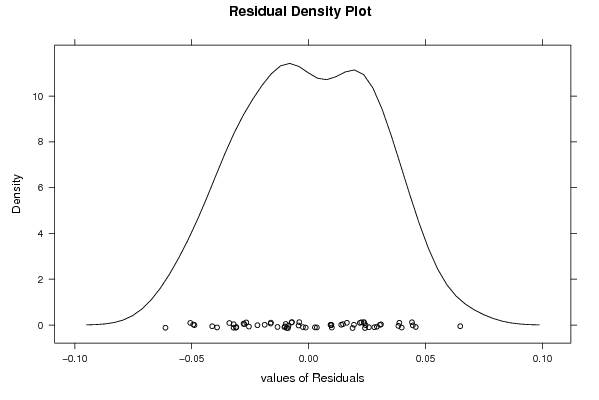
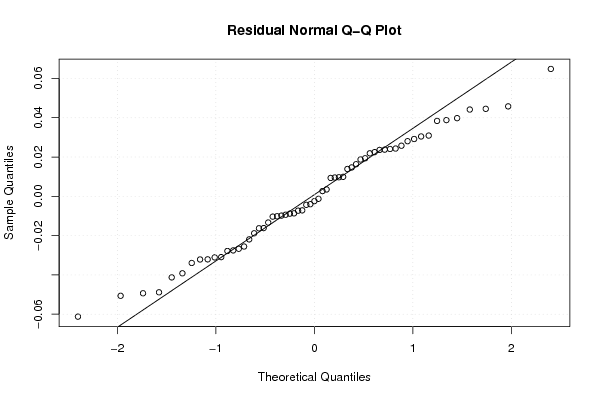
| Residual Standard Deviation | 0.0328859962513968 |
| Sum Squared Residuals | 0.0486669937251097 |
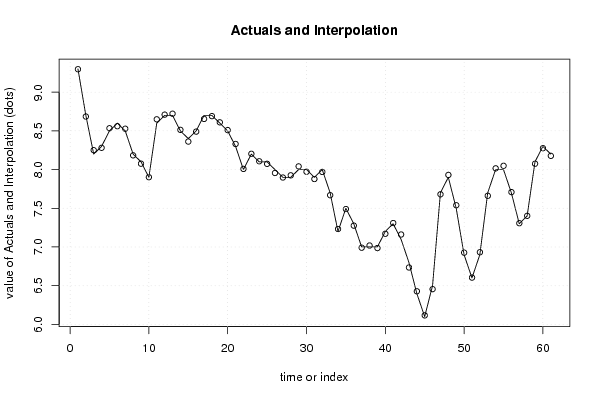
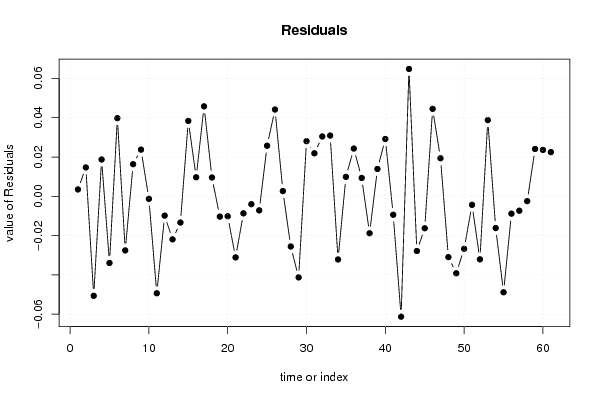
| Multiple Linear Regression - Actuals, Interpolation, and Residuals | |||
| Time or Index | Actuals | Interpolation Forecast | Residuals Prediction Error |
| 1 | 9.3 | 9.29650340904222 | 0.00349659095777864 |
| 2 | 8.7 | 8.68530627403474 | 0.0146937259652613 |
| 3 | 8.2 | 8.25062208516163 | -0.0506220851616339 |
| 4 | 8.3 | 8.2812527430372 | 0.0187472569627983 |
| 5 | 8.5 | 8.5339187615517 | -0.0339187615516996 |
| 6 | 8.6 | 8.56022465591945 | 0.0397753440805461 |
| 7 | 8.5 | 8.52752366296436 | -0.027523662964361 |
| 8 | 8.2 | 8.1836666199614 | 0.0163333800386 |
| 9 | 8.1 | 8.07624852875068 | 0.0237514712493222 |
| 10 | 7.9 | 7.90127156742892 | -0.00127156742892187 |
| 11 | 8.6 | 8.64933387769675 | -0.0493338776967554 |
| 12 | 8.7 | 8.7098292728658 | -0.00982927286579663 |
| 13 | 8.7 | 8.72190768421459 | -0.0219076842145930 |
| 14 | 8.5 | 8.51333889082136 | -0.0133388908213639 |
| 15 | 8.4 | 8.36163972488932 | 0.0383602751106846 |
| 16 | 8.5 | 8.49030168428984 | 0.00969831571015457 |
| 17 | 8.7 | 8.65422804455496 | 0.0457719554450405 |
| 18 | 8.7 | 8.6904313283177 | 0.00956867168229146 |
| 19 | 8.6 | 8.61033177564084 | -0.0103317756408372 |
| 20 | 8.5 | 8.5101413468939 | -0.0101413468938939 |
| 21 | 8.3 | 8.33108424285116 | -0.0310842428511637 |
| 22 | 8 | 8.0086547304401 | -0.00865473044009996 |
| 23 | 8.2 | 8.20400771204238 | -0.00400771204238111 |
| 24 | 8.1 | 8.10715316672712 | -0.0071531667271162 |
| 25 | 8.1 | 8.0742560028318 | 0.0257439971681949 |
| 26 | 8 | 7.95584381141111 | 0.0441561885888876 |
| 27 | 7.9 | 7.89732997804869 | 0.00267002195131358 |
| 28 | 7.9 | 7.92553765144659 | -0.0255376514465853 |
| 29 | 8 | 8.04125425438619 | -0.0412542543861857 |
| 30 | 8 | 7.97195183170665 | 0.0280481682933523 |
| 31 | 7.9 | 7.87811496143396 | 0.0218850385660404 |
| 32 | 8 | 7.9695414614167 | 0.0304585385833016 |
| 33 | 7.7 | 7.66908949775314 | 0.0309105022468588 |
| 34 | 7.2 | 7.23213378451916 | -0.0321337845191584 |
| 35 | 7.5 | 7.49010528457281 | 0.00989471542718605 |
| 36 | 7.3 | 7.27569580783754 | 0.0243041921624555 |
| 37 | 7 | 6.99065158401437 | 0.00934841598562683 |
| 38 | 7 | 7.01881504866863 | -0.0188150486686268 |
| 39 | 7 | 6.98608775787974 | 0.0139122421202625 |
| 40 | 7.2 | 7.1708341741582 | 0.0291658258417955 |
| 41 | 7.3 | 7.30937428648488 | -0.0093742864848813 |
| 42 | 7.1 | 7.16122959495096 | -0.0612295949509557 |
| 43 | 6.8 | 6.73519190365719 | 0.064808096342815 |
| 44 | 6.4 | 6.42782999022649 | -0.0278299902264897 |
| 45 | 6.1 | 6.1162691449291 | -0.0162691449291033 |
| 46 | 6.5 | 6.45548369285806 | 0.0445163071419366 |
| 47 | 7.7 | 7.68063663668493 | 0.0193633633150733 |
| 48 | 7.9 | 7.9309317222254 | -0.030931722225397 |
| 49 | 7.5 | 7.5391702997211 | -0.0391702997211052 |
| 50 | 6.9 | 6.92669597506416 | -0.0266959750641583 |
| 51 | 6.6 | 6.60432045402063 | -0.00432045402062672 |
| 52 | 6.9 | 6.93207374706816 | -0.0320737470681631 |
| 53 | 7.7 | 7.66122465302227 | 0.0387753469777261 |
| 54 | 8 | 8.01616258910523 | -0.0161625891052341 |
| 55 | 8 | 8.04883769630366 | -0.0488376963036572 |
| 56 | 7.7 | 7.70882058150152 | -0.00882058150151811 |
| 57 | 7.3 | 7.30730858571591 | -0.00730858571591397 |
| 58 | 7.4 | 7.40245622475376 | -0.00245622475375642 |
| 59 | 8.1 | 8.07591648900312 | 0.0240835109968771 |
| 60 | 8.3 | 8.27639003034415 | 0.0236099696558543 |
| 61 | 8.2 | 8.1775110201759 | 0.0224889798240978 |
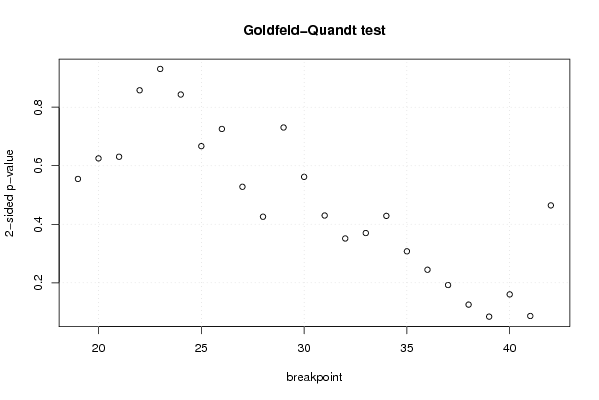
| Goldfeld-Quandt test for Heteroskedasticity | |||
| p-values | Alternative Hypothesis | ||
| breakpoint index | greater | 2-sided | less |
| 19 | 0.722588674746764 | 0.554822650506471 | 0.277411325253236 |
| 20 | 0.687425213763233 | 0.625149572473535 | 0.312574786236767 |
| 21 | 0.684674453356894 | 0.630651093286211 | 0.315325546643106 |
| 22 | 0.57107065110153 | 0.857858697796941 | 0.428929348898471 |
| 23 | 0.465389168655737 | 0.930778337311473 | 0.534610831344263 |
| 24 | 0.421715763332365 | 0.84343152666473 | 0.578284236667635 |
| 25 | 0.333455014008192 | 0.666910028016383 | 0.666544985991808 |
| 26 | 0.362840352521222 | 0.725680705042444 | 0.637159647478778 |
| 27 | 0.264014681273175 | 0.52802936254635 | 0.735985318726825 |
| 28 | 0.212857152789654 | 0.425714305579307 | 0.787142847210346 |
| 29 | 0.365349575539329 | 0.730699151078659 | 0.634650424460671 |
| 30 | 0.280987758241995 | 0.561975516483991 | 0.719012241758005 |
| 31 | 0.214931986571461 | 0.429863973142922 | 0.785068013428539 |
| 32 | 0.175677993820572 | 0.351355987641144 | 0.824322006179428 |
| 33 | 0.184978849072291 | 0.369957698144582 | 0.815021150927709 |
| 34 | 0.214301494750280 | 0.428602989500561 | 0.78569850524972 |
| 35 | 0.153742187772963 | 0.307484375545926 | 0.846257812227037 |
| 36 | 0.122261141599768 | 0.244522283199537 | 0.877738858400232 |
| 37 | 0.096120984780465 | 0.19224196956093 | 0.903879015219535 |
| 38 | 0.0626358128810349 | 0.125271625762070 | 0.937364187118965 |
| 39 | 0.0420973604448456 | 0.0841947208896911 | 0.957902639555154 |
| 40 | 0.0801339828834318 | 0.160267965766864 | 0.919866017116568 |
| 41 | 0.0432364430688374 | 0.0864728861376748 | 0.956763556931163 |
| 42 | 0.232236180053360 | 0.464472360106719 | 0.76776381994664 |
| Meta Analysis of Goldfeld-Quandt test for Heteroskedasticity | |||
| Description | # significant tests | % significant tests | OK/NOK |
| 1% type I error level | 0 | 0 | OK |
| 5% type I error level | 0 | 0 | OK |
| 10% type I error level | 2 | 0.0833333333333333 | OK |