| Multiple Linear Regression - Estimated Regression Equation |
| TW[t] = + 0.213248198481854 + 0.527823582814739WM[t] + 0.421384268649569WV[t] + 0.00838439145702868WJ[t] + 0.00112705179224741M1[t] -0.000597572515737364M2[t] + 0.0260612098421007M3[t] + 0.0101492243658692M4[t] + 0.0331631595605292M5[t] + 0.0182520149957518M6[t] + 0.0279408241045159M7[t] + 0.0125698503514514M8[t] -0.00644616521266334M9[t] -0.0114890758015339M10[t] + 0.0275237939749787M11[t] + e[t] |
| Multiple Linear Regression - Ordinary Least Squares | |||||
| Variable | Parameter | S.D. | T-STAT H0: parameter = 0 | 2-tail p-value | 1-tail p-value |
| (Intercept) | 0.213248198481854 | 0.055594 | 3.8358 | 0.000379 | 0.00019 |
| WM | 0.527823582814739 | 0.013187 | 40.0256 | 0 | 0 |
| WV | 0.421384268649569 | 0.007031 | 59.9362 | 0 | 0 |
| WJ | 0.00838439145702868 | 0.00515 | 1.6282 | 0.11032 | 0.05516 |
| M1 | 0.00112705179224741 | 0.019993 | 0.0564 | 0.955288 | 0.477644 |
| M2 | -0.000597572515737364 | 0.021732 | -0.0275 | 0.978182 | 0.489091 |
| M3 | 0.0260612098421007 | 0.02426 | 1.0742 | 0.288323 | 0.144161 |
| M4 | 0.0101492243658692 | 0.026459 | 0.3836 | 0.703055 | 0.351527 |
| M5 | 0.0331631595605292 | 0.028515 | 1.163 | 0.250819 | 0.12541 |
| M6 | 0.0182520149957518 | 0.029423 | 0.6203 | 0.538098 | 0.269049 |
| M7 | 0.0279408241045159 | 0.029781 | 0.9382 | 0.353037 | 0.176519 |
| M8 | 0.0125698503514514 | 0.028749 | 0.4372 | 0.663997 | 0.331999 |
| M9 | -0.00644616521266334 | 0.02952 | -0.2184 | 0.828107 | 0.414054 |
| M10 | -0.0114890758015339 | 0.027239 | -0.4218 | 0.675145 | 0.337572 |
| M11 | 0.0275237939749787 | 0.02093 | 1.315 | 0.195023 | 0.097511 |
| Multiple Linear Regression - Regression Statistics | |
| Multiple R | 0.999109598718977 |
| R-squared | 0.998219990252394 |
| Adjusted R-squared | 0.997678248155297 |
| F-TEST (value) | 1842.61107933234 |
| F-TEST (DF numerator) | 14 |
| F-TEST (DF denominator) | 46 |
| p-value | 0 |
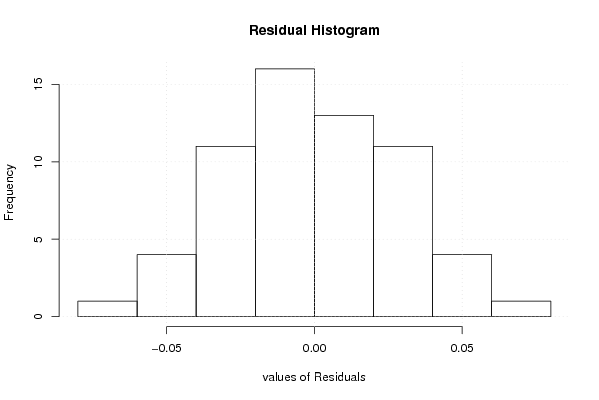
| Multiple Linear Regression - Residual Statistics | |
| Residual Standard Deviation | 0.0328059008988326 |
| Sum Squared Residuals | 0.0495064481540651 |
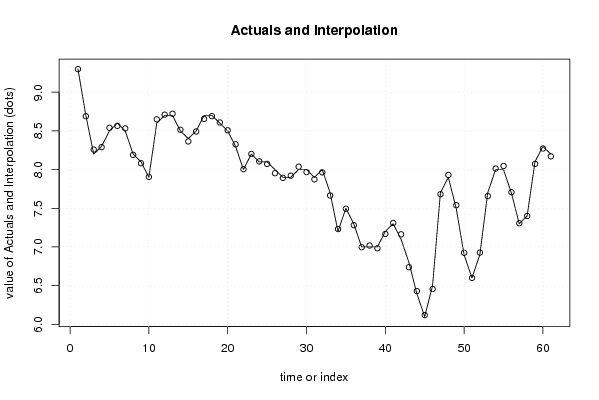
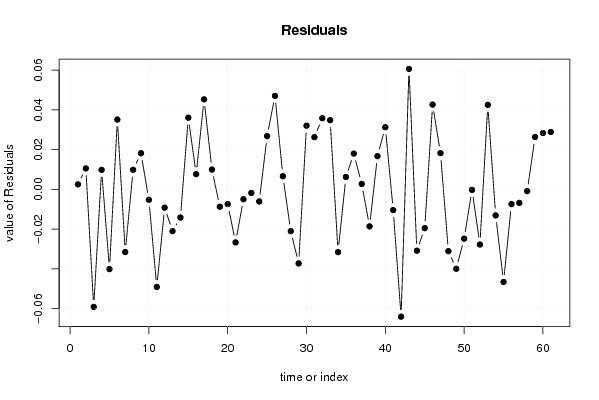
| Multiple Linear Regression - Actuals, Interpolation, and Residuals | |||
| Time or Index | Actuals | Interpolation Forecast | Residuals Prediction Error |
| 1 | 9.3 | 9.29747522065373 | 0.00252477934627300 |
| 2 | 8.7 | 8.68944497766688 | 0.0105550223331183 |
| 3 | 8.2 | 8.25917816306516 | -0.059178163065164 |
| 4 | 8.3 | 8.29017946185049 | 0.00982053814951402 |
| 5 | 8.5 | 8.54014275932875 | -0.0401427593287484 |
| 6 | 8.6 | 8.56485472419182 | 0.0351452758081805 |
| 7 | 8.5 | 8.53156666728992 | -0.0315666672899237 |
| 8 | 8.2 | 8.19013335037831 | 0.00986664962168678 |
| 9 | 8.1 | 8.08180984621007 | 0.0181901537899325 |
| 10 | 7.9 | 7.90526061192315 | -0.0052606119231483 |
| 11 | 8.6 | 8.64910941958539 | -0.0491094195853866 |
| 12 | 8.7 | 8.70921623592313 | -0.00921623592313388 |
| 13 | 8.7 | 8.7209872191319 | -0.0209872191318976 |
| 14 | 8.5 | 8.51418375704143 | -0.0141837570414279 |
| 15 | 8.4 | 8.3639044404824 | 0.0360955595175908 |
| 16 | 8.5 | 8.49234184185127 | 0.00765815814872786 |
| 17 | 8.7 | 8.6546745290168 | 0.0453254709831916 |
| 18 | 8.7 | 8.6900304252964 | 0.00996957470360378 |
| 19 | 8.6 | 8.60873486750962 | -0.00873486750962285 |
| 20 | 8.5 | 8.50741016173524 | -0.00741016173523876 |
| 21 | 8.3 | 8.32669331474389 | -0.0266933147438904 |
| 22 | 8 | 8.00495625446618 | -0.00495625446617654 |
| 23 | 8.2 | 8.20180779357316 | -0.00180779357315876 |
| 24 | 8.1 | 8.10608285250359 | -0.00608285250359102 |
| 25 | 8.1 | 8.0732000914103 | 0.0267999085897094 |
| 26 | 8 | 7.95293302300922 | 0.047066976990777 |
| 27 | 7.9 | 7.89338229586812 | 0.00661770413187936 |
| 28 | 7.9 | 7.92102983807063 | -0.0210298380706314 |
| 29 | 8 | 8.03728768012032 | -0.0372876801203169 |
| 30 | 8 | 7.96791729898266 | 0.0320827010173405 |
| 31 | 7.9 | 7.87371826981988 | 0.0262817301801185 |
| 32 | 8 | 7.96416779010739 | 0.0358322098926148 |
| 33 | 7.7 | 7.66516427650058 | 0.0348357234994248 |
| 34 | 7.2 | 7.2315922852954 | -0.0315922852954016 |
| 35 | 7.5 | 7.49372851371527 | 0.00627148628472959 |
| 36 | 7.3 | 7.28197644598973 | 0.0180235540102706 |
| 37 | 7 | 6.99724692571936 | 0.00275307428063837 |
| 38 | 7 | 7.01863240540279 | -0.0186324054027878 |
| 39 | 7 | 6.98328599887642 | 0.0167140011235795 |
| 40 | 7.2 | 7.16869795425527 | 0.0313020457447297 |
| 41 | 7.3 | 7.3104358548665 | -0.0104358548665042 |
| 42 | 7.1 | 7.16407879483264 | -0.0640787948326388 |
| 43 | 6.8 | 6.73936944930518 | 0.0606305506948204 |
| 44 | 6.4 | 6.43085172865579 | -0.0308517286557931 |
| 45 | 6.1 | 6.11952740534106 | -0.0195274053410608 |
| 46 | 6.5 | 6.45731562082479 | 0.0426843791752061 |
| 47 | 7.7 | 7.68174784284975 | 0.0182521571502456 |
| 48 | 7.9 | 7.93111356781228 | -0.0311135678122797 |
| 49 | 7.5 | 7.53998089183326 | -0.0399808918332619 |
| 50 | 6.9 | 6.92480583687968 | -0.0248058368796796 |
| 51 | 6.6 | 6.60024910170789 | -0.000249101707885629 |
| 52 | 6.9 | 6.92775090397234 | -0.0277509039723402 |
| 53 | 7.7 | 7.65745917666762 | 0.0425408233323778 |
| 54 | 8 | 8.01311875669649 | -0.0131187566964859 |
| 55 | 8 | 8.0466107460754 | -0.0466107460753923 |
| 56 | 7.7 | 7.70743696912327 | -0.00743696912326973 |
| 57 | 7.3 | 7.3068051572044 | -0.00680515720440614 |
| 58 | 7.4 | 7.40087522749048 | -0.00087522749047966 |
| 59 | 8.1 | 8.07360643027643 | 0.0263935697235702 |
| 60 | 8.3 | 8.27161089777127 | 0.028389102228734 |
| 61 | 8.2 | 8.17110965125146 | 0.0288903487485387 |
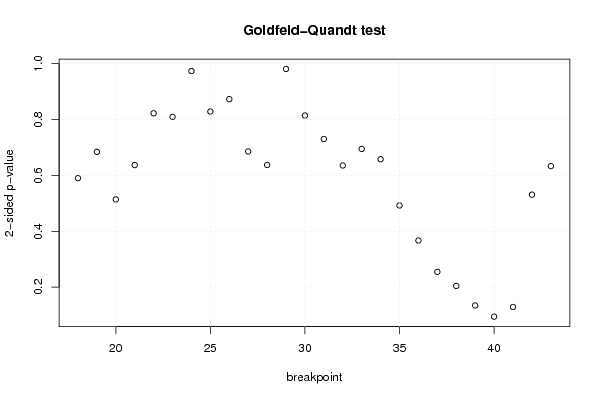
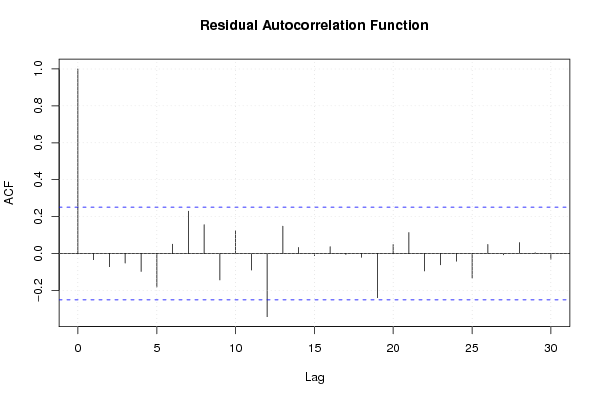
| Goldfeld-Quandt test for Heteroskedasticity | |||
| p-values | Alternative Hypothesis | ||
| breakpoint index | greater | 2-sided | less |
| 18 | 0.704931628811259 | 0.590136742377482 | 0.295068371188741 |
| 19 | 0.657794752056929 | 0.684410495886143 | 0.342205247943071 |
| 20 | 0.742970127676529 | 0.514059744646942 | 0.257029872323471 |
| 21 | 0.681547480598755 | 0.63690503880249 | 0.318452519401245 |
| 22 | 0.588829000244044 | 0.822341999511912 | 0.411170999755956 |
| 23 | 0.59517943820537 | 0.80964112358926 | 0.40482056179463 |
| 24 | 0.48685086330960 | 0.97370172661920 | 0.5131491366904 |
| 25 | 0.414363387261395 | 0.82872677452279 | 0.585636612738605 |
| 26 | 0.436529003407144 | 0.873058006814288 | 0.563470996592856 |
| 27 | 0.342826166813103 | 0.685652333626206 | 0.657173833186897 |
| 28 | 0.318678263015811 | 0.637356526031621 | 0.681321736984189 |
| 29 | 0.490590187246927 | 0.981180374493853 | 0.509409812753073 |
| 30 | 0.407191289345552 | 0.814382578691104 | 0.592808710654448 |
| 31 | 0.365207032858689 | 0.730414065717378 | 0.634792967141311 |
| 32 | 0.317737849046266 | 0.635475698092533 | 0.682262150953734 |
| 33 | 0.347427813889265 | 0.69485562777853 | 0.652572186110735 |
| 34 | 0.328966137232654 | 0.657932274465309 | 0.671033862767346 |
| 35 | 0.246170826586593 | 0.492341653173186 | 0.753829173413407 |
| 36 | 0.183402212944723 | 0.366804425889446 | 0.816597787055277 |
| 37 | 0.127327796660430 | 0.254655593320860 | 0.87267220333957 |
| 38 | 0.102094143533875 | 0.204188287067750 | 0.897905856466125 |
| 39 | 0.0671354334809404 | 0.134270866961881 | 0.93286456651906 |
| 40 | 0.047094603499404 | 0.094189206998808 | 0.952905396500596 |
| 41 | 0.0644317887379243 | 0.128863577475849 | 0.935568211262076 |
| 42 | 0.265552743825532 | 0.531105487651064 | 0.734447256174468 |
| 43 | 0.683346221184733 | 0.633307557630535 | 0.316653778815268 |
| Meta Analysis of Goldfeld-Quandt test for Heteroskedasticity | |||
| Description | # significant tests | % significant tests | OK/NOK |
| 1% type I error level | 0 | 0 | OK |
| 5% type I error level | 0 | 0 | OK |
| 10% type I error level | 1 | 0.0384615384615385 | OK |