| Multiple Linear Regression - Estimated Regression Equation |
| Y[t] = + 9169.31167219994 + 0.132189485048809X[t] + e[t] |
| Multiple Linear Regression - Ordinary Least Squares | |||||
| Variable | Parameter | S.D. | T-STAT H0: parameter = 0 | 2-tail p-value | 1-tail p-value |
| (Intercept) | 9169.31167219994 | 156.733887 | 58.5024 | 0 | 0 |
| X | 0.132189485048809 | 0.040454 | 3.2676 | 0.001825 | 0.000913 |
| Multiple Linear Regression - Regression Statistics | |
| Multiple R | 0.394297381050267 |
| R-squared | 0.155470424703100 |
| Adjusted R-squared | 0.140909569956602 |
| F-TEST (value) | 10.6772869731764 |
| F-TEST (DF numerator) | 1 |
| F-TEST (DF denominator) | 58 |
| p-value | 0.00182506844110497 |
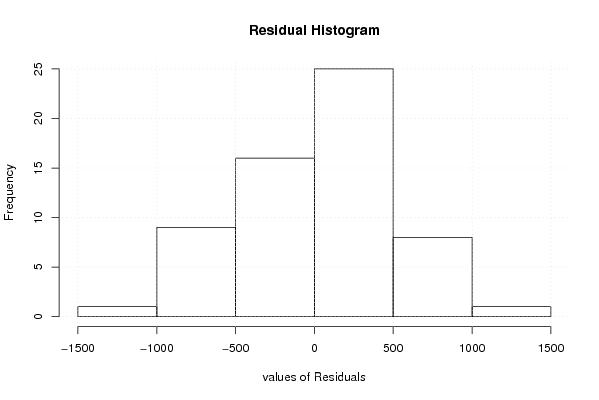
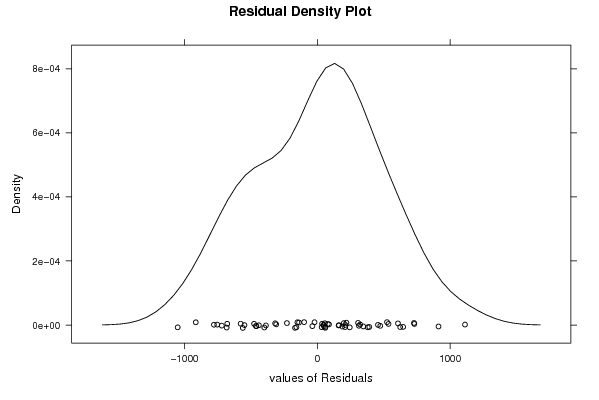
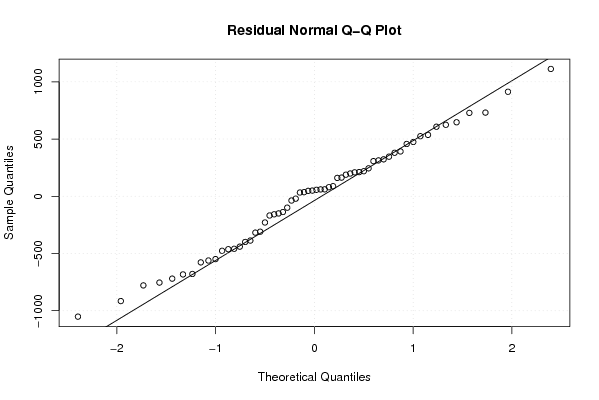
| Multiple Linear Regression - Residual Statistics | |
| Residual Standard Deviation | 480.708461588437 |
| Sum Squared Residuals | 13402676.2524779 |
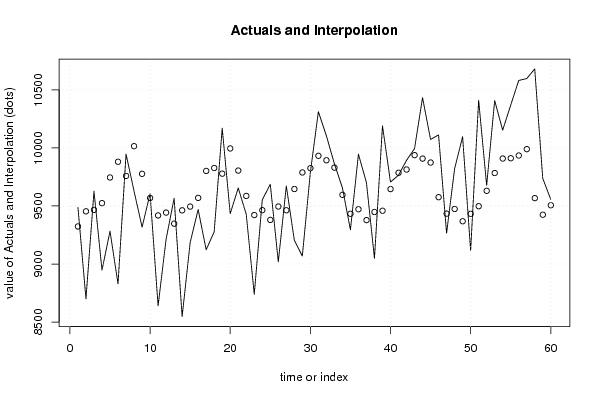
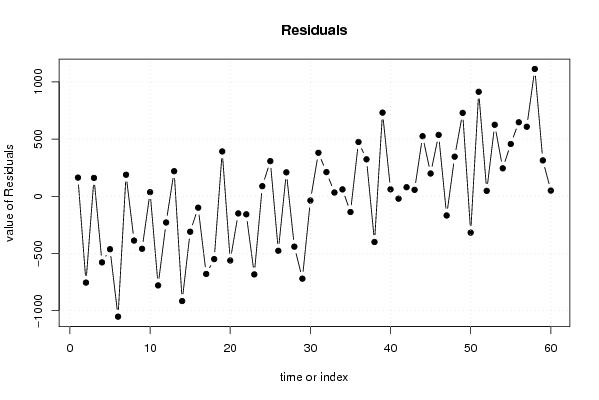
| Multiple Linear Regression - Actuals, Interpolation, and Residuals | |||
| Time or Index | Actuals | Interpolation Forecast | Residuals Prediction Error |
| 1 | 9487 | 9323.84118022197 | 163.158819778034 |
| 2 | 8700 | 9454.04782299507 | -754.047822995071 |
| 3 | 9627 | 9466.6058240747 | 160.394175925292 |
| 4 | 8947 | 9524.5048185261 | -577.504818526087 |
| 5 | 9283 | 9745.5256375277 | -462.525637527695 |
| 6 | 8829 | 9880.75548073263 | -1051.75548073263 |
| 7 | 9947 | 9758.74458603258 | 188.255413967424 |
| 8 | 9628 | 10015.0599975422 | -387.059997542216 |
| 9 | 9318 | 9776.85454548426 | -458.854545484263 |
| 10 | 9605 | 9569.05267498754 | 35.9473250124646 |
| 11 | 8640 | 9418.75323048704 | -778.753230487040 |
| 12 | 9214 | 9442.94390625097 | -228.943906250972 |
| 13 | 9567 | 9347.89966650088 | 219.100333499122 |
| 14 | 8547 | 9462.5079500382 | -915.507950038195 |
| 15 | 9185 | 9494.62999490506 | -309.629994905056 |
| 16 | 9470 | 9569.58143292773 | -99.5814329277306 |
| 17 | 9123 | 9801.70616867344 | -678.706168673439 |
| 18 | 9278 | 9826.95436031776 | -548.954360317761 |
| 19 | 10170 | 9778.3086298198 | 391.6913701802 |
| 20 | 9434 | 9995.36376426994 | -561.363764269944 |
| 21 | 9655 | 9805.01090579966 | -150.010905799659 |
| 22 | 9429 | 9586.63387649903 | -157.633876499027 |
| 23 | 8739 | 9421.79358864316 | -682.793588643162 |
| 24 | 9552 | 9463.82984488868 | 88.1701551113165 |
| 25 | 9687 | 9380.02171136774 | 306.978288632261 |
| 26 | 9019 | 9495.42313181535 | -476.423131815349 |
| 27 | 9672 | 9463.0367079784 | 208.963292021609 |
| 28 | 9206 | 9646.119144771 | -440.119144770991 |
| 29 | 9069 | 9788.6194096536 | -719.619409653607 |
| 30 | 9788 | 9825.23589701213 | -37.2358970121269 |
| 31 | 10312 | 9932.04500093156 | 379.954999068436 |
| 32 | 10105 | 9893.7100502674 | 211.28994973259 |
| 33 | 9863 | 9830.25909744398 | 32.7409025560184 |
| 34 | 9656 | 9596.0193299375 | 59.9806700625076 |
| 35 | 9295 | 9432.76531590221 | -137.765315902213 |
| 36 | 9946 | 9471.76121399161 | 474.238786008388 |
| 37 | 9701 | 9378.17105857706 | 322.828941422945 |
| 38 | 9049 | 9448.36367513797 | -399.363675137973 |
| 39 | 10190 | 9459.07102342693 | 730.928976573074 |
| 40 | 9706 | 9645.3260078607 | 60.6739921393019 |
| 41 | 9765 | 9785.97561995263 | -20.9756199526307 |
| 42 | 9893 | 9813.86760129793 | 79.1323987020707 |
| 43 | 9994 | 9937.72914878866 | 56.2708512113368 |
| 44 | 10433 | 9908.11870413773 | 524.88129586227 |
| 45 | 10073 | 9874.01381699514 | 198.986183004863 |
| 46 | 10112 | 9575.79433872503 | 536.205661274975 |
| 47 | 9266 | 9433.95502126765 | -167.955021267653 |
| 48 | 9820 | 9474.1406247225 | 345.859375277509 |
| 49 | 10097 | 9368.5212261685 | 728.478773831508 |
| 50 | 9115 | 9432.63312641716 | -317.633126417165 |
| 51 | 10411 | 9498.06692151633 | 912.933078483675 |
| 52 | 9678 | 9630.65297502028 | 47.3470249797197 |
| 53 | 10408 | 9783.59620922175 | 624.403790778248 |
| 54 | 10153 | 9908.77965156297 | 244.220348437026 |
| 55 | 10368 | 9911.0268728088 | 456.973127191196 |
| 56 | 10581 | 9934.42441166244 | 646.575588337557 |
| 57 | 10597 | 9989.41523744275 | 607.584762557252 |
| 58 | 10680 | 9567.598590652 | 1112.40140934800 |
| 59 | 9738 | 9424.56956782919 | 313.430432170813 |
| 60 | 9556 | 9506.26266958935 | 49.7373304106488 |
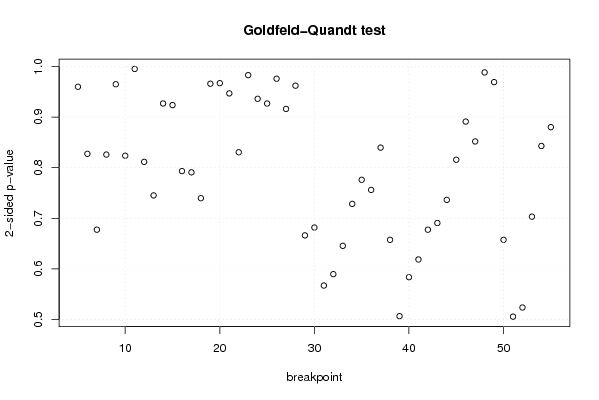
| Goldfeld-Quandt test for Heteroskedasticity | |||
| p-values | Alternative Hypothesis | ||
| breakpoint index | greater | 2-sided | less |
| 5 | 0.520024565042372 | 0.959950869915256 | 0.479975434957628 |
| 6 | 0.413724024984696 | 0.827448049969392 | 0.586275975015304 |
| 7 | 0.661243835537153 | 0.677512328925694 | 0.338756164462847 |
| 8 | 0.587016202927084 | 0.825967594145832 | 0.412983797072916 |
| 9 | 0.482464645144695 | 0.96492929028939 | 0.517535354855305 |
| 10 | 0.411859672250569 | 0.823719344501137 | 0.588140327749431 |
| 11 | 0.502427024862969 | 0.995145950274062 | 0.497572975137031 |
| 12 | 0.405784691481656 | 0.811569382963312 | 0.594215308518344 |
| 13 | 0.372644628662585 | 0.745289257325171 | 0.627355371337415 |
| 14 | 0.536554036502045 | 0.92689192699591 | 0.463445963497955 |
| 15 | 0.461861774681994 | 0.923723549363988 | 0.538138225318006 |
| 16 | 0.396669807604278 | 0.793339615208556 | 0.603330192395722 |
| 17 | 0.395448630448552 | 0.790897260897105 | 0.604551369551448 |
| 18 | 0.369880901712198 | 0.739761803424395 | 0.630119098287802 |
| 19 | 0.517026177001387 | 0.965947645997225 | 0.482973822998613 |
| 20 | 0.516477728411952 | 0.967044543176095 | 0.483522271588048 |
| 21 | 0.473413666689208 | 0.946827333378416 | 0.526586333310792 |
| 22 | 0.415247975937138 | 0.830495951874276 | 0.584752024062862 |
| 23 | 0.508558711940513 | 0.982882576118974 | 0.491441288059487 |
| 24 | 0.468084566000883 | 0.936169132001765 | 0.531915433999117 |
| 25 | 0.463386047843997 | 0.926772095687993 | 0.536613952156003 |
| 26 | 0.487922686708008 | 0.975845373416016 | 0.512077313291992 |
| 27 | 0.458060784739126 | 0.916121569478252 | 0.541939215260874 |
| 28 | 0.481037248673957 | 0.962074497347913 | 0.518962751326044 |
| 29 | 0.666844942574584 | 0.666310114850831 | 0.333155057425416 |
| 30 | 0.659109793826536 | 0.681780412346927 | 0.340890206173464 |
| 31 | 0.716443302338143 | 0.567113395323714 | 0.283556697661857 |
| 32 | 0.70517621031988 | 0.58964757936024 | 0.29482378968012 |
| 33 | 0.67718053967767 | 0.645638920644661 | 0.322819460322331 |
| 34 | 0.635747556359451 | 0.728504887281098 | 0.364252443640549 |
| 35 | 0.611940454334625 | 0.77611909133075 | 0.388059545665375 |
| 36 | 0.621932725640307 | 0.756134548719387 | 0.378067274359693 |
| 37 | 0.580165425237931 | 0.839669149524137 | 0.419834574762069 |
| 38 | 0.671278625920834 | 0.657442748158333 | 0.328721374079166 |
| 39 | 0.746706528174881 | 0.506586943650238 | 0.253293471825119 |
| 40 | 0.70815347136769 | 0.583693057264619 | 0.291846528632310 |
| 41 | 0.690670271017836 | 0.618659457964328 | 0.309329728982164 |
| 42 | 0.661262914926733 | 0.677474170146534 | 0.338737085073267 |
| 43 | 0.654671536616108 | 0.690656926767784 | 0.345328463383892 |
| 44 | 0.631809386074003 | 0.736381227851993 | 0.368190613925997 |
| 45 | 0.592133024453662 | 0.815733951092676 | 0.407866975546338 |
| 46 | 0.55442395741187 | 0.891152085176258 | 0.445576042588129 |
| 47 | 0.574043472438038 | 0.851913055123925 | 0.425956527561962 |
| 48 | 0.494135921177512 | 0.988271842355025 | 0.505864078822488 |
| 49 | 0.515443510637443 | 0.969112978725114 | 0.484556489362557 |
| 50 | 0.671253719935094 | 0.657492560129812 | 0.328746280064906 |
| 51 | 0.747168156517286 | 0.505663686965428 | 0.252831843482714 |
| 52 | 0.738137096636022 | 0.523725806727956 | 0.261862903363978 |
| 53 | 0.648373947399488 | 0.703252105201023 | 0.351626052600512 |
| 54 | 0.578532003747075 | 0.84293599250585 | 0.421467996252925 |
| 55 | 0.440088993341877 | 0.880177986683753 | 0.559911006658123 |
| Meta Analysis of Goldfeld-Quandt test for Heteroskedasticity | |||
| Description | # significant tests | % significant tests | OK/NOK |
| 1% type I error level | 0 | 0 | OK |
| 5% type I error level | 0 | 0 | OK |
| 10% type I error level | 0 | 0 | OK |