| Multiple Linear Regression - Estimated Regression Equation |
| werkloos[t] = + 566709.674302673 + 8.7012473517102bouw[t] -1553.21484229700t + e[t] |
| Multiple Linear Regression - Ordinary Least Squares | |||||
| Variable | Parameter | S.D. | T-STAT H0: parameter = 0 | 2-tail p-value | 1-tail p-value |
| (Intercept) | 566709.674302673 | 34135.292382 | 16.6019 | 0 | 0 |
| bouw | 8.7012473517102 | 6.904233 | 1.2603 | 0.212704 | 0.106352 |
| t | -1553.21484229700 | 237.173027 | -6.5489 | 0 | 0 |
| Multiple Linear Regression - Regression Statistics | |
| Multiple R | 0.675859075262134 |
| R-squared | 0.456785489614188 |
| Adjusted R-squared | 0.437725331355036 |
| F-TEST (value) | 23.9654615351828 |
| F-TEST (DF numerator) | 2 |
| F-TEST (DF denominator) | 57 |
| p-value | 2.79694436500222e-08 |
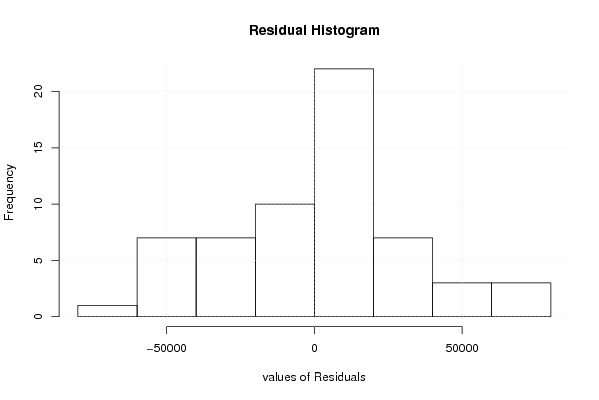
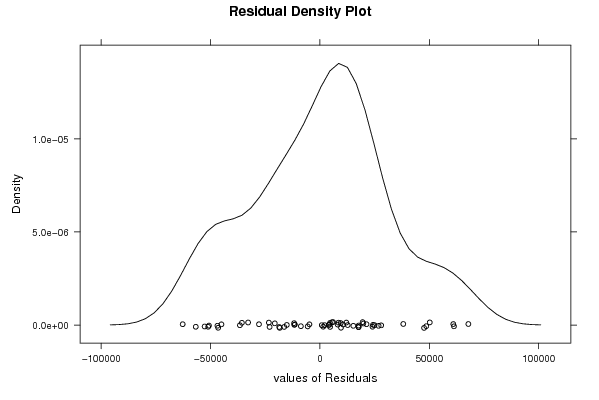
| Multiple Linear Regression - Residual Statistics | |
| Residual Standard Deviation | 31471.1759586322 |
| Sum Squared Residuals | 56454790224.4939 |
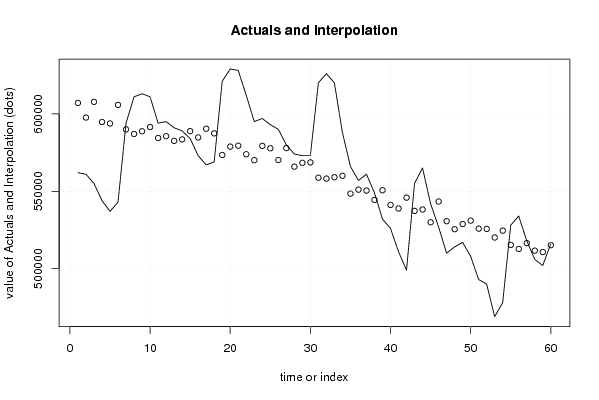
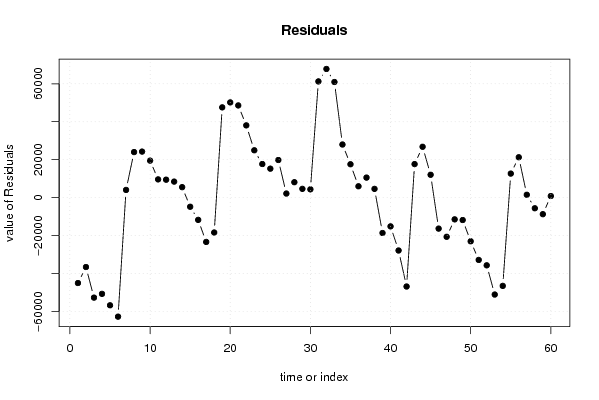
| Multiple Linear Regression - Actuals, Interpolation, and Residuals | |||
| Time or Index | Actuals | Interpolation Forecast | Residuals Prediction Error |
| 1 | 562000 | 607044.264211509 | -45044.2642115087 |
| 2 | 561000 | 597607.719268562 | -36607.7192685623 |
| 3 | 555000 | 607731.57837226 | -52731.5783722604 |
| 4 | 544000 | 594753.625757168 | -50753.6257571679 |
| 5 | 537000 | 593783.394487435 | -56783.3944874355 |
| 6 | 543000 | 605769.3205244 | -62769.3205243995 |
| 7 | 594000 | 589963.462520001 | 4036.53747999876 |
| 8 | 611000 | 586991.944359376 | 24008.0556406245 |
| 9 | 613000 | 588736.502263377 | 24263.4977366233 |
| 10 | 611000 | 591499.106107528 | 19500.8938924721 |
| 11 | 594000 | 584394.49545484 | 9605.5045451602 |
| 12 | 595000 | 585556.069786276 | 9443.93021372361 |
| 13 | 591000 | 582567.149130947 | 8432.85086905279 |
| 14 | 589000 | 583502.491031239 | 5497.50896876067 |
| 15 | 584000 | 588823.261596793 | -4823.26159679338 |
| 16 | 573000 | 584746.6850225 | -11746.6850225004 |
| 17 | 567000 | 590380.700492716 | -23380.7004927160 |
| 18 | 569000 | 587409.18233209 | -18409.1823320903 |
| 19 | 621000 | 573421.885024199 | 47578.1149758006 |
| 20 | 629000 | 578820.966815919 | 50179.0331840811 |
| 21 | 628000 | 579408.258822143 | 48591.7411778574 |
| 22 | 612000 | 573913.378929521 | 38086.6210704791 |
| 23 | 595000 | 570063.034786372 | 24936.9652136276 |
| 24 | 597000 | 579308.067907548 | 17691.9320924523 |
| 25 | 593000 | 577746.151817899 | 15253.8481821010 |
| 26 | 590000 | 570180.37505557 | 19819.6249444297 |
| 27 | 580000 | 577867.88490079 | 2132.11509921049 |
| 28 | 574000 | 565890.575731144 | 8109.4242688563 |
| 29 | 573000 | 568383.440907392 | 4616.55909260805 |
| 30 | 573000 | 568648.786761602 | 4351.21323839762 |
| 31 | 620000 | 558751.075709015 | 61248.9242909847 |
| 32 | 626000 | 558172.40057011 | 67827.5994298901 |
| 33 | 620000 | 559055.534986292 | 60944.4650137083 |
| 34 | 588000 | 560008.279381287 | 27991.7206187128 |
| 35 | 566000 | 548422.526342468 | 17577.4736575316 |
| 36 | 557000 | 551037.208981641 | 5962.79101835942 |
| 37 | 561000 | 550449.832595383 | 10550.1674046166 |
| 38 | 549000 | 544398.072872252 | 4601.92712774775 |
| 39 | 532000 | 550649.876904439 | -18649.8769044393 |
| 40 | 526000 | 541169.825724734 | -15169.8257247343 |
| 41 | 511000 | 538885.706104894 | -27885.7061048937 |
| 42 | 499000 | 545877.116161976 | -46877.1161619761 |
| 43 | 555000 | 537336.799696256 | 17663.2003037442 |
| 44 | 565000 | 538202.531617734 | 26797.4683822658 |
| 45 | 542000 | 529958.057561972 | 12041.9424380279 |
| 46 | 527000 | 543344.884422562 | -16344.8844225615 |
| 47 | 510000 | 530662.774217427 | -20662.7742174272 |
| 48 | 514000 | 525481.139229467 | -11481.139229467 |
| 49 | 517000 | 528835.427893535 | -11835.4278935346 |
| 50 | 508000 | 531041.151907176 | -23041.1519071764 |
| 51 | 493000 | 525859.516919216 | -32859.5169192162 |
| 52 | 490000 | 525698.501653193 | -35698.5016531928 |
| 53 | 469000 | 520116.609287054 | -51116.609287054 |
| 54 | 478000 | 524549.852622734 | -46549.8526227336 |
| 55 | 528000 | 515339.540110932 | 12660.4598890683 |
| 56 | 534000 | 512733.474339078 | 21266.5256609222 |
| 57 | 518000 | 516505.422876027 | 1494.57712397261 |
| 58 | 506000 | 511619.630298025 | -5619.63029802538 |
| 59 | 502000 | 510745.112749162 | -8745.1127491618 |
| 60 | 516000 | 515178.356084841 | 821.643915158606 |
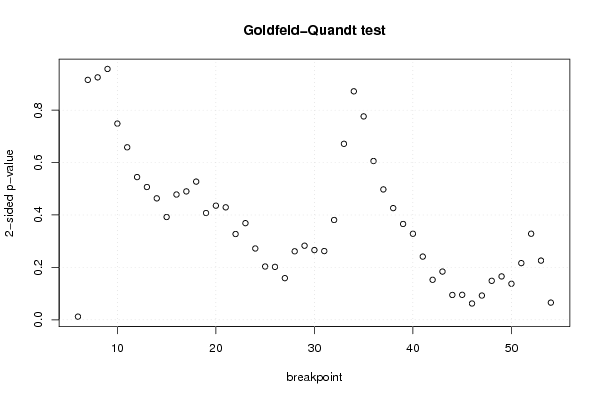
| Goldfeld-Quandt test for Heteroskedasticity | |||
| p-values | Alternative Hypothesis | ||
| breakpoint index | greater | 2-sided | less |
| 6 | 0.00594499727243689 | 0.0118899945448738 | 0.994055002727563 |
| 7 | 0.457778805931046 | 0.915557611862092 | 0.542221194068954 |
| 8 | 0.537328090090084 | 0.925343819819832 | 0.462671909909916 |
| 9 | 0.478681672649291 | 0.957363345298582 | 0.521318327350709 |
| 10 | 0.374373442213613 | 0.748746884427226 | 0.625626557786387 |
| 11 | 0.329155367709836 | 0.658310735419673 | 0.670844632290164 |
| 12 | 0.27235207325347 | 0.54470414650694 | 0.72764792674653 |
| 13 | 0.25334464387983 | 0.50668928775966 | 0.74665535612017 |
| 14 | 0.231745554439286 | 0.463491108878572 | 0.768254445560714 |
| 15 | 0.196092996413406 | 0.392185992826813 | 0.803907003586594 |
| 16 | 0.239012927310714 | 0.478025854621428 | 0.760987072689286 |
| 17 | 0.24500182496577 | 0.49000364993154 | 0.75499817503423 |
| 18 | 0.263675052244097 | 0.527350104488195 | 0.736324947755903 |
| 19 | 0.203726416215138 | 0.407452832430277 | 0.796273583784862 |
| 20 | 0.217785096568249 | 0.435570193136497 | 0.782214903431751 |
| 21 | 0.214597567807323 | 0.429195135614645 | 0.785402432192677 |
| 22 | 0.163631254703716 | 0.327262509407432 | 0.836368745296284 |
| 23 | 0.184396541426512 | 0.368793082853024 | 0.815603458573488 |
| 24 | 0.136055438208542 | 0.272110876417084 | 0.863944561791458 |
| 25 | 0.101630972728842 | 0.203261945457684 | 0.898369027271158 |
| 26 | 0.100934616515958 | 0.201869233031916 | 0.899065383484042 |
| 27 | 0.0794340772528003 | 0.158868154505601 | 0.9205659227472 |
| 28 | 0.130675944783649 | 0.261351889567298 | 0.869324055216351 |
| 29 | 0.141341487881805 | 0.282682975763610 | 0.858658512118195 |
| 30 | 0.132986338984222 | 0.265972677968445 | 0.867013661015778 |
| 31 | 0.131113409529845 | 0.262226819059689 | 0.868886590470155 |
| 32 | 0.190416830872246 | 0.380833661744493 | 0.809583169127754 |
| 33 | 0.335794291455472 | 0.671588582910944 | 0.664205708544528 |
| 34 | 0.436006643826852 | 0.872013287653705 | 0.563993356173148 |
| 35 | 0.61189372112511 | 0.776212557749779 | 0.388106278874890 |
| 36 | 0.69703938116491 | 0.605921237670179 | 0.302960618835090 |
| 37 | 0.751233481282891 | 0.497533037434217 | 0.248766518717109 |
| 38 | 0.786882205727622 | 0.426235588544757 | 0.213117794272378 |
| 39 | 0.817189727234405 | 0.365620545531190 | 0.182810272765595 |
| 40 | 0.835841209809425 | 0.328317580381149 | 0.164158790190575 |
| 41 | 0.879424388839048 | 0.241151222321905 | 0.120575611160952 |
| 42 | 0.923707024032912 | 0.152585951934175 | 0.0762929759670875 |
| 43 | 0.908023772639457 | 0.183952454721085 | 0.0919762273605427 |
| 44 | 0.952654899606659 | 0.0946902007866824 | 0.0473451003933412 |
| 45 | 0.952380392342353 | 0.0952392153152936 | 0.0476196076576468 |
| 46 | 0.968956135623123 | 0.0620877287537536 | 0.0310438643768768 |
| 47 | 0.953782889758618 | 0.0924342204827637 | 0.0462171102413818 |
| 48 | 0.925673642562453 | 0.148652714875093 | 0.0743263574375466 |
| 49 | 0.917255161865474 | 0.165489676269052 | 0.0827448381345262 |
| 50 | 0.931284386184135 | 0.13743122763173 | 0.068715613815865 |
| 51 | 0.891909434280995 | 0.216181131438009 | 0.108090565719005 |
| 52 | 0.835805940209643 | 0.328388119580713 | 0.164194059790357 |
| 53 | 0.887074120015914 | 0.225851759968172 | 0.112925879984086 |
| 54 | 0.967278796204977 | 0.0654424075900452 | 0.0327212037950226 |
| Meta Analysis of Goldfeld-Quandt test for Heteroskedasticity | |||
| Description | # significant tests | % significant tests | OK/NOK |
| 1% type I error level | 0 | 0 | OK |
| 5% type I error level | 1 | 0.0204081632653061 | OK |
| 10% type I error level | 6 | 0.122448979591837 | NOK |