| Multiple Linear Regression - Estimated Regression Equation |
| werkloos[t] = + 475949.678886236 + 29.5723106155533bouw[t] -11842.4901659986M1[t] -7378.78713939663M2[t] -38101.4070769657M3[t] -22886.1237129371M4[t] -36075.6385920404M5[t] -52820.644756119M6[t] + 33752.1334074593M7[t] + 39406.6590887836M8[t] + 27789.7553234363M9[t] + 4149.28979119656M10[t] + 9613.89236678436M11[t] -1607.11390273949t + e[t] |
| Multiple Linear Regression - Ordinary Least Squares | |||||
| Variable | Parameter | S.D. | T-STAT H0: parameter = 0 | 2-tail p-value | 1-tail p-value |
| (Intercept) | 475949.678886236 | 27487.144689 | 17.3154 | 0 | 0 |
| bouw | 29.5723106155533 | 5.300663 | 5.579 | 1e-06 | 1e-06 |
| M1 | -11842.4901659986 | 12629.736113 | -0.9377 | 0.353313 | 0.176656 |
| M2 | -7378.78713939663 | 12656.745614 | -0.583 | 0.562746 | 0.281373 |
| M3 | -38101.4070769657 | 12894.807876 | -2.9548 | 0.004919 | 0.00246 |
| M4 | -22886.1237129371 | 12610.279469 | -1.8149 | 0.076066 | 0.038033 |
| M5 | -36075.6385920404 | 12560.793694 | -2.8721 | 0.006148 | 0.003074 |
| M6 | -52820.644756119 | 13005.694619 | -4.0613 | 0.000188 | 9.4e-05 |
| M7 | 33752.1334074593 | 12808.504325 | 2.6351 | 0.011424 | 0.005712 |
| M8 | 39406.6590887836 | 12636.769149 | 3.1184 | 0.003134 | 0.001567 |
| M9 | 27789.7553234363 | 12551.185649 | 2.2141 | 0.031817 | 0.015908 |
| M10 | 4149.28979119656 | 12557.245067 | 0.3304 | 0.742575 | 0.371288 |
| M11 | 9613.89236678436 | 12757.192604 | 0.7536 | 0.454926 | 0.227463 |
| t | -1607.11390273949 | 152.058078 | -10.5691 | 0 | 0 |
| Multiple Linear Regression - Regression Statistics | |
| Multiple R | 0.909203821455076 |
| R-squared | 0.826651588948513 |
| Adjusted R-squared | 0.777661820607875 |
| F-TEST (value) | 16.8739640326650 |
| F-TEST (DF numerator) | 13 |
| F-TEST (DF denominator) | 46 |
| p-value | 2.53130849614536e-13 |
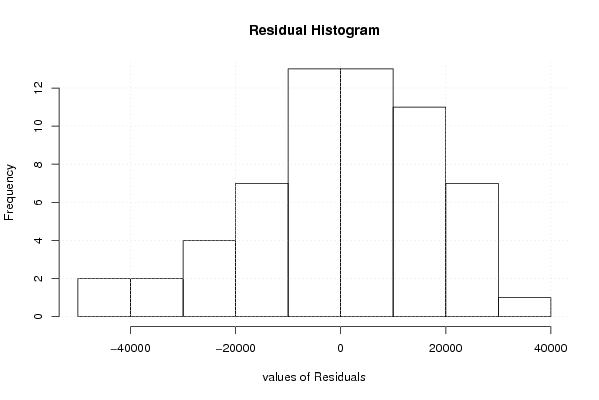
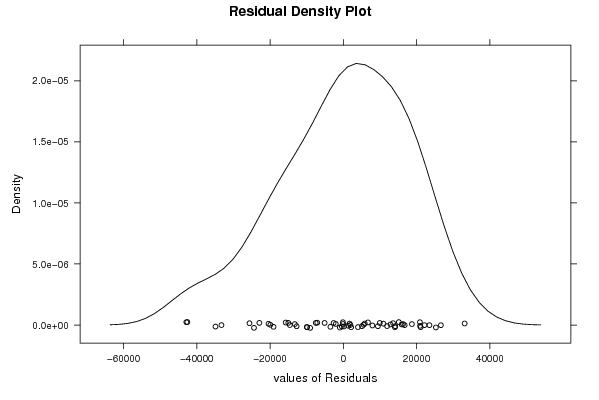
| Multiple Linear Regression - Residual Statistics | |
| Residual Standard Deviation | 19789.9972825814 |
| Sum Squared Residuals | 18015623652.4507 |
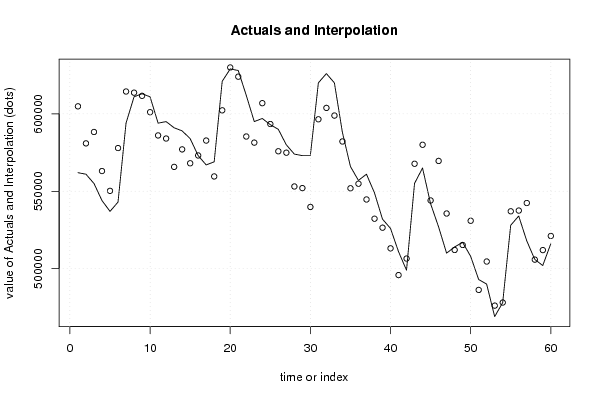
| Multiple Linear Regression - Actuals, Interpolation, and Residuals | |||
| Time or Index | Actuals | Interpolation Forecast | Residuals Prediction Error |
| 1 | 562000 | 604861.178120772 | -42861.1781207716 |
| 2 | 561000 | 580925.253826943 | -19925.2538269429 |
| 3 | 555000 | 588281.560832707 | -33281.5608327068 |
| 4 | 544000 | 563061.286455774 | -19061.2864557744 |
| 5 | 537000 | 550246.002485174 | -13246.0024851737 |
| 6 | 543000 | 577908.397736157 | -34908.3977361566 |
| 7 | 594000 | 614434.617208719 | -20434.617208719 |
| 8 | 611000 | 613661.742356969 | -2661.74235696869 |
| 9 | 613000 | 611645.630412177 | 1354.36958782336 |
| 10 | 611000 | 601065.917042512 | 9934.0829574882 |
| 11 | 594000 | 586056.271542637 | 7943.7284573629 |
| 12 | 595000 | 584061.826185166 | 10938.1738148341 |
| 13 | 591000 | 565732.790864862 | 25267.2091351385 |
| 14 | 589000 | 577047.060824772 | 11952.9391752277 |
| 15 | 584000 | 568079.452370751 | 15920.5476292492 |
| 16 | 573000 | 573111.651753529 | -111.651753529381 |
| 17 | 567000 | 582741.751540134 | -15741.7515401337 |
| 18 | 569000 | 559569.34484298 | 9430.6551570196 |
| 19 | 621000 | 602276.177234193 | 18723.8227658065 |
| 20 | 629000 | 629951.865194605 | -951.865194605427 |
| 21 | 628000 | 624002.635937945 | 3997.36406205522 |
| 22 | 612000 | 585358.79979412 | 26641.2002058801 |
| 23 | 595000 | 581409.198464462 | 13590.8015355379 |
| 24 | 597000 | 606887.42966884 | -9887.4296688399 |
| 25 | 593000 | 593408.253289486 | -408.2532894863 |
| 26 | 590000 | 575830.375778001 | 14169.6242219986 |
| 27 | 580000 | 574906.43581141 | 5093.56418858954 |
| 28 | 574000 | 553086.977155267 | 20913.0228447333 |
| 29 | 573000 | 552041.472809656 | 20958.5271903438 |
| 30 | 573000 | 539869.965661489 | 33130.0343385113 |
| 31 | 620000 | 596475.784042012 | 23524.2159579881 |
| 32 | 626000 | 603835.294609539 | 22164.7053904613 |
| 33 | 620000 | 598891.523913807 | 21108.4760861931 |
| 34 | 588000 | 582160.769936107 | 5839.23006389302 |
| 35 | 566000 | 551921.384469222 | 14078.6155307777 |
| 36 | 557000 | 554865.514984549 | 2134.4850154515 |
| 37 | 561000 | 544698.437394137 | 16301.5626058631 |
| 38 | 549000 | 532266.141929758 | 16733.8580702417 |
| 39 | 532000 | 526462.770711601 | 5537.22928839899 |
| 40 | 526000 | 513130.565202121 | 12869.4347978790 |
| 41 | 511000 | 495849.862328572 | 15150.1376714282 |
| 42 | 499000 | 506537.751286227 | -7537.75128622706 |
| 43 | 555000 | 567756.850122777 | -12756.8501227765 |
| 44 | 565000 | 580025.364252485 | -15025.3642524852 |
| 45 | 542000 | 544060.239721038 | -2060.23972103791 |
| 46 | 527000 | 569588.317612964 | -42588.3176129637 |
| 47 | 510000 | 535622.821008519 | -25622.8210085193 |
| 48 | 514000 | 512070.16121231 | 1929.83878769025 |
| 49 | 517000 | 515299.340330744 | 1700.65966925625 |
| 50 | 508000 | 530931.167640525 | -22931.1676405252 |
| 51 | 493000 | 486269.780273531 | 6730.21972646904 |
| 52 | 490000 | 504609.519433309 | -14609.5194333085 |
| 53 | 469000 | 476120.910836465 | -7120.91083646461 |
| 54 | 478000 | 478114.540473147 | -114.540473147198 |
| 55 | 528000 | 537056.571392299 | -9056.57139229907 |
| 56 | 534000 | 537525.733586402 | -3525.73358640195 |
| 57 | 518000 | 542399.970015034 | -24399.9700150338 |
| 58 | 506000 | 505826.195614298 | 173.804385702344 |
| 59 | 502000 | 511990.324515159 | -9990.32451515911 |
| 60 | 516000 | 521115.067949136 | -5115.06794913591 |
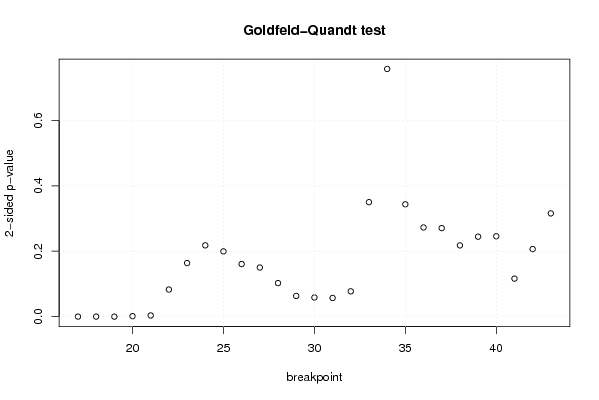
| Goldfeld-Quandt test for Heteroskedasticity | |||
| p-values | Alternative Hypothesis | ||
| breakpoint index | greater | 2-sided | less |
| 17 | 8.7270039363367e-05 | 0.000174540078726734 | 0.999912729960637 |
| 18 | 7.82089142366058e-05 | 0.000156417828473212 | 0.999921791085763 |
| 19 | 8.6912668201574e-06 | 1.73825336403148e-05 | 0.99999130873318 |
| 20 | 0.000746519037084482 | 0.00149303807416896 | 0.999253480962915 |
| 21 | 0.00183549307575444 | 0.00367098615150888 | 0.998164506924246 |
| 22 | 0.0414453633418403 | 0.0828907266836806 | 0.95855463665816 |
| 23 | 0.0819177037895992 | 0.163835407579198 | 0.9180822962104 |
| 24 | 0.109009352211357 | 0.218018704422714 | 0.890990647788643 |
| 25 | 0.0997598553223255 | 0.199519710644651 | 0.900240144677675 |
| 26 | 0.0803889157244211 | 0.160777831448842 | 0.919611084275579 |
| 27 | 0.0751012965347477 | 0.150202593069495 | 0.924898703465252 |
| 28 | 0.0513044630523868 | 0.102608926104774 | 0.948695536947613 |
| 29 | 0.0316585829898334 | 0.0633171659796668 | 0.968341417010167 |
| 30 | 0.0293179242006478 | 0.0586358484012957 | 0.970682075799352 |
| 31 | 0.0286132364195516 | 0.0572264728391032 | 0.971386763580448 |
| 32 | 0.0387193197295114 | 0.0774386394590228 | 0.961280680270489 |
| 33 | 0.175003658671792 | 0.350007317343583 | 0.824996341328208 |
| 34 | 0.621416910959826 | 0.757166178080347 | 0.378583089040174 |
| 35 | 0.82823755714298 | 0.343524885714041 | 0.171762442857020 |
| 36 | 0.863702664214664 | 0.272594671570671 | 0.136297335785336 |
| 37 | 0.864665374458713 | 0.270669251082575 | 0.135334625541287 |
| 38 | 0.89108045311356 | 0.217839093772881 | 0.108919546886441 |
| 39 | 0.877755728986324 | 0.244488542027352 | 0.122244271013676 |
| 40 | 0.877135907660646 | 0.245728184678708 | 0.122864092339354 |
| 41 | 0.941883963555556 | 0.116232072888888 | 0.058116036444444 |
| 42 | 0.896737812394296 | 0.206524375211408 | 0.103262187605704 |
| 43 | 0.842178852925989 | 0.315642294148022 | 0.157821147074011 |
| Meta Analysis of Goldfeld-Quandt test for Heteroskedasticity | |||
| Description | # significant tests | % significant tests | OK/NOK |
| 1% type I error level | 5 | 0.185185185185185 | NOK |
| 5% type I error level | 5 | 0.185185185185185 | NOK |
| 10% type I error level | 10 | 0.370370370370370 | NOK |