| Multiple Linear Regression - Estimated Regression Equation |
| Y[t] = + 10.1488888888889 -1.04722222222222X[t] + 0.0736111111111097M1[t] -0.349444444444445M2[t] -0.712500000000001M3[t] -0.595555555555556M4[t] -0.398611111111111M5[t] -0.401666666666667M6[t] -0.584722222222223M7[t] -0.827777777777779M8[t] -1.09083333333333M9[t] -1.05388888888889M10[t] -0.216944444444445M11[t] -0.0169444444444444t + e[t] |
| Multiple Linear Regression - Ordinary Least Squares | |||||
| Variable | Parameter | S.D. | T-STAT H0: parameter = 0 | 2-tail p-value | 1-tail p-value |
| (Intercept) | 10.1488888888889 | 0.259067 | 39.1747 | 0 | 0 |
| X | -1.04722222222222 | 0.232649 | -4.5013 | 4.6e-05 | 2.3e-05 |
| M1 | 0.0736111111111097 | 0.288788 | 0.2549 | 0.799939 | 0.39997 |
| M2 | -0.349444444444445 | 0.287144 | -1.217 | 0.229824 | 0.114912 |
| M3 | -0.712500000000001 | 0.285648 | -2.4943 | 0.016274 | 0.008137 |
| M4 | -0.595555555555556 | 0.284302 | -2.0948 | 0.041725 | 0.020862 |
| M5 | -0.398611111111111 | 0.28311 | -1.408 | 0.165862 | 0.082931 |
| M6 | -0.401666666666667 | 0.282072 | -1.424 | 0.161199 | 0.0806 |
| M7 | -0.584722222222223 | 0.281192 | -2.0794 | 0.043178 | 0.021589 |
| M8 | -0.827777777777779 | 0.280469 | -2.9514 | 0.004964 | 0.002482 |
| M9 | -1.09083333333333 | 0.279905 | -3.8972 | 0.000314 | 0.000157 |
| M10 | -1.05388888888889 | 0.279502 | -3.7706 | 0.000463 | 0.000232 |
| M11 | -0.216944444444445 | 0.27926 | -0.7769 | 0.441221 | 0.220611 |
| t | -0.0169444444444444 | 0.006716 | -2.523 | 0.015157 | 0.007578 |
| Multiple Linear Regression - Regression Statistics | |
| Multiple R | 0.912187758983396 |
| R-squared | 0.83208650763915 |
| Adjusted R-squared | 0.784632694580648 |
| F-TEST (value) | 17.5346606312405 |
| F-TEST (DF numerator) | 13 |
| F-TEST (DF denominator) | 46 |
| p-value | 1.25899290992493e-13 |
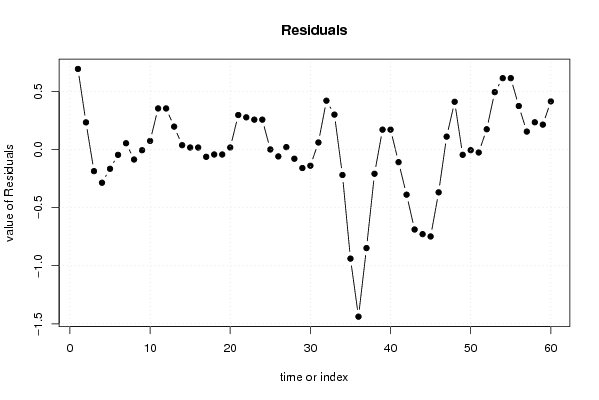
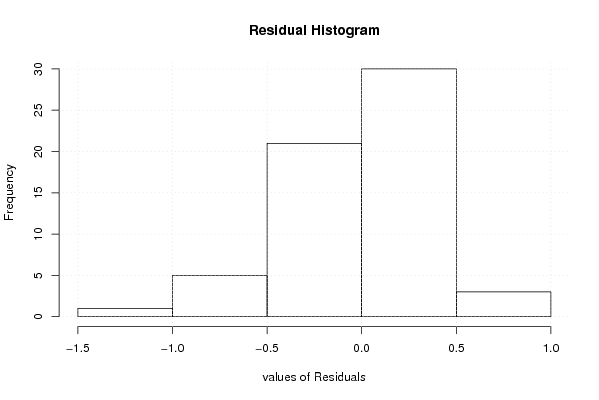
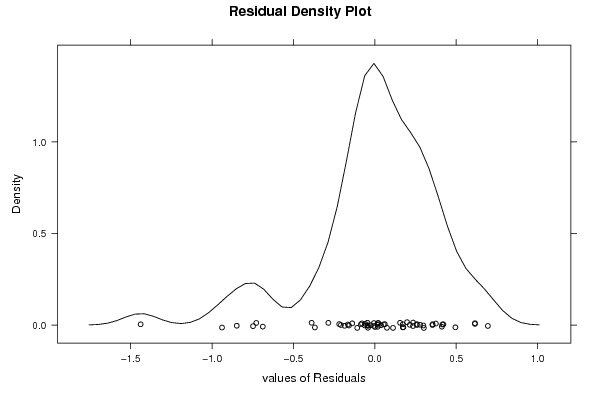
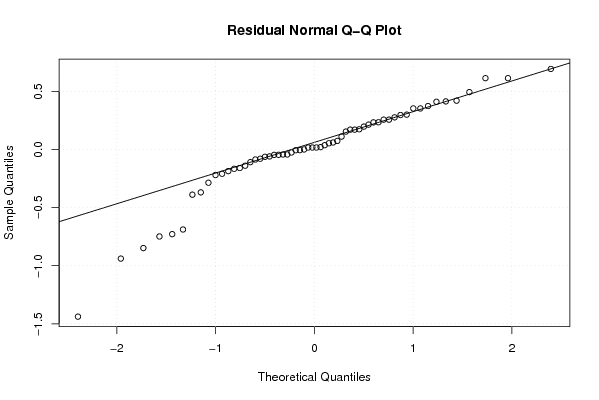
| Multiple Linear Regression - Residual Statistics | |
| Residual Standard Deviation | 0.441421178699925 |
| Sum Squared Residuals | 8.96322222222221 |
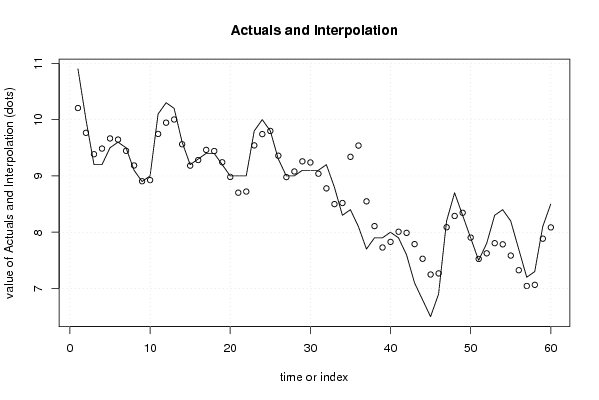
| Multiple Linear Regression - Actuals, Interpolation, and Residuals | |||
| Time or Index | Actuals | Interpolation Forecast | Residuals Prediction Error |
| 1 | 10.9 | 10.2055555555556 | 0.694444444444441 |
| 2 | 10 | 9.76555555555555 | 0.234444444444445 |
| 3 | 9.2 | 9.38555555555556 | -0.185555555555555 |
| 4 | 9.2 | 9.48555555555556 | -0.285555555555555 |
| 5 | 9.5 | 9.66555555555555 | -0.165555555555555 |
| 6 | 9.6 | 9.64555555555556 | -0.045555555555555 |
| 7 | 9.5 | 9.44555555555556 | 0.0544444444444445 |
| 8 | 9.1 | 9.18555555555556 | -0.0855555555555562 |
| 9 | 8.9 | 8.90555555555556 | -0.00555555555555533 |
| 10 | 9 | 8.92555555555555 | 0.0744444444444446 |
| 11 | 10.1 | 9.74555555555555 | 0.354444444444445 |
| 12 | 10.3 | 9.94555555555556 | 0.354444444444445 |
| 13 | 10.2 | 10.0022222222222 | 0.197777777777778 |
| 14 | 9.6 | 9.56222222222222 | 0.0377777777777769 |
| 15 | 9.2 | 9.18222222222222 | 0.0177777777777773 |
| 16 | 9.3 | 9.28222222222222 | 0.0177777777777785 |
| 17 | 9.4 | 9.46222222222222 | -0.062222222222222 |
| 18 | 9.4 | 9.44222222222222 | -0.0422222222222218 |
| 19 | 9.2 | 9.24222222222222 | -0.0422222222222224 |
| 20 | 9 | 8.98222222222222 | 0.0177777777777783 |
| 21 | 9 | 8.70222222222222 | 0.297777777777777 |
| 22 | 9 | 8.72222222222222 | 0.277777777777778 |
| 23 | 9.8 | 9.54222222222222 | 0.257777777777779 |
| 24 | 10 | 9.74222222222222 | 0.257777777777777 |
| 25 | 9.8 | 9.79888888888889 | 0.00111111111111274 |
| 26 | 9.3 | 9.35888888888889 | -0.058888888888888 |
| 27 | 9 | 8.97888888888889 | 0.0211111111111114 |
| 28 | 9 | 9.07888888888889 | -0.078888888888889 |
| 29 | 9.1 | 9.25888888888889 | -0.158888888888889 |
| 30 | 9.1 | 9.23888888888889 | -0.138888888888889 |
| 31 | 9.1 | 9.03888888888889 | 0.0611111111111115 |
| 32 | 9.2 | 8.77888888888889 | 0.421111111111111 |
| 33 | 8.8 | 8.49888888888889 | 0.301111111111111 |
| 34 | 8.3 | 8.51888888888889 | -0.218888888888888 |
| 35 | 8.4 | 9.33888888888889 | -0.938888888888888 |
| 36 | 8.1 | 9.53888888888889 | -1.43888888888889 |
| 37 | 7.7 | 8.54833333333333 | -0.848333333333332 |
| 38 | 7.9 | 8.10833333333333 | -0.208333333333333 |
| 39 | 7.9 | 7.72833333333333 | 0.171666666666667 |
| 40 | 8 | 7.82833333333333 | 0.171666666666667 |
| 41 | 7.9 | 8.00833333333333 | -0.108333333333333 |
| 42 | 7.6 | 7.98833333333333 | -0.388333333333334 |
| 43 | 7.1 | 7.78833333333333 | -0.688333333333333 |
| 44 | 6.8 | 7.52833333333333 | -0.728333333333333 |
| 45 | 6.5 | 7.24833333333333 | -0.748333333333333 |
| 46 | 6.9 | 7.26833333333333 | -0.368333333333333 |
| 47 | 8.2 | 8.08833333333333 | 0.111666666666666 |
| 48 | 8.7 | 8.28833333333333 | 0.411666666666666 |
| 49 | 8.3 | 8.345 | -0.0449999999999986 |
| 50 | 7.9 | 7.905 | -0.00499999999999963 |
| 51 | 7.5 | 7.525 | -0.0249999999999998 |
| 52 | 7.8 | 7.625 | 0.175000000000000 |
| 53 | 8.3 | 7.805 | 0.495 |
| 54 | 8.4 | 7.785 | 0.615 |
| 55 | 8.2 | 7.585 | 0.615 |
| 56 | 7.7 | 7.325 | 0.375000000000000 |
| 57 | 7.2 | 7.045 | 0.155 |
| 58 | 7.3 | 7.065 | 0.235000000000000 |
| 59 | 8.1 | 7.885 | 0.215000000000000 |
| 60 | 8.5 | 8.085 | 0.414999999999999 |
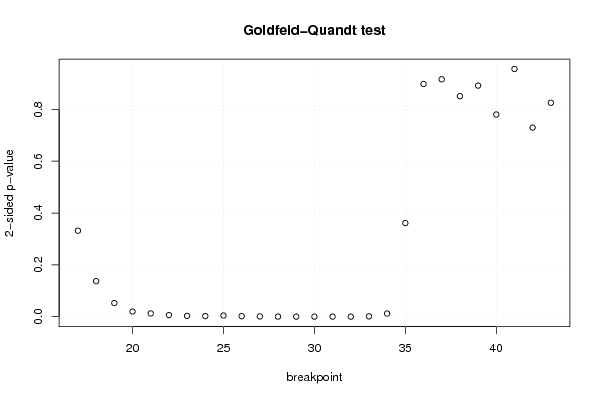
| Goldfeld-Quandt test for Heteroskedasticity | |||
| p-values | Alternative Hypothesis | ||
| breakpoint index | greater | 2-sided | less |
| 17 | 0.165919387815706 | 0.331838775631411 | 0.834080612184294 |
| 18 | 0.0685061751915904 | 0.137012350383181 | 0.93149382480841 |
| 19 | 0.0262290532772150 | 0.0524581065544299 | 0.973770946722785 |
| 20 | 0.00979198653032462 | 0.0195839730606492 | 0.990208013469675 |
| 21 | 0.00614245053337344 | 0.0122849010667469 | 0.993857549466627 |
| 22 | 0.0029528367940419 | 0.0059056735880838 | 0.997047163205958 |
| 23 | 0.00156780423797609 | 0.00313560847595219 | 0.998432195762024 |
| 24 | 0.00105647946626048 | 0.00211295893252096 | 0.99894352053374 |
| 25 | 0.00212283929047071 | 0.00424567858094142 | 0.99787716070953 |
| 26 | 0.000924386387254971 | 0.00184877277450994 | 0.999075613612745 |
| 27 | 0.000434944552306247 | 0.000869889104612494 | 0.999565055447694 |
| 28 | 0.000162381389302793 | 0.000324762778605587 | 0.999837618610697 |
| 29 | 5.22380539453475e-05 | 0.000104476107890695 | 0.999947761946055 |
| 30 | 1.61578184231980e-05 | 3.23156368463960e-05 | 0.999983842181577 |
| 31 | 6.24553203688844e-06 | 1.24910640737769e-05 | 0.999993754467963 |
| 32 | 5.59775451129938e-05 | 0.000111955090225988 | 0.999944022454887 |
| 33 | 0.000496309892376454 | 0.00099261978475291 | 0.999503690107624 |
| 34 | 0.00605514100883994 | 0.0121102820176799 | 0.99394485899116 |
| 35 | 0.180552988747298 | 0.361105977494595 | 0.819447011252702 |
| 36 | 0.550808313321141 | 0.898383373357718 | 0.449191686678859 |
| 37 | 0.45819456186791 | 0.91638912373582 | 0.54180543813209 |
| 38 | 0.425613248313819 | 0.851226496627638 | 0.574386751686181 |
| 39 | 0.553941814790109 | 0.892116370419782 | 0.446058185209891 |
| 40 | 0.609837768876502 | 0.780324462246996 | 0.390162231123498 |
| 41 | 0.478165992107335 | 0.95633198421467 | 0.521834007892665 |
| 42 | 0.364951088790473 | 0.729902177580946 | 0.635048911209527 |
| 43 | 0.412886536950994 | 0.825773073901988 | 0.587113463049006 |
| Meta Analysis of Goldfeld-Quandt test for Heteroskedasticity | |||
| Description | # significant tests | % significant tests | OK/NOK |
| 1% type I error level | 12 | 0.444444444444444 | NOK |
| 5% type I error level | 15 | 0.555555555555556 | NOK |
| 10% type I error level | 16 | 0.592592592592593 | NOK |