| Multiple Linear Regression - Estimated Regression Equation |
| inv[t] = -98.6031754376958 + 1.81249154252463cons[t] -10.1515734108020M1[t] -10.2323024500268M2[t] -10.1369413355362M3[t] -7.44036083710648M4[t] -8.40747637998386M5[t] -1.19343749233295M6[t] + 8.4281775125963M7[t] + 1.59241261367585M8[t] + 5.03144811833661M9[t] + 6.55181126262129M10[t] + 9.91851760828455M11[t] + 0.122127045043892t + e[t] |
| Multiple Linear Regression - Ordinary Least Squares | |||||
| Variable | Parameter | S.D. | T-STAT H0: parameter = 0 | 2-tail p-value | 1-tail p-value |
| (Intercept) | -98.6031754376958 | 29.989951 | -3.2879 | 0.001939 | 0.00097 |
| cons | 1.81249154252463 | 0.281335 | 6.4425 | 0 | 0 |
| M1 | -10.1515734108020 | 6.604696 | -1.537 | 0.131138 | 0.065569 |
| M2 | -10.2323024500268 | 8.846138 | -1.1567 | 0.253368 | 0.126684 |
| M3 | -10.1369413355362 | 8.570762 | -1.1827 | 0.242991 | 0.121496 |
| M4 | -7.44036083710648 | 7.712021 | -0.9648 | 0.339703 | 0.169851 |
| M5 | -8.40747637998386 | 7.913696 | -1.0624 | 0.293602 | 0.146801 |
| M6 | -1.19343749233295 | 6.703974 | -0.178 | 0.859489 | 0.429745 |
| M7 | 8.4281775125963 | 6.633268 | 1.2706 | 0.210263 | 0.105131 |
| M8 | 1.59241261367585 | 8.284602 | 0.1922 | 0.848421 | 0.42421 |
| M9 | 5.03144811833661 | 6.846958 | 0.7348 | 0.466164 | 0.233082 |
| M10 | 6.55181126262129 | 6.741149 | 0.9719 | 0.336177 | 0.168088 |
| M11 | 9.91851760828455 | 7.980517 | 1.2428 | 0.220224 | 0.110112 |
| t | 0.122127045043892 | 0.078371 | 1.5583 | 0.126011 | 0.063005 |
| Multiple Linear Regression - Regression Statistics | |
| Multiple R | 0.86276085439231 |
| R-squared | 0.744356291871749 |
| Adjusted R-squared | 0.67210915696594 |
| F-TEST (value) | 10.3029177951787 |
| F-TEST (DF numerator) | 13 |
| F-TEST (DF denominator) | 46 |
| p-value | 1.11456865958814e-09 |
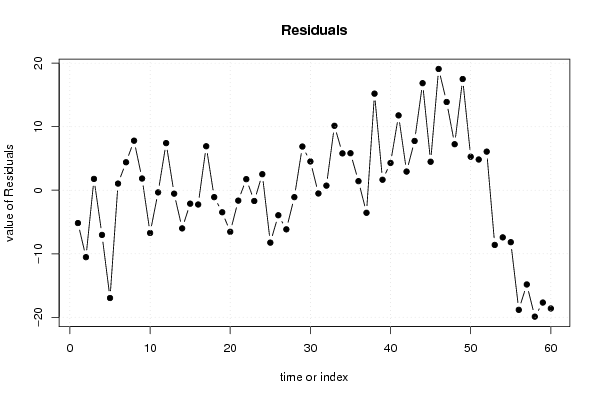
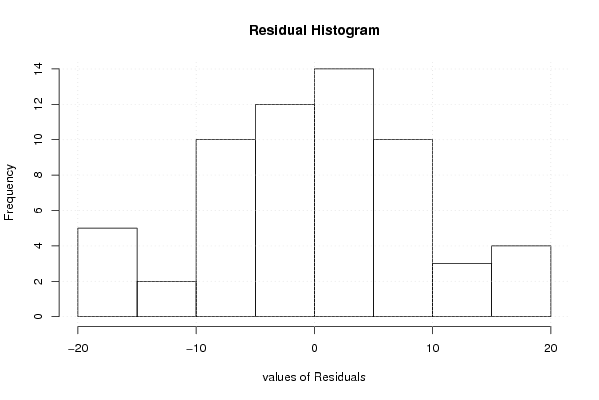
| Multiple Linear Regression - Residual Statistics | |
| Residual Standard Deviation | 10.2131534985726 |
| Sum Squared Residuals | 4798.19120172865 |
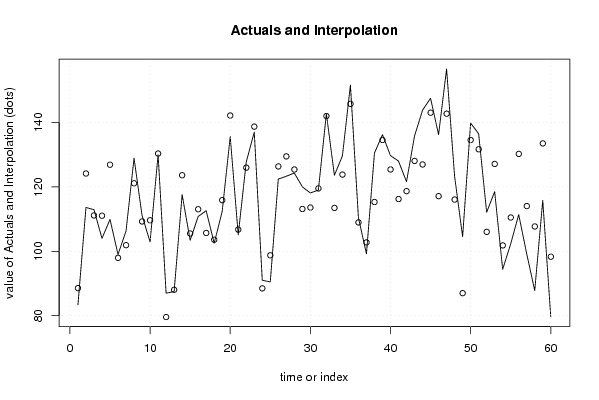
| Multiple Linear Regression - Actuals, Interpolation, and Residuals | |||
| Time or Index | Actuals | Interpolation Forecast | Residuals Prediction Error |
| 1 | 83.4 | 88.5664580232261 | -5.16645802322608 |
| 2 | 113.6 | 124.132690262528 | -10.5326902625276 |
| 3 | 112.9 | 111.118990161632 | 1.7810098383677 |
| 4 | 104 | 111.037711237067 | -7.03771123706654 |
| 5 | 109.9 | 126.867644930460 | -16.9676449304596 |
| 6 | 99 | 97.9539800126619 | 1.04601998733814 |
| 7 | 106.3 | 101.897749126556 | 4.40225087344379 |
| 8 | 128.9 | 121.102740330782 | 7.79725966921819 |
| 9 | 111.1 | 109.257724769027 | 1.84227523097287 |
| 10 | 102.9 | 109.631470878588 | -6.73147087858845 |
| 11 | 130 | 130.338973923280 | -0.338973923279582 |
| 12 | 87 | 79.5802744989823 | 7.41972550101768 |
| 13 | 87.5 | 88.0382418669755 | -0.538241866975468 |
| 14 | 117.6 | 123.604474106277 | -6.00447410627726 |
| 15 | 103.4 | 105.515797686313 | -2.11579768631297 |
| 16 | 110.8 | 113.046983240351 | -2.24698324035063 |
| 17 | 112.6 | 105.677025189428 | 6.92297481057151 |
| 18 | 102.5 | 103.588235100995 | -1.08823510099521 |
| 19 | 112.4 | 115.869465310503 | -3.46946531050285 |
| 20 | 135.6 | 142.143173530575 | -6.54317353057452 |
| 21 | 105.1 | 106.735767916000 | -1.63576791599965 |
| 22 | 127.7 | 125.959426067817 | 1.74057393218288 |
| 23 | 137 | 138.6919663254 | -1.6919663253999 |
| 24 | 91 | 88.47701436386 | 2.52298563614 |
| 25 | 90.5 | 98.7474732743778 | -8.24747327437777 |
| 26 | 122.4 | 126.338742726571 | -3.93874272657119 |
| 27 | 123.3 | 129.456217354145 | -6.15621735414507 |
| 28 | 124.3 | 125.387457036025 | -1.08745703602511 |
| 29 | 120 | 113.123771820286 | 6.87622817971354 |
| 30 | 118.1 | 113.572469891388 | 4.52753010861231 |
| 31 | 119 | 119.509979702059 | -0.509979702059099 |
| 32 | 142.7 | 141.977455682829 | 0.722544317170941 |
| 33 | 123.6 | 113.457517929848 | 10.1424820701522 |
| 34 | 129.6 | 123.799967523295 | 5.80003247670542 |
| 35 | 151.6 | 145.776214647753 | 5.82378535224705 |
| 36 | 110.4 | 108.973700100895 | 1.42629989910470 |
| 37 | 99.2 | 102.750485974439 | -3.55048597443897 |
| 38 | 130.5 | 115.298075623678 | 15.2019243763221 |
| 39 | 136.2 | 134.546724979721 | 1.65327502027895 |
| 40 | 129.7 | 125.402988342532 | 4.29701165746787 |
| 41 | 128 | 116.220538749085 | 11.7794612509147 |
| 42 | 121.6 | 118.662977516964 | 2.93702248303635 |
| 43 | 135.8 | 128.044221258432 | 7.75577874156814 |
| 44 | 143.8 | 126.949307186382 | 16.8506928136184 |
| 45 | 147.5 | 143.016661379506 | 4.48333862049376 |
| 46 | 136.2 | 117.109280122460 | 19.0907198775395 |
| 47 | 156.6 | 142.710510331968 | 13.8894896680319 |
| 48 | 123.3 | 116.057948423248 | 7.24205157675162 |
| 49 | 104.5 | 86.9973408609817 | 17.5026591390183 |
| 50 | 139.8 | 134.526017280946 | 5.27398271905397 |
| 51 | 136.5 | 131.662269818189 | 4.83773018181137 |
| 52 | 112.1 | 106.024860144026 | 6.0751398559744 |
| 53 | 118.5 | 127.11101931074 | -8.6110193107401 |
| 54 | 94.4 | 101.822337477992 | -7.42233747799158 |
| 55 | 102.3 | 110.47858460245 | -8.17858460244998 |
| 56 | 111.4 | 130.227323269433 | -18.8273232694330 |
| 57 | 99.2 | 114.032328005619 | -14.8323280056192 |
| 58 | 87.8 | 107.699855407839 | -19.8998554078394 |
| 59 | 115.8 | 133.482334771599 | -17.6823347715995 |
| 60 | 79.7 | 98.311062613014 | -18.611062613014 |
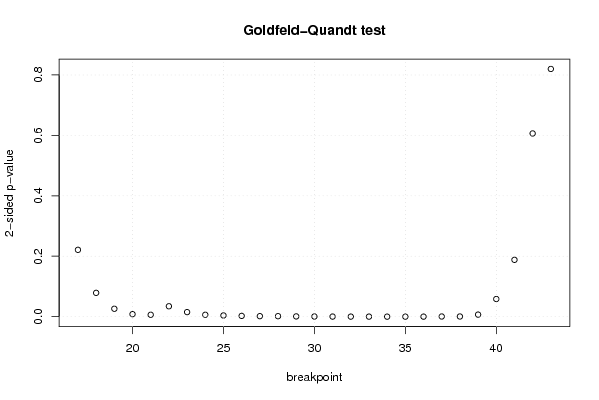
| Goldfeld-Quandt test for Heteroskedasticity | |||
| p-values | Alternative Hypothesis | ||
| breakpoint index | greater | 2-sided | less |
| 17 | 0.110598995204015 | 0.221197990408031 | 0.889401004795985 |
| 18 | 0.0394088564873929 | 0.0788177129747858 | 0.960591143512607 |
| 19 | 0.0130672167230793 | 0.0261344334461586 | 0.98693278327692 |
| 20 | 0.00412495730458185 | 0.0082499146091637 | 0.995875042695418 |
| 21 | 0.00312190383405896 | 0.00624380766811792 | 0.99687809616594 |
| 22 | 0.0171937578253876 | 0.0343875156507752 | 0.982806242174612 |
| 23 | 0.00755196325263573 | 0.0151039265052715 | 0.992448036747364 |
| 24 | 0.00309372504350047 | 0.00618745008700095 | 0.9969062749565 |
| 25 | 0.00197674120717798 | 0.00395348241435597 | 0.998023258792822 |
| 26 | 0.00129096028039929 | 0.00258192056079859 | 0.9987090397196 |
| 27 | 0.000810087660193326 | 0.00162017532038665 | 0.999189912339807 |
| 28 | 0.000796598487466947 | 0.00159319697493389 | 0.999203401512533 |
| 29 | 0.000411549687191279 | 0.000823099374382558 | 0.999588450312809 |
| 30 | 0.000246841308631414 | 0.000493682617262828 | 0.999753158691369 |
| 31 | 0.000132282220033331 | 0.000264564440066663 | 0.999867717779967 |
| 32 | 6.61612990178008e-05 | 0.000132322598035602 | 0.999933838700982 |
| 33 | 4.02360403236123e-05 | 8.04720806472245e-05 | 0.999959763959676 |
| 34 | 2.34080956225199e-05 | 4.68161912450399e-05 | 0.999976591904377 |
| 35 | 1.68394153099284e-05 | 3.36788306198569e-05 | 0.99998316058469 |
| 36 | 1.20754593279287e-05 | 2.41509186558574e-05 | 0.999987924540672 |
| 37 | 0.000257666659385439 | 0.000515333318770879 | 0.999742333340615 |
| 38 | 0.000272608650448351 | 0.000545217300896702 | 0.999727391349552 |
| 39 | 0.00337892349603056 | 0.00675784699206112 | 0.99662107650397 |
| 40 | 0.0292190563471465 | 0.058438112694293 | 0.970780943652854 |
| 41 | 0.094070711854913 | 0.188141423709826 | 0.905929288145087 |
| 42 | 0.303237790261706 | 0.606475580523413 | 0.696762209738294 |
| 43 | 0.589993326310043 | 0.820013347379914 | 0.410006673689957 |
| Meta Analysis of Goldfeld-Quandt test for Heteroskedasticity | |||
| Description | # significant tests | % significant tests | OK/NOK |
| 1% type I error level | 18 | 0.666666666666667 | NOK |
| 5% type I error level | 21 | 0.777777777777778 | NOK |
| 10% type I error level | 23 | 0.851851851851852 | NOK |