| Multiple Linear Regression - Estimated Regression Equation |
| Y[t] = + 49.328366603281 -0.651288616346723X[t] + 0.947192748369779Y1[t] -7.46602476253019M1[t] -12.5116219686066M2[t] -9.5229972894487M3[t] -12.4128790792859M4[t] -1.52744118751515M5[t] + 49.0216445212456M6[t] + 10.1956027171895M7[t] -7.6285553748178M8[t] -15.1264239823416M9[t] -16.2946658166632M10[t] + 0.284989259707416M11[t] -0.205098050841956t + e[t] |
| Multiple Linear Regression - Ordinary Least Squares | |||||
| Variable | Parameter | S.D. | T-STAT H0: parameter = 0 | 2-tail p-value | 1-tail p-value |
| (Intercept) | 49.328366603281 | 23.852712 | 2.068 | 0.044413 | 0.022207 |
| X | -0.651288616346723 | 0.296327 | -2.1979 | 0.033145 | 0.016572 |
| Y1 | 0.947192748369779 | 0.0398 | 23.7989 | 0 | 0 |
| M1 | -7.46602476253019 | 4.301168 | -1.7358 | 0.08944 | 0.04472 |
| M2 | -12.5116219686066 | 4.341435 | -2.8819 | 0.006038 | 0.003019 |
| M3 | -9.5229972894487 | 4.431793 | -2.1488 | 0.037068 | 0.018534 |
| M4 | -12.4128790792859 | 4.484485 | -2.768 | 0.00816 | 0.00408 |
| M5 | -1.52744118751515 | 4.623348 | -0.3304 | 0.742649 | 0.371325 |
| M6 | 49.0216445212456 | 4.600156 | 10.6565 | 0 | 0 |
| M7 | 10.1956027171895 | 4.337639 | 2.3505 | 0.023192 | 0.011596 |
| M8 | -7.6285553748178 | 4.387332 | -1.7388 | 0.088914 | 0.044457 |
| M9 | -15.1264239823416 | 4.302066 | -3.5161 | 0.001012 | 0.000506 |
| M10 | -16.2946658166632 | 4.218318 | -3.8628 | 0.000356 | 0.000178 |
| M11 | 0.284989259707416 | 4.198695 | 0.0679 | 0.946185 | 0.473093 |
| t | -0.205098050841956 | 0.083122 | -2.4674 | 0.017478 | 0.008739 |
| Multiple Linear Regression - Regression Statistics | |
| Multiple R | 0.99054160865246 |
| R-squared | 0.981172678471802 |
| Adjusted R-squared | 0.975315289551918 |
| F-TEST (value) | 167.510249343534 |
| F-TEST (DF numerator) | 14 |
| F-TEST (DF denominator) | 45 |
| p-value | 0 |
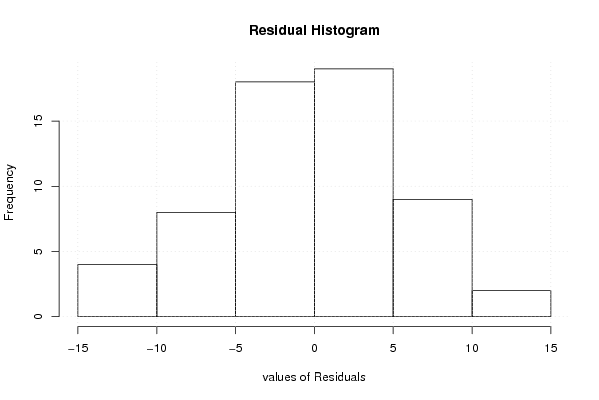
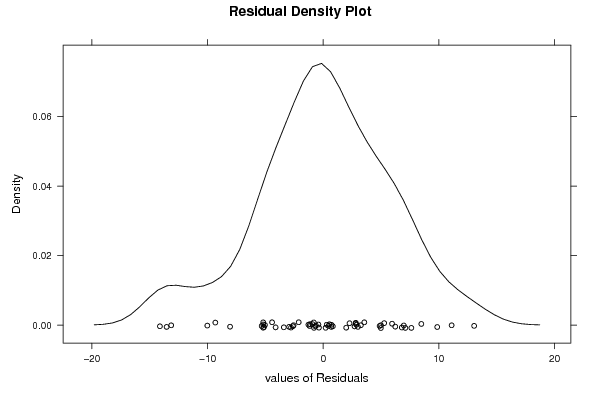
| Multiple Linear Regression - Residual Statistics | |
| Residual Standard Deviation | 6.62519234950304 |
| Sum Squared Residuals | 1975.19281505611 |
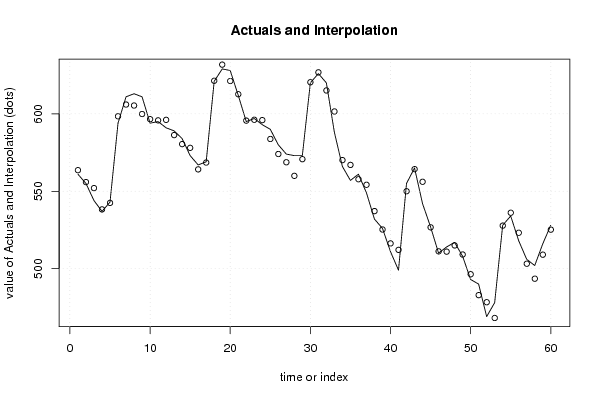
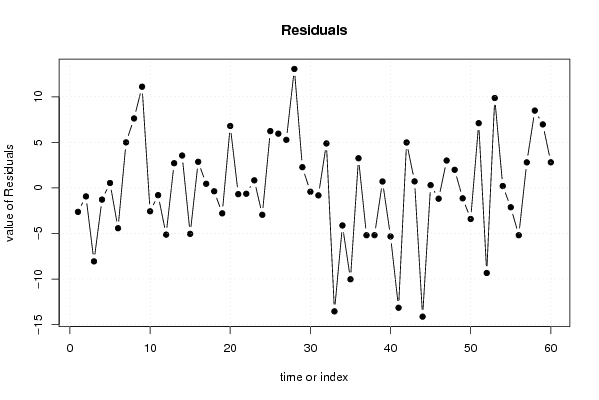
| Multiple Linear Regression - Actuals, Interpolation, and Residuals | |||
| Time or Index | Actuals | Interpolation Forecast | Residuals Prediction Error |
| 1 | 561 | 563.624079373812 | -2.62407937381185 |
| 2 | 555 | 555.928227550926 | -0.928227550926121 |
| 3 | 544 | 552.051664764503 | -8.05166476450334 |
| 4 | 537 | 538.277049245218 | -1.27704924521792 |
| 5 | 543 | 542.457297570828 | 0.542702429172447 |
| 6 | 594 | 598.41931285733 | -4.41931285733032 |
| 7 | 611 | 606.00165276679 | 4.99834723321046 |
| 8 | 613 | 605.37725057892 | 7.62274942108004 |
| 9 | 611 | 599.894313725467 | 11.1056862745328 |
| 10 | 594 | 596.561459481929 | -2.56145948192933 |
| 11 | 595 | 595.791677999017 | -0.791677999017001 |
| 12 | 591 | 596.118525713568 | -5.11852571356806 |
| 13 | 589 | 586.286853447584 | 2.71314655241640 |
| 14 | 584 | 580.444349926619 | 3.55565007338085 |
| 15 | 573 | 578.036010781643 | -5.03601078164348 |
| 16 | 567 | 564.131137539089 | 2.86886246091123 |
| 17 | 569 | 568.542161135087 | 0.457838864913215 |
| 18 | 621 | 621.366694044457 | -0.366694044457154 |
| 19 | 629 | 631.784963689692 | -2.78496368969167 |
| 20 | 628 | 621.202991810531 | 6.79700818946873 |
| 21 | 612 | 612.683090127065 | -0.68309012706509 |
| 22 | 595 | 595.633635374908 | -0.633635374907683 |
| 23 | 597 | 596.166431124689 | 0.833568875311195 |
| 24 | 593 | 595.942507770012 | -2.94250777001218 |
| 25 | 590 | 583.76619648518 | 6.23380351482047 |
| 26 | 580 | 574.045701442285 | 5.95429855771496 |
| 27 | 574 | 568.725006681231 | 5.2749933187687 |
| 28 | 573 | 559.946870350333 | 13.0531296496665 |
| 29 | 573 | 570.722079229047 | 2.27792077095277 |
| 30 | 620 | 620.414778270619 | -0.414778270619278 |
| 31 | 626 | 626.813501651986 | -0.813501651986298 |
| 32 | 620 | 615.118690615702 | 4.88130938429759 |
| 33 | 588 | 601.537180882214 | -13.5371808822140 |
| 34 | 566 | 570.114188495756 | -4.11418849575617 |
| 35 | 557 | 567.018211151478 | -10.0182111514778 |
| 36 | 561 | 557.742873659062 | 3.25712634093825 |
| 37 | 549 | 554.186166147342 | -5.18616614734208 |
| 38 | 532 | 537.178384740178 | -5.17838474017835 |
| 39 | 526 | 525.292469602171 | 0.707530397829175 |
| 40 | 511 | 516.318946686369 | -5.31894668636903 |
| 41 | 499 | 512.140106685404 | -13.1401066854044 |
| 42 | 555 | 550.010590715096 | 4.98940928490363 |
| 43 | 565 | 564.282760215445 | 0.717239784555338 |
| 44 | 542 | 556.116204726101 | -14.1162047261012 |
| 45 | 527 | 526.692933716865 | 0.307066283134788 |
| 46 | 510 | 511.17683146779 | -1.17683146778963 |
| 47 | 514 | 510.993209739589 | 3.00679026041063 |
| 48 | 517 | 515.0083109005 | 1.99168909949949 |
| 49 | 508 | 509.136704546083 | -1.13670454608293 |
| 50 | 493 | 496.403336339991 | -3.40333633999134 |
| 51 | 490 | 482.894848170451 | 7.10515182954894 |
| 52 | 469 | 478.325996178991 | -9.32599617899074 |
| 53 | 478 | 468.138355379634 | 9.86164462036595 |
| 54 | 528 | 527.788624112497 | 0.211375887503119 |
| 55 | 534 | 536.117121676088 | -2.11712167608783 |
| 56 | 518 | 523.184862268745 | -5.18486226874515 |
| 57 | 506 | 503.192481548389 | 2.80751845161147 |
| 58 | 502 | 493.513885179617 | 8.4861148203828 |
| 59 | 516 | 509.030469985227 | 6.96953001477299 |
| 60 | 528 | 525.187781956858 | 2.8122180431425 |
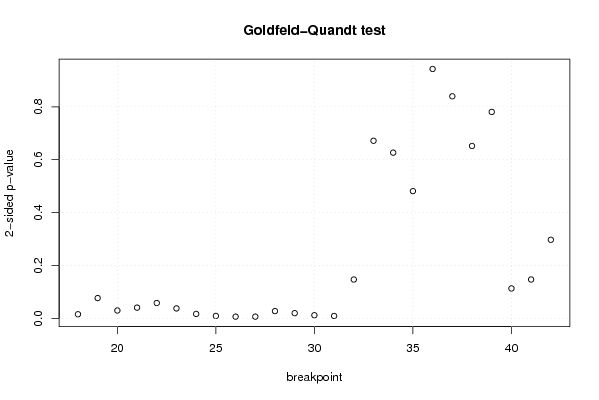
| Goldfeld-Quandt test for Heteroskedasticity | |||
| p-values | Alternative Hypothesis | ||
| breakpoint index | greater | 2-sided | less |
| 18 | 0.00776634328312592 | 0.0155326865662518 | 0.992233656716874 |
| 19 | 0.0383388743687602 | 0.0766777487375204 | 0.96166112563124 |
| 20 | 0.0148639951388774 | 0.0297279902777547 | 0.985136004861123 |
| 21 | 0.0202561220930235 | 0.040512244186047 | 0.979743877906976 |
| 22 | 0.0289815880480547 | 0.0579631760961094 | 0.971018411951945 |
| 23 | 0.0188005025660338 | 0.0376010051320675 | 0.981199497433966 |
| 24 | 0.00836264887256025 | 0.0167252977451205 | 0.99163735112744 |
| 25 | 0.00458221527031271 | 0.00916443054062542 | 0.995417784729687 |
| 26 | 0.00321528310837400 | 0.00643056621674799 | 0.996784716891626 |
| 27 | 0.00322516498888334 | 0.00645032997776668 | 0.996774835011117 |
| 28 | 0.0137758728120099 | 0.0275517456240198 | 0.98622412718799 |
| 29 | 0.00979972438159918 | 0.0195994487631984 | 0.9902002756184 |
| 30 | 0.00593410863961332 | 0.0118682172792266 | 0.994065891360387 |
| 31 | 0.00452687117165917 | 0.00905374234331834 | 0.99547312882834 |
| 32 | 0.0734298286707038 | 0.146859657341408 | 0.926570171329296 |
| 33 | 0.335866706298841 | 0.671733412597682 | 0.664133293701159 |
| 34 | 0.313359517700108 | 0.626719035400217 | 0.686640482299892 |
| 35 | 0.240686419697996 | 0.481372839395992 | 0.759313580302004 |
| 36 | 0.471672784947965 | 0.94334556989593 | 0.528327215052035 |
| 37 | 0.419943880472316 | 0.839887760944633 | 0.580056119527684 |
| 38 | 0.673989208575194 | 0.652021582849613 | 0.326010791424807 |
| 39 | 0.609567827522405 | 0.78086434495519 | 0.390432172477595 |
| 40 | 0.943435486750927 | 0.113129026498145 | 0.0565645132490726 |
| 41 | 0.926502887804866 | 0.146994224390268 | 0.0734971121951342 |
| 42 | 0.851399457911113 | 0.297201084177773 | 0.148600542088887 |
| Meta Analysis of Goldfeld-Quandt test for Heteroskedasticity | |||
| Description | # significant tests | % significant tests | OK/NOK |
| 1% type I error level | 4 | 0.16 | NOK |
| 5% type I error level | 12 | 0.48 | NOK |
| 10% type I error level | 14 | 0.56 | NOK |