| Multiple Linear Regression - Estimated Regression Equation |
| Y[t] = + 58.2998057129362 -0.668637279101902X[t] + 0.961166527491067Y1[t] + 0.0391683255838521Y2[t] + 0.0478769811627857Y3[t] -0.127097092762909Y4[t] -4.4972676862563M1[t] + 6.69352067183267M2[t] + 56.6788489417115M3[t] + 16.6872113068170M4[t] -4.55219702469572M5[t] -14.5874408744148M6[t] -9.10435377427196M7[t] + 9.94245587206924M8[t] + 9.88391350018948M9[t] + 2.43364712654867M10[t] -5.18399963045349M11[t] -0.254141845139373t + e[t] |
| Multiple Linear Regression - Ordinary Least Squares | |||||
| Variable | Parameter | S.D. | T-STAT H0: parameter = 0 | 2-tail p-value | 1-tail p-value |
| (Intercept) | 58.2998057129362 | 27.458505 | 2.1232 | 0.040137 | 0.020069 |
| X | -0.668637279101902 | 0.344845 | -1.939 | 0.059767 | 0.029884 |
| Y1 | 0.961166527491067 | 0.161395 | 5.9554 | 1e-06 | 0 |
| Y2 | 0.0391683255838521 | 0.224454 | 0.1745 | 0.862371 | 0.431186 |
| Y3 | 0.0478769811627857 | 0.222987 | 0.2147 | 0.831114 | 0.415557 |
| Y4 | -0.127097092762909 | 0.165009 | -0.7702 | 0.445797 | 0.222898 |
| M1 | -4.4972676862563 | 4.845255 | -0.9282 | 0.359024 | 0.179512 |
| M2 | 6.69352067183267 | 5.063393 | 1.3219 | 0.193889 | 0.096944 |
| M3 | 56.6788489417115 | 5.335302 | 10.6234 | 0 | 0 |
| M4 | 16.6872113068170 | 11.212649 | 1.4882 | 0.144727 | 0.072364 |
| M5 | -4.55219702469572 | 10.654938 | -0.4272 | 0.671555 | 0.335778 |
| M6 | -14.5874408744148 | 10.20374 | -1.4296 | 0.160789 | 0.080395 |
| M7 | -9.10435377427196 | 5.147178 | -1.7688 | 0.084747 | 0.042374 |
| M8 | 9.94245587206924 | 5.180107 | 1.9194 | 0.062278 | 0.031139 |
| M9 | 9.88391350018948 | 5.87144 | 1.6834 | 0.10029 | 0.050145 |
| M10 | 2.43364712654867 | 6.063902 | 0.4013 | 0.690365 | 0.345183 |
| M11 | -5.18399963045349 | 4.995633 | -1.0377 | 0.305798 | 0.152899 |
| t | -0.254141845139373 | 0.110433 | -2.3013 | 0.026803 | 0.013401 |
| Multiple Linear Regression - Regression Statistics | |
| Multiple R | 0.991290024248878 |
| R-squared | 0.98265591217534 |
| Adjusted R-squared | 0.975095668764592 |
| F-TEST (value) | 129.976755877757 |
| F-TEST (DF numerator) | 17 |
| F-TEST (DF denominator) | 39 |
| p-value | 0 |
| Multiple Linear Regression - Residual Statistics | |
| Residual Standard Deviation | 6.82215927009146 |
| Sum Squared Residuals | 1815.1324271533 |
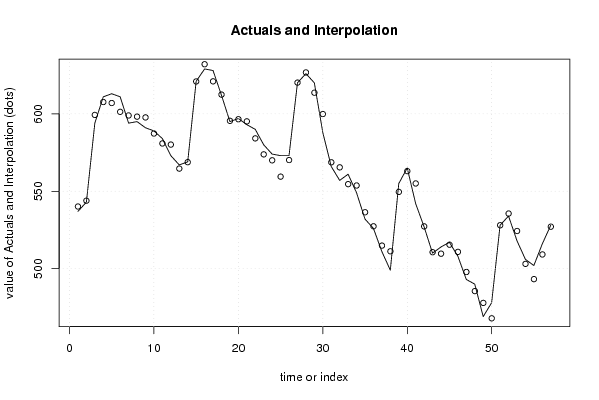
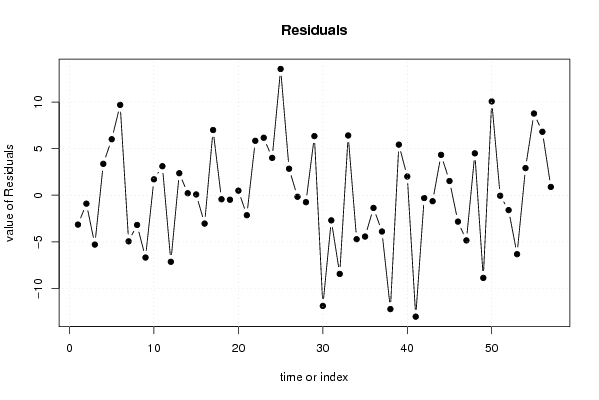
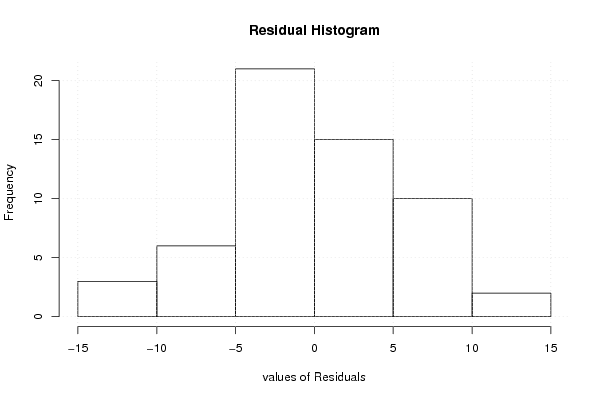
| Multiple Linear Regression - Actuals, Interpolation, and Residuals | |||
| Time or Index | Actuals | Interpolation Forecast | Residuals Prediction Error |
| 1 | 537 | 540.152218825339 | -3.15221882533875 |
| 2 | 543 | 543.903410726035 | -0.903410726035087 |
| 3 | 594 | 599.296490072511 | -5.29649007251066 |
| 4 | 611 | 607.629685674612 | 3.37031432538824 |
| 5 | 613 | 606.987767164605 | 6.01223283539486 |
| 6 | 611 | 601.30003818193 | 9.69996181807006 |
| 7 | 594 | 598.950080254068 | -4.95008025406777 |
| 8 | 595 | 598.189864175547 | -3.18986417554682 |
| 9 | 591 | 597.688809347421 | -6.68880934742142 |
| 10 | 589 | 587.290782047774 | 1.70921795222589 |
| 11 | 584 | 580.885789204651 | 3.11421079534892 |
| 12 | 573 | 580.144826588557 | -7.14482658855679 |
| 13 | 567 | 564.636195668105 | 2.36380433189497 |
| 14 | 569 | 568.788027163206 | 0.211972836793970 |
| 15 | 621 | 620.91714891164 | 0.0828510883598304 |
| 16 | 629 | 632.041762829455 | -3.04176282945526 |
| 17 | 628 | 620.998906866175 | 7.00109313382533 |
| 18 | 612 | 612.430837539255 | -0.430837539255436 |
| 19 | 595 | 595.481007231167 | -0.481007231167442 |
| 20 | 597 | 596.509952044054 | 0.490047955945787 |
| 21 | 593 | 595.143211543495 | -2.14321154349531 |
| 22 | 590 | 584.156617663346 | 5.84338233665436 |
| 23 | 580 | 573.829467517936 | 6.17053248206424 |
| 24 | 574 | 569.988591227525 | 4.0114087724753 |
| 25 | 573 | 559.443256702907 | 13.5567432970926 |
| 26 | 573 | 570.156067848087 | 2.84393215191329 |
| 27 | 620 | 620.163157708793 | -0.163157708792835 |
| 28 | 626 | 626.743002786996 | -0.743002786996366 |
| 29 | 620 | 613.653097449597 | 6.34690255040347 |
| 30 | 588 | 599.881349474215 | -11.8813494742152 |
| 31 | 566 | 568.699109334762 | -2.69910933476215 |
| 32 | 557 | 565.447020955037 | -8.44702095503706 |
| 33 | 561 | 554.585199075481 | 6.41480092451887 |
| 34 | 549 | 553.721074058793 | -4.72107405879328 |
| 35 | 532 | 536.436021271952 | -4.43602127195213 |
| 36 | 526 | 527.362411956453 | -1.36241195645339 |
| 37 | 511 | 514.89463839645 | -3.8946383964502 |
| 38 | 499 | 511.221396197816 | -12.2213961978163 |
| 39 | 555 | 549.567764724425 | 5.43223527557525 |
| 40 | 565 | 562.989173627661 | 2.01082637233926 |
| 41 | 542 | 555.033829943566 | -13.0338299435664 |
| 42 | 527 | 527.302437158433 | -0.302437158433059 |
| 43 | 510 | 510.641209357457 | -0.641209357457052 |
| 44 | 514 | 509.666333717808 | 4.33366628219154 |
| 45 | 517 | 515.473033498945 | 1.52696650105468 |
| 46 | 508 | 510.831526230087 | -2.83152623008697 |
| 47 | 493 | 497.848722005461 | -4.84872200546102 |
| 48 | 490 | 485.504170227465 | 4.49582977253489 |
| 49 | 469 | 477.873690407199 | -8.87369040719865 |
| 50 | 478 | 467.931098064856 | 10.0689019351442 |
| 51 | 528 | 528.055438582632 | -0.0554385826315939 |
| 52 | 534 | 535.596375081276 | -1.59637508127588 |
| 53 | 518 | 524.326398576057 | -6.32639857605727 |
| 54 | 506 | 503.085337646166 | 2.91466235383363 |
| 55 | 502 | 493.228593822546 | 8.77140617745442 |
| 56 | 516 | 509.186829107553 | 6.81317089244655 |
| 57 | 528 | 527.109746534657 | 0.890253465343169 |
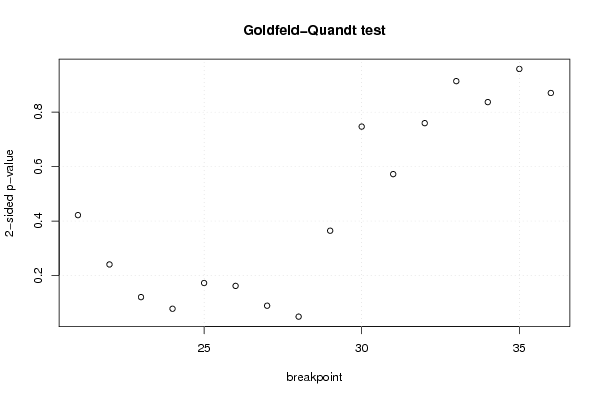
| Goldfeld-Quandt test for Heteroskedasticity | |||
| p-values | Alternative Hypothesis | ||
| breakpoint index | greater | 2-sided | less |
| 21 | 0.210926310164594 | 0.421852620329188 | 0.789073689835406 |
| 22 | 0.120344048047937 | 0.240688096095874 | 0.879655951952063 |
| 23 | 0.0604029867858278 | 0.120805973571656 | 0.939597013214172 |
| 24 | 0.0390324428211412 | 0.0780648856422823 | 0.96096755717886 |
| 25 | 0.0862966100043207 | 0.172593220008641 | 0.91370338999568 |
| 26 | 0.0809994378614731 | 0.161998875722946 | 0.919000562138527 |
| 27 | 0.0445846410200745 | 0.0891692820401489 | 0.955415358979925 |
| 28 | 0.0245077663027179 | 0.0490155326054359 | 0.975492233697282 |
| 29 | 0.182278051434818 | 0.364556102869636 | 0.817721948565182 |
| 30 | 0.626556396540206 | 0.746887206919588 | 0.373443603459794 |
| 31 | 0.713829045464549 | 0.572341909070901 | 0.286170954535451 |
| 32 | 0.620223175556669 | 0.759553648886661 | 0.379776824443331 |
| 33 | 0.543080048758 | 0.913839902484001 | 0.456919951242000 |
| 34 | 0.418451084413337 | 0.836902168826673 | 0.581548915586664 |
| 35 | 0.479300710712457 | 0.958601421424913 | 0.520699289287543 |
| 36 | 0.435161707796765 | 0.87032341559353 | 0.564838292203235 |
| Meta Analysis of Goldfeld-Quandt test for Heteroskedasticity | |||
| Description | # significant tests | % significant tests | OK/NOK |
| 1% type I error level | 0 | 0 | OK |
| 5% type I error level | 1 | 0.0625 | NOK |
| 10% type I error level | 3 | 0.1875 | NOK |