| Multiple Linear Regression - Estimated Regression Equation |
| TWIB[t] = + 2.82378101219517 -0.00508086181364818GI[t] + 1.32411297292159TWIB1[t] -0.64390045548293TWIB2[t] -0.0999061494232035M1[t] -0.0434877570194206M2[t] + 0.679808204282157M3[t] -0.266939596683318M4[t] -0.0382867494972436M5[t] -0.0765162377199005M6[t] + 0.0417633025188104M7[t] + 0.265115558769458M8[t] + 0.136208857605767M9[t] -0.0106577324371968M10[t] -0.0188635725354176M11[t] -0.0115981810749348t + e[t] |
| Multiple Linear Regression - Ordinary Least Squares | |||||
| Variable | Parameter | S.D. | T-STAT H0: parameter = 0 | 2-tail p-value | 1-tail p-value |
| (Intercept) | 2.82378101219517 | 0.558775 | 5.0535 | 1e-05 | 5e-06 |
| GI | -0.00508086181364818 | 0.029186 | -0.1741 | 0.862678 | 0.431339 |
| TWIB1 | 1.32411297292159 | 0.102341 | 12.9383 | 0 | 0 |
| TWIB2 | -0.64390045548293 | 0.104332 | -6.1716 | 0 | 0 |
| M1 | -0.0999061494232035 | 0.118572 | -0.8426 | 0.404474 | 0.202237 |
| M2 | -0.0434877570194206 | 0.120697 | -0.3603 | 0.720515 | 0.360257 |
| M3 | 0.679808204282157 | 0.122643 | 5.543 | 2e-06 | 1e-06 |
| M4 | -0.266939596683318 | 0.147656 | -1.8078 | 0.078154 | 0.039077 |
| M5 | -0.0382867494972436 | 0.118652 | -0.3227 | 0.748617 | 0.374308 |
| M6 | -0.0765162377199005 | 0.116339 | -0.6577 | 0.514497 | 0.257249 |
| M7 | 0.0417633025188104 | 0.116731 | 0.3578 | 0.722393 | 0.361197 |
| M8 | 0.265115558769458 | 0.116836 | 2.2691 | 0.028726 | 0.014363 |
| M9 | 0.136208857605767 | 0.125326 | 1.0868 | 0.283615 | 0.141807 |
| M10 | -0.0106577324371968 | 0.125573 | -0.0849 | 0.932786 | 0.466393 |
| M11 | -0.0188635725354176 | 0.122711 | -0.1537 | 0.8786 | 0.4393 |
| t | -0.0115981810749348 | 0.002468 | -4.6995 | 3.1e-05 | 1.5e-05 |
| Multiple Linear Regression - Regression Statistics | |
| Multiple R | 0.980218702324364 |
| R-squared | 0.96082870438646 |
| Adjusted R-squared | 0.946139468531384 |
| F-TEST (value) | 65.4103939691571 |
| F-TEST (DF numerator) | 15 |
| F-TEST (DF denominator) | 40 |
| p-value | 0 |
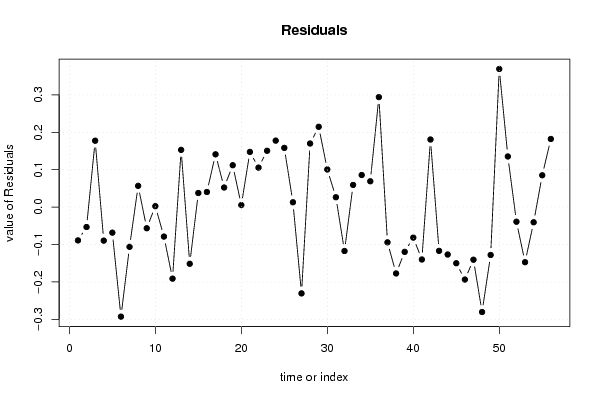
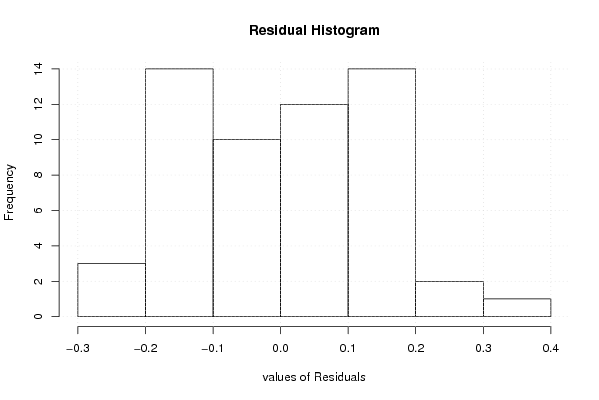
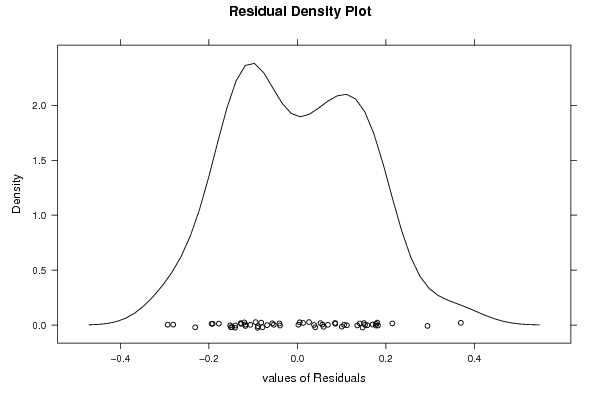
| Multiple Linear Regression - Residual Statistics | |
| Residual Standard Deviation | 0.172624993167688 |
| Sum Squared Residuals | 1.19197553064577 |
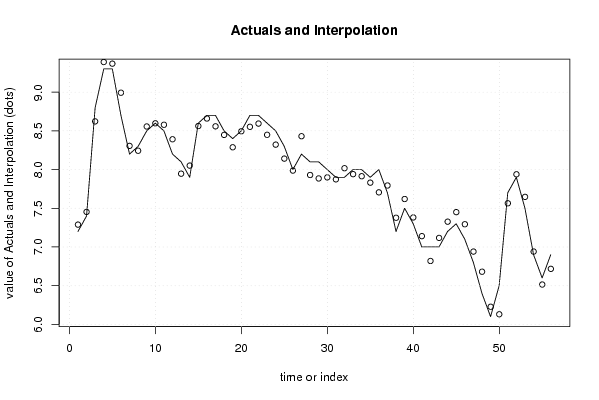
| Multiple Linear Regression - Actuals, Interpolation, and Residuals | |||
| Time or Index | Actuals | Interpolation Forecast | Residuals Prediction Error |
| 1 | 7.2 | 7.28909656065474 | -0.0890965606547376 |
| 2 | 7.4 | 7.45332750303755 | -0.0533275030375519 |
| 3 | 8.8 | 8.62250992831203 | 0.177490071687974 |
| 4 | 9.3 | 9.38965010344663 | -0.0896501034466272 |
| 5 | 9.3 | 9.36831679070519 | -0.0683167907051918 |
| 6 | 8.7 | 8.99298229039658 | -0.292982290396583 |
| 7 | 8.2 | 8.30621203817013 | -0.106212038170130 |
| 8 | 8.3 | 8.24326607253753 | 0.056733927462467 |
| 9 | 8.5 | 8.55661462915117 | -0.0566146291511691 |
| 10 | 8.6 | 8.59756623470657 | 0.00243376529343414 |
| 11 | 8.5 | 8.57885298882216 | -0.078852988822159 |
| 12 | 8.2 | 8.39134938216765 | -0.19134938216765 |
| 13 | 8.1 | 7.94700120534132 | 0.152998794658675 |
| 14 | 7.9 | 8.05156408366016 | -0.151564083660164 |
| 15 | 8.6 | 8.56232122866942 | 0.0376787713305824 |
| 16 | 8.7 | 8.6596344187707 | 0.0403655812292921 |
| 17 | 8.7 | 8.55887814951732 | 0.141121850482679 |
| 18 | 8.5 | 8.44770895175962 | 0.0522910482403754 |
| 19 | 8.4 | 8.28804345779499 | 0.111956542205012 |
| 20 | 8.5 | 8.49464206823103 | 0.00535793176896607 |
| 21 | 8.7 | 8.55246278737695 | 0.147537212623046 |
| 22 | 8.7 | 8.59443056529508 | 0.105569434704919 |
| 23 | 8.6 | 8.4494030562949 | 0.150596943705106 |
| 24 | 8.5 | 8.32222480573776 | 0.177775194262242 |
| 25 | 8.3 | 8.14168305113302 | 0.158316948866977 |
| 26 | 8 | 7.98708688578858 | 0.0129131142114237 |
| 27 | 8.2 | 8.43083895141669 | -0.230838951416692 |
| 28 | 8.1 | 7.92997761442411 | 0.170022385575887 |
| 29 | 8.1 | 7.88533280596514 | 0.214667194034856 |
| 30 | 8 | 7.89938709603448 | 0.100612903965520 |
| 31 | 7.9 | 7.8736571579061 | 0.0263428420939034 |
| 32 | 7.9 | 8.01738998133794 | -0.117389981337944 |
| 33 | 8 | 7.94076705846625 | 0.0592329415337546 |
| 34 | 8 | 7.91420549845914 | 0.0857945015408585 |
| 35 | 7.9 | 7.83102760410042 | 0.0689723958995777 |
| 36 | 8 | 7.70588169826875 | 0.294118301731254 |
| 37 | 7.7 | 7.79422722769925 | -0.0942272276992488 |
| 38 | 7.2 | 7.37742350160333 | -0.177423501603326 |
| 39 | 7.5 | 7.61972684583269 | -0.119726845832687 |
| 40 | 7.3 | 7.38158115577295 | -0.0815811557729485 |
| 41 | 7 | 7.14013500447353 | -0.140135004473526 |
| 42 | 7 | 6.81931310348922 | 0.180686896510782 |
| 43 | 7 | 7.11713225457241 | -0.117132254572414 |
| 44 | 7.2 | 7.32685398502267 | -0.126853985022668 |
| 45 | 7.3 | 7.45015552500563 | -0.150155525005631 |
| 46 | 7.1 | 7.29379770153921 | -0.193797701539212 |
| 47 | 6.8 | 6.94071635078252 | -0.140716350782525 |
| 48 | 6.4 | 6.68054411382585 | -0.280544113825845 |
| 49 | 6.1 | 6.22799195517167 | -0.127991955171666 |
| 50 | 6.5 | 6.13059802591038 | 0.369401974089618 |
| 51 | 7.7 | 7.56460304576918 | 0.135396954230822 |
| 52 | 7.9 | 7.9391567075856 | -0.0391567075856032 |
| 53 | 7.5 | 7.64733724933882 | -0.147337249338817 |
| 54 | 6.9 | 6.94060855832010 | -0.0406085583200948 |
| 55 | 6.6 | 6.51495509155637 | 0.0850449084436289 |
| 56 | 6.9 | 6.71784789287082 | 0.182152107129178 |
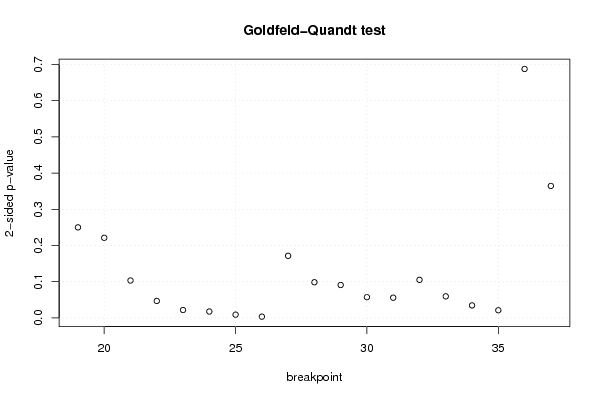
| Goldfeld-Quandt test for Heteroskedasticity | |||
| p-values | Alternative Hypothesis | ||
| breakpoint index | greater | 2-sided | less |
| 19 | 0.125089573354652 | 0.250179146709304 | 0.874910426645348 |
| 20 | 0.110664218631085 | 0.221328437262171 | 0.889335781368915 |
| 21 | 0.0517514508312928 | 0.103502901662586 | 0.948248549168707 |
| 22 | 0.0235045655458441 | 0.0470091310916883 | 0.976495434454156 |
| 23 | 0.0109720238087526 | 0.0219440476175052 | 0.989027976191247 |
| 24 | 0.00886499696052881 | 0.0177299939210576 | 0.991135003039471 |
| 25 | 0.00452822379201262 | 0.00905644758402524 | 0.995471776207987 |
| 26 | 0.00179681099701878 | 0.00359362199403755 | 0.998203189002981 |
| 27 | 0.085789998449837 | 0.171579996899674 | 0.914210001550163 |
| 28 | 0.0492997936502471 | 0.0985995873004942 | 0.950700206349753 |
| 29 | 0.0454866731818224 | 0.0909733463636448 | 0.954513326818178 |
| 30 | 0.0287221985528417 | 0.0574443971056834 | 0.971277801447158 |
| 31 | 0.0279640038131412 | 0.0559280076262823 | 0.97203599618686 |
| 32 | 0.0526198730358525 | 0.105239746071705 | 0.947380126964148 |
| 33 | 0.0298528430185823 | 0.0597056860371647 | 0.970147156981418 |
| 34 | 0.0173382138586087 | 0.0346764277172175 | 0.982661786141391 |
| 35 | 0.0106223744790231 | 0.0212447489580462 | 0.989377625520977 |
| 36 | 0.343795565276888 | 0.687591130553777 | 0.656204434723112 |
| 37 | 0.817747413324613 | 0.364505173350775 | 0.182252586675388 |
| Meta Analysis of Goldfeld-Quandt test for Heteroskedasticity | |||
| Description | # significant tests | % significant tests | OK/NOK |
| 1% type I error level | 2 | 0.105263157894737 | NOK |
| 5% type I error level | 7 | 0.368421052631579 | NOK |
| 10% type I error level | 12 | 0.631578947368421 | NOK |