| Multiple Linear Regression - Estimated Regression Equation |
| TWIB[t] = + 8.94570339635394 -0.0524066112185449GI[t] + 0.177266874857880M1[t] + 0.169853702904038M2[t] -0.0186076012741805M3[t] -0.286020773228028M4[t] -0.488193284060021M5[t] -0.536654588238240M6[t] + 0.255932239807913M7[t] + 0.380134010059099M8[t] + 0.270624573656509M9[t] + 0.00425953392703265M10[t] -0.170490563597411M11[t] -0.0294424313730398t + e[t] |
| Multiple Linear Regression - Ordinary Least Squares | |||||
| Variable | Parameter | S.D. | T-STAT H0: parameter = 0 | 2-tail p-value | 1-tail p-value |
| (Intercept) | 8.94570339635394 | 0.253406 | 35.3019 | 0 | 0 |
| GI | -0.0524066112185449 | 0.073392 | -0.7141 | 0.478797 | 0.239398 |
| M1 | 0.177266874857880 | 0.295987 | 0.5989 | 0.552177 | 0.276089 |
| M2 | 0.169853702904038 | 0.295577 | 0.5747 | 0.568328 | 0.284164 |
| M3 | -0.0186076012741805 | 0.295177 | -0.063 | 0.950009 | 0.475004 |
| M4 | -0.286020773228028 | 0.294858 | -0.97 | 0.337106 | 0.168553 |
| M5 | -0.488193284060021 | 0.294934 | -1.6553 | 0.104679 | 0.052339 |
| M6 | -0.536654588238240 | 0.29466 | -1.8213 | 0.075073 | 0.037537 |
| M7 | 0.255932239807913 | 0.294519 | 0.869 | 0.389368 | 0.194684 |
| M8 | 0.380134010059099 | 0.293845 | 1.2937 | 0.202243 | 0.101121 |
| M9 | 0.270624573656509 | 0.293657 | 0.9216 | 0.361563 | 0.180781 |
| M10 | 0.00425953392703265 | 0.293639 | 0.0145 | 0.988489 | 0.494245 |
| M11 | -0.170490563597411 | 0.2934 | -0.5811 | 0.56402 | 0.28201 |
| t | -0.0294424313730398 | 0.00458 | -6.4278 | 0 | 0 |
| Multiple Linear Regression - Regression Statistics | |
| Multiple R | 0.834480053008709 |
| R-squared | 0.696356958869417 |
| Adjusted R-squared | 0.610544795071644 |
| F-TEST (value) | 8.11489802903078 |
| F-TEST (DF numerator) | 13 |
| F-TEST (DF denominator) | 46 |
| p-value | 4.13355589756748e-08 |
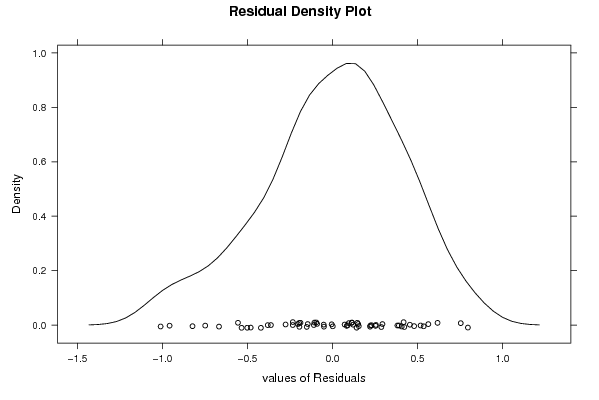
| Multiple Linear Regression - Residual Statistics | |
| Residual Standard Deviation | 0.463867330782165 |
| Sum Squared Residuals | 9.89795342608065 |
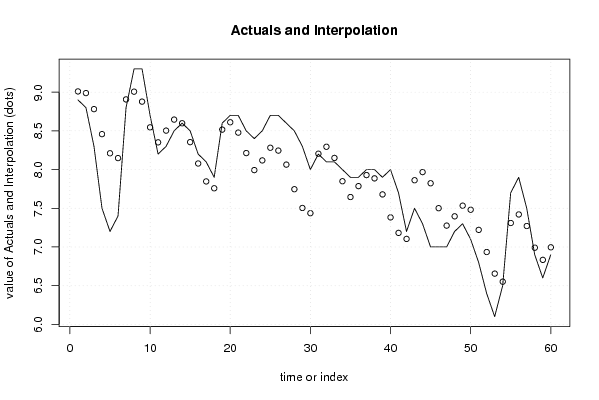
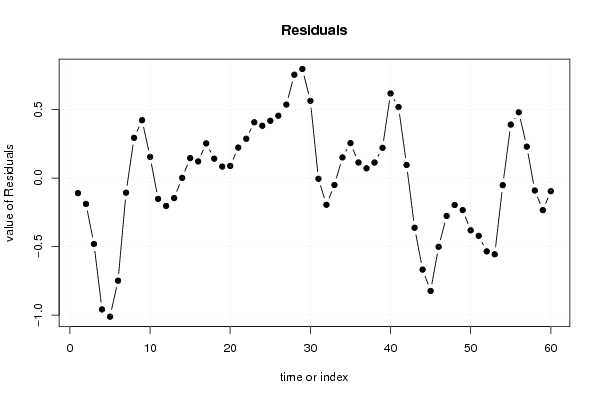
| Multiple Linear Regression - Actuals, Interpolation, and Residuals | |||
| Time or Index | Actuals | Interpolation Forecast | Residuals Prediction Error |
| 1 | 8.9 | 9.00967726188914 | -0.109677261889136 |
| 2 | 8.8 | 8.9885436419278 | -0.18854364192779 |
| 3 | 8.3 | 8.78112122862024 | -0.481121228620242 |
| 4 | 7.5 | 8.45806231968408 | -0.958062319684083 |
| 5 | 7.2 | 8.21072539411349 | -1.01072539411349 |
| 6 | 7.4 | 8.14854364192779 | -0.748543641927792 |
| 7 | 8.8 | 8.90644737747905 | -0.106447377479049 |
| 8 | 9.3 | 9.00644737747905 | 0.293552622520952 |
| 9 | 9.3 | 8.87797683194713 | 0.422023168052872 |
| 10 | 8.7 | 8.54548473299163 | 0.154515267008368 |
| 11 | 8.2 | 8.35177352633786 | -0.151773526337857 |
| 12 | 8.3 | 8.50330298080594 | -0.203302980805937 |
| 13 | 8.5 | 8.64588676316892 | -0.145886763168923 |
| 14 | 8.6 | 8.59854983759833 | 0.00145016240166682 |
| 15 | 8.5 | 8.3544427964378 | 0.145557203562198 |
| 16 | 8.2 | 8.07854983759833 | 0.121450162401667 |
| 17 | 8.1 | 7.8469348953933 | 0.2530651046067 |
| 18 | 7.9 | 7.75854983759833 | 0.141450162401668 |
| 19 | 8.6 | 8.51645357314959 | 0.083546426850409 |
| 20 | 8.7 | 8.61121291202774 | 0.0887870879722631 |
| 21 | 8.7 | 8.47750170537396 | 0.222498294626038 |
| 22 | 8.5 | 8.21313820100257 | 0.286861798997428 |
| 23 | 8.4 | 7.99322368873952 | 0.406776311260475 |
| 24 | 8.5 | 8.11854983759833 | 0.381450162401667 |
| 25 | 8.7 | 8.28209626444874 | 0.417903735551263 |
| 26 | 8.7 | 8.24524066112185 | 0.454759338878145 |
| 27 | 8.6 | 8.06402155342358 | 0.535978446576422 |
| 28 | 8.5 | 7.74620330560927 | 0.753796694390728 |
| 29 | 8.3 | 7.50410704116053 | 0.79589295883947 |
| 30 | 8 | 7.43668462785298 | 0.563315372147018 |
| 31 | 8.2 | 8.20506968564795 | -0.00506968564794955 |
| 32 | 8.1 | 8.29458836340424 | -0.19458836340424 |
| 33 | 8.1 | 8.15039583450676 | -0.0503958345067563 |
| 34 | 8 | 7.84934770228238 | 0.150652297717615 |
| 35 | 7.9 | 7.6451551733849 | 0.254844826615099 |
| 36 | 7.9 | 7.78620330560927 | 0.113796694390728 |
| 37 | 8 | 7.92878708797226 | 0.0712129120277414 |
| 38 | 8 | 7.88669082352352 | 0.113309176476478 |
| 39 | 7.9 | 7.67926841021597 | 0.220731589784027 |
| 40 | 8 | 7.38241280688909 | 0.617587193110915 |
| 41 | 7.7 | 7.18224183141518 | 0.517758168584821 |
| 42 | 7.2 | 7.10433809586392 | 0.0956619041360786 |
| 43 | 7.5 | 7.86224183141518 | -0.362241831415179 |
| 44 | 7.3 | 7.96748249253703 | -0.667482492537034 |
| 45 | 7 | 7.82328996363955 | -0.82328996363955 |
| 46 | 7 | 7.50127918692776 | -0.501279186927762 |
| 47 | 7 | 7.27612401354286 | -0.27612401354286 |
| 48 | 7.2 | 7.39620950127981 | -0.196209501279814 |
| 49 | 7.3 | 7.53355262252095 | -0.233552622520945 |
| 50 | 7.1 | 7.4809750358285 | -0.380975035828500 |
| 51 | 6.8 | 7.2211460113024 | -0.421146011302406 |
| 52 | 6.4 | 6.93477173021923 | -0.534771730219227 |
| 53 | 6.1 | 6.6559908379175 | -0.555990837917504 |
| 54 | 6.5 | 6.55188379675697 | -0.0518837967569736 |
| 55 | 7.7 | 7.30978753230823 | 0.390212467691769 |
| 56 | 7.9 | 7.42026885455194 | 0.47973114544806 |
| 57 | 7.5 | 7.2708356645326 | 0.229164335467398 |
| 58 | 6.9 | 6.99075017679565 | -0.090750176795649 |
| 59 | 6.6 | 6.83372359799486 | -0.233723597994856 |
| 60 | 6.9 | 6.99573437470665 | -0.0957343747066452 |
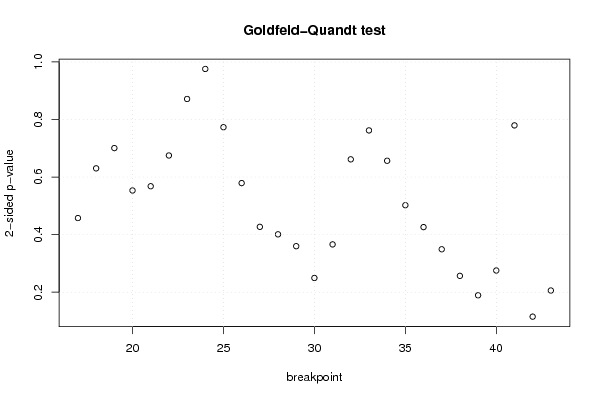
| Goldfeld-Quandt test for Heteroskedasticity | |||
| p-values | Alternative Hypothesis | ||
| breakpoint index | greater | 2-sided | less |
| 17 | 0.771144280862221 | 0.457711438275558 | 0.228855719137779 |
| 18 | 0.684789250698459 | 0.630421498603083 | 0.315210749301542 |
| 19 | 0.649629037303912 | 0.700741925392176 | 0.350370962696088 |
| 20 | 0.723209873561065 | 0.55358025287787 | 0.276790126438935 |
| 21 | 0.715879526342434 | 0.568240947315133 | 0.284120473657566 |
| 22 | 0.66245216316661 | 0.675095673666781 | 0.337547836833391 |
| 23 | 0.564295793956954 | 0.871408412086091 | 0.435704206043046 |
| 24 | 0.487861620645541 | 0.975723241291082 | 0.512138379354459 |
| 25 | 0.386637327694515 | 0.773274655389031 | 0.613362672305485 |
| 26 | 0.289582427128512 | 0.579164854257024 | 0.710417572871488 |
| 27 | 0.213617611588218 | 0.427235223176437 | 0.786382388411782 |
| 28 | 0.200607469153051 | 0.401214938306103 | 0.799392530846949 |
| 29 | 0.179976039237837 | 0.359952078475675 | 0.820023960762163 |
| 30 | 0.124775150489583 | 0.249550300979167 | 0.875224849510417 |
| 31 | 0.183115132750648 | 0.366230265501295 | 0.816884867249352 |
| 32 | 0.330865211728397 | 0.661730423456793 | 0.669134788271603 |
| 33 | 0.381089774614411 | 0.762179549228821 | 0.618910225385589 |
| 34 | 0.328371359003443 | 0.656742718006886 | 0.671628640996557 |
| 35 | 0.251176998172528 | 0.502353996345056 | 0.748823001827472 |
| 36 | 0.21311778265466 | 0.42623556530932 | 0.78688221734534 |
| 37 | 0.174627491908716 | 0.349254983817432 | 0.825372508091284 |
| 38 | 0.128434997371355 | 0.256869994742709 | 0.871565002628645 |
| 39 | 0.0946913942640307 | 0.189382788528061 | 0.90530860573597 |
| 40 | 0.137727214795305 | 0.275454429590609 | 0.862272785204695 |
| 41 | 0.610146301790981 | 0.779707396418038 | 0.389853698209019 |
| 42 | 0.94241754383455 | 0.115164912330899 | 0.0575824561654493 |
| 43 | 0.896992087438221 | 0.206015825123557 | 0.103007912561779 |
| Meta Analysis of Goldfeld-Quandt test for Heteroskedasticity | |||
| Description | # significant tests | % significant tests | OK/NOK |
| 1% type I error level | 0 | 0 | OK |
| 5% type I error level | 0 | 0 | OK |
| 10% type I error level | 0 | 0 | OK |