| Multiple Linear Regression - Estimated Regression Equation |
| BESTC[t] = -6.92605201264424 + 0.259801879535493INDUSTR[t] + 0.155336451654076Y1[t] + 0.0649152601439141Y2[t] + 0.580833848588579Y3[t] + 0.0285751652133791Y4[t] -2.62125269928172M1[t] + 0.187869465600903M2[t] -2.89674579770143M3[t] -6.45300354254062M4[t] -2.02482601983913M5[t] -2.17130347109709M6[t] + 3.40503068660951M7[t] -0.58488239993721M8[t] + 0.271970079284188M9[t] + 0.552450778154068M10[t] -1.88858950952297M11[t] + 0.00827710547737372t + e[t] |
| Multiple Linear Regression - Ordinary Least Squares | |||||
| Variable | Parameter | S.D. | T-STAT H0: parameter = 0 | 2-tail p-value | 1-tail p-value |
| (Intercept) | -6.92605201264424 | 12.419377 | -0.5577 | 0.580333 | 0.290166 |
| INDUSTR | 0.259801879535493 | 0.050456 | 5.149 | 8e-06 | 4e-06 |
| Y1 | 0.155336451654076 | 0.127793 | 1.2155 | 0.23166 | 0.11583 |
| Y2 | 0.0649152601439141 | 0.134293 | 0.4834 | 0.631596 | 0.315798 |
| Y3 | 0.580833848588579 | 0.121949 | 4.7629 | 2.8e-05 | 1.4e-05 |
| Y4 | 0.0285751652133791 | 0.157421 | 0.1815 | 0.856924 | 0.428462 |
| M1 | -2.62125269928172 | 0.959351 | -2.7323 | 0.00949 | 0.004745 |
| M2 | 0.187869465600903 | 1.028426 | 0.1827 | 0.856023 | 0.428011 |
| M3 | -2.89674579770143 | 1.065543 | -2.7186 | 0.009825 | 0.004913 |
| M4 | -6.45300354254062 | 1.00255 | -6.4366 | 0 | 0 |
| M5 | -2.02482601983913 | 1.086113 | -1.8643 | 0.07002 | 0.03501 |
| M6 | -2.17130347109709 | 0.954236 | -2.2754 | 0.028605 | 0.014303 |
| M7 | 3.40503068660951 | 1.356839 | 2.5095 | 0.01647 | 0.008235 |
| M8 | -0.58488239993721 | 1.429526 | -0.4091 | 0.684731 | 0.342365 |
| M9 | 0.271970079284188 | 1.273798 | 0.2135 | 0.83207 | 0.416035 |
| M10 | 0.552450778154068 | 1.55929 | 0.3543 | 0.725075 | 0.362538 |
| M11 | -1.88858950952297 | 0.950698 | -1.9865 | 0.054221 | 0.02711 |
| t | 0.00827710547737372 | 0.04689 | 0.1765 | 0.86082 | 0.43041 |
| Multiple Linear Regression - Regression Statistics | |
| Multiple R | 0.985914410283178 |
| R-squared | 0.972027224404027 |
| Adjusted R-squared | 0.959513087953198 |
| F-TEST (value) | 77.6743347991521 |
| F-TEST (DF numerator) | 17 |
| F-TEST (DF denominator) | 38 |
| p-value | 0 |
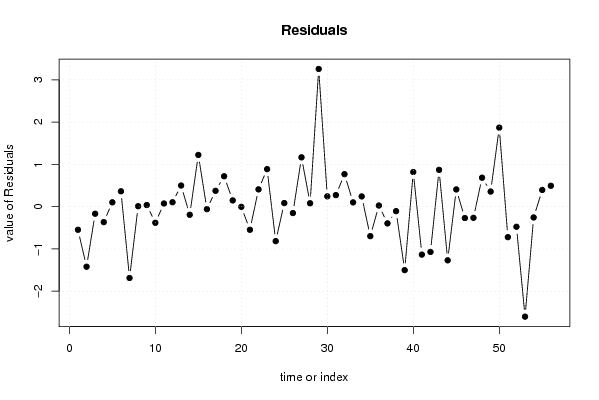
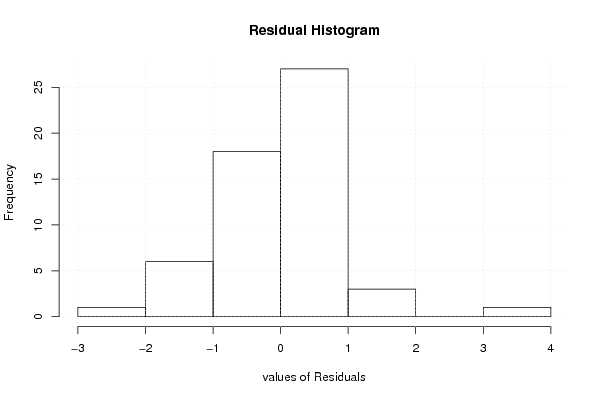
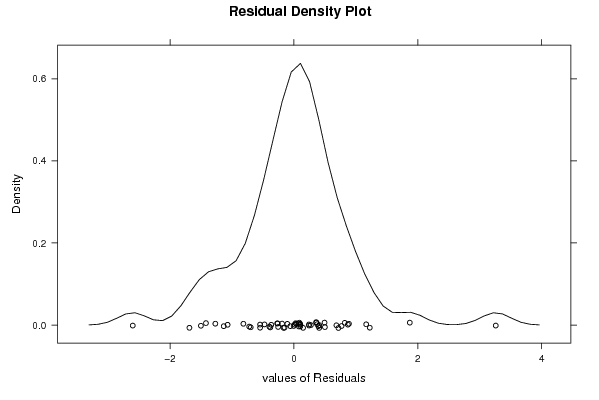
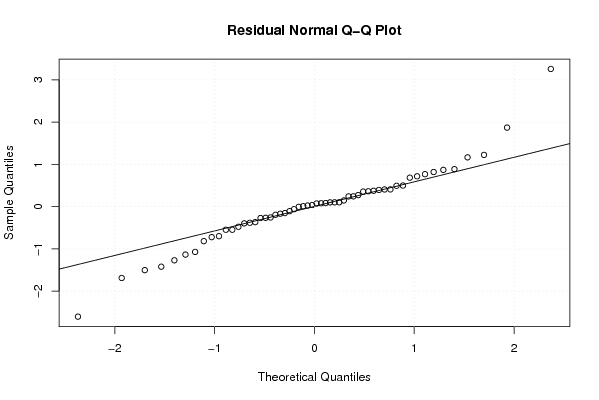
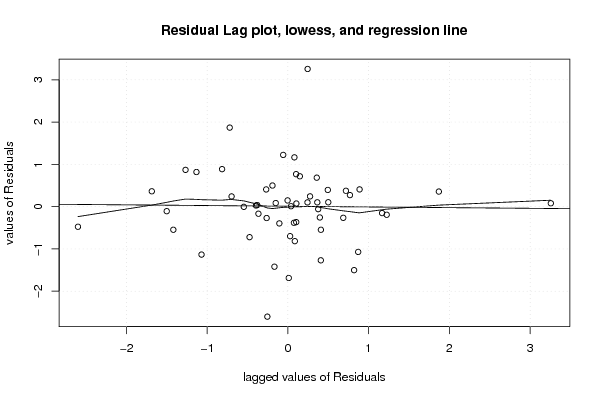
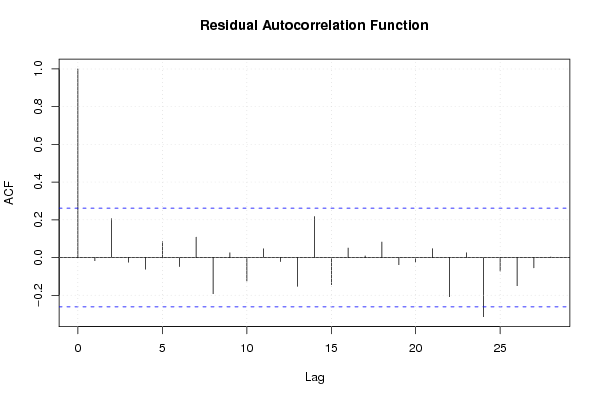
| Multiple Linear Regression - Residual Statistics | |
| Residual Standard Deviation | 1.07109106142283 |
| Sum Squared Residuals | 43.5949703506755 |
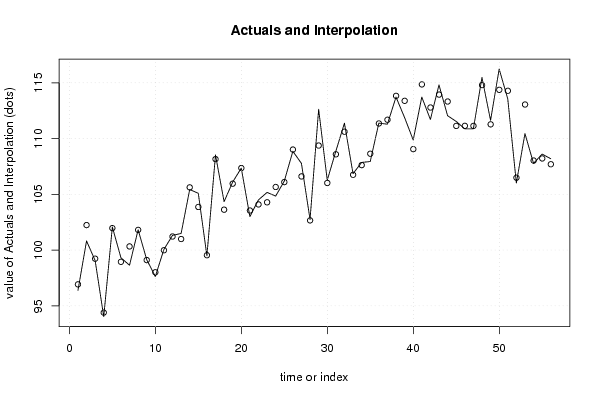
| Multiple Linear Regression - Actuals, Interpolation, and Residuals | |||
| Time or Index | Actuals | Interpolation Forecast | Residuals Prediction Error |
| 1 | 96.38 | 96.926373980974 | -0.546373980973961 |
| 2 | 100.82 | 102.240407944953 | -1.42040794495348 |
| 3 | 99.06 | 99.2271092997082 | -0.167109299708232 |
| 4 | 94.03 | 94.3955388344205 | -0.365538834420504 |
| 5 | 102.07 | 101.967289124756 | 0.102710875244458 |
| 6 | 99.31 | 98.9462952009838 | 0.363704799016176 |
| 7 | 98.64 | 100.327220414353 | -1.68722041435251 |
| 8 | 101.82 | 101.809582788123 | 0.0104172118765759 |
| 9 | 99.14 | 99.1018527997348 | 0.0381472002652051 |
| 10 | 97.63 | 98.0112482316177 | -0.381248231617671 |
| 11 | 100.06 | 99.9855820027115 | 0.0744179972884663 |
| 12 | 101.32 | 101.215732222646 | 0.104267777353873 |
| 13 | 101.49 | 100.990305700593 | 0.49969429940682 |
| 14 | 105.43 | 105.621925591510 | -0.191925591509872 |
| 15 | 105.09 | 103.866016196302 | 1.22398380369764 |
| 16 | 99.48 | 99.5385856687715 | -0.0585856687714791 |
| 17 | 108.53 | 108.154754867277 | 0.375245132722899 |
| 18 | 104.34 | 103.621358723548 | 0.718641276452006 |
| 19 | 106.1 | 105.95234047571 | 0.147659524290009 |
| 20 | 107.35 | 107.354123429917 | -0.00412342991744168 |
| 21 | 103 | 103.546725557649 | -0.546725557648704 |
| 22 | 104.5 | 104.091491127845 | 0.40850887215464 |
| 23 | 105.17 | 104.282239563621 | 0.887760436378853 |
| 24 | 104.84 | 105.656298987443 | -0.816298987443351 |
| 25 | 106.18 | 106.094741120960 | 0.0852588790398619 |
| 26 | 108.86 | 109.011286867993 | -0.151286867992541 |
| 27 | 107.77 | 106.603449483248 | 1.16655051675178 |
| 28 | 102.74 | 102.659904103448 | 0.0800958965522788 |
| 29 | 112.63 | 109.372015271112 | 3.25798472888756 |
| 30 | 106.26 | 106.015993216398 | 0.244006783601768 |
| 31 | 108.86 | 108.586164084375 | 0.273835915625037 |
| 32 | 111.38 | 110.611289359264 | 0.768710640735976 |
| 33 | 106.85 | 106.748769714301 | 0.101230285699228 |
| 34 | 107.86 | 107.617742548510 | 0.242257451489595 |
| 35 | 107.94 | 108.638234630358 | -0.698234630357818 |
| 36 | 111.38 | 111.353408526568 | 0.0265914734319444 |
| 37 | 111.29 | 111.685694332439 | -0.395694332439290 |
| 38 | 113.72 | 113.826482487517 | -0.106482487516764 |
| 39 | 111.88 | 113.381925865696 | -1.50192586569553 |
| 40 | 109.87 | 109.050428684655 | 0.819571315344856 |
| 41 | 113.72 | 114.853770272849 | -1.13377027284880 |
| 42 | 111.71 | 112.780908813621 | -1.07090881362101 |
| 43 | 114.81 | 113.939560478499 | 0.870439521500768 |
| 44 | 112.05 | 113.319128074169 | -1.26912807416897 |
| 45 | 111.54 | 111.132651928316 | 0.40734807168427 |
| 46 | 110.87 | 111.139518092027 | -0.269518092026565 |
| 47 | 110.87 | 111.133943803310 | -0.263943803309501 |
| 48 | 115.48 | 114.794560263342 | 0.685439736657536 |
| 49 | 111.63 | 111.272884865033 | 0.357115134966568 |
| 50 | 116.24 | 114.369897108027 | 1.87010289197265 |
| 51 | 113.56 | 114.281499155046 | -0.72149915504565 |
| 52 | 106.01 | 106.485542708705 | -0.475542708705153 |
| 53 | 110.45 | 113.052170464006 | -2.60217046400612 |
| 54 | 107.77 | 108.025444045449 | -0.255444045448937 |
| 55 | 108.61 | 108.214714547063 | 0.395285452936694 |
| 56 | 108.19 | 107.695876348526 | 0.494123651473859 |
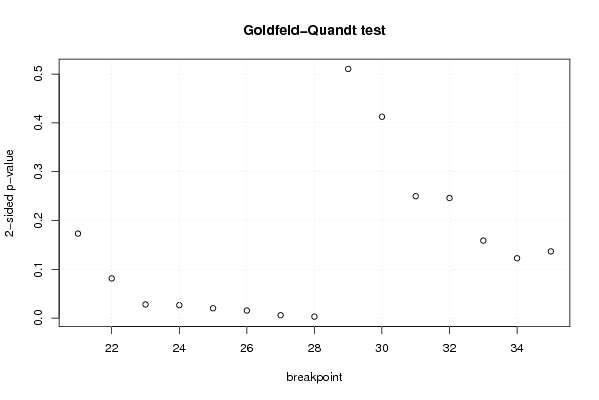
| Goldfeld-Quandt test for Heteroskedasticity | |||
| p-values | Alternative Hypothesis | ||
| breakpoint index | greater | 2-sided | less |
| 21 | 0.0865657664786096 | 0.173131532957219 | 0.91343423352139 |
| 22 | 0.0406185467378701 | 0.0812370934757403 | 0.95938145326213 |
| 23 | 0.0139493626966791 | 0.0278987253933581 | 0.98605063730332 |
| 24 | 0.0131920669820690 | 0.0263841339641381 | 0.98680793301793 |
| 25 | 0.0100237951212482 | 0.0200475902424963 | 0.989976204878752 |
| 26 | 0.00772342306559093 | 0.0154468461311819 | 0.99227657693441 |
| 27 | 0.00289829978092058 | 0.00579659956184117 | 0.99710170021908 |
| 28 | 0.00143168315009831 | 0.00286336630019662 | 0.998568316849902 |
| 29 | 0.255251754931251 | 0.510503509862502 | 0.744748245068749 |
| 30 | 0.206268414445646 | 0.412536828891293 | 0.793731585554354 |
| 31 | 0.124843804312208 | 0.249687608624416 | 0.875156195687792 |
| 32 | 0.122995822652591 | 0.245991645305182 | 0.87700417734741 |
| 33 | 0.0793964580214579 | 0.158792916042916 | 0.920603541978542 |
| 34 | 0.0612678977076657 | 0.122535795415331 | 0.938732102292334 |
| 35 | 0.0682948747788699 | 0.136589749557740 | 0.93170512522113 |
| Meta Analysis of Goldfeld-Quandt test for Heteroskedasticity | |||
| Description | # significant tests | % significant tests | OK/NOK |
| 1% type I error level | 2 | 0.133333333333333 | NOK |
| 5% type I error level | 6 | 0.4 | NOK |
| 10% type I error level | 7 | 0.466666666666667 | NOK |