| Multiple Linear Regression - Estimated Regression Equation |
| Y[t] = -0.0956913721724628 + 1.00521297181906X[t] -0.468065856891305M1[t] -0.233556766831644M2[t] + 0.152610048266569M3[t] + 0.341963639761006M4[t] + 0.535786398719157M5[t] + 0.476941897284473M6[t] + 0.644149525567973M7[t] + 0.7582120812298M8[t] + 0.972107821793418M9[t] + 0.54222072599492M10[t] + 0.242594278787373M11[t] + e[t] |
| Multiple Linear Regression - Ordinary Least Squares | |||||
| Variable | Parameter | S.D. | T-STAT H0: parameter = 0 | 2-tail p-value | 1-tail p-value |
| (Intercept) | -0.0956913721724628 | 2.760814 | -0.0347 | 0.972497 | 0.486249 |
| X | 1.00521297181906 | 0.024293 | 41.3781 | 0 | 0 |
| M1 | -0.468065856891305 | 0.376634 | -1.2428 | 0.220121 | 0.11006 |
| M2 | -0.233556766831644 | 0.376015 | -0.6211 | 0.537511 | 0.268756 |
| M3 | 0.152610048266569 | 0.376078 | 0.4058 | 0.686736 | 0.343368 |
| M4 | 0.341963639761006 | 0.375844 | 0.9099 | 0.367541 | 0.18377 |
| M5 | 0.535786398719157 | 0.375783 | 1.4258 | 0.160539 | 0.080269 |
| M6 | 0.476941897284473 | 0.375522 | 1.2701 | 0.210309 | 0.105154 |
| M7 | 0.644149525567973 | 0.375313 | 1.7163 | 0.092693 | 0.046346 |
| M8 | 0.7582120812298 | 0.375328 | 2.0201 | 0.04909 | 0.024545 |
| M9 | 0.972107821793418 | 0.375303 | 2.5902 | 0.012733 | 0.006367 |
| M10 | 0.54222072599492 | 0.374957 | 1.4461 | 0.154789 | 0.077395 |
| M11 | 0.242594278787373 | 0.374825 | 0.6472 | 0.520638 | 0.260319 |
| Multiple Linear Regression - Regression Statistics | |
| Multiple R | 0.987125789053487 |
| R-squared | 0.974417323414469 |
| Adjusted R-squared | 0.967885576201141 |
| F-TEST (value) | 149.181726051232 |
| F-TEST (DF numerator) | 12 |
| F-TEST (DF denominator) | 47 |
| p-value | 0 |
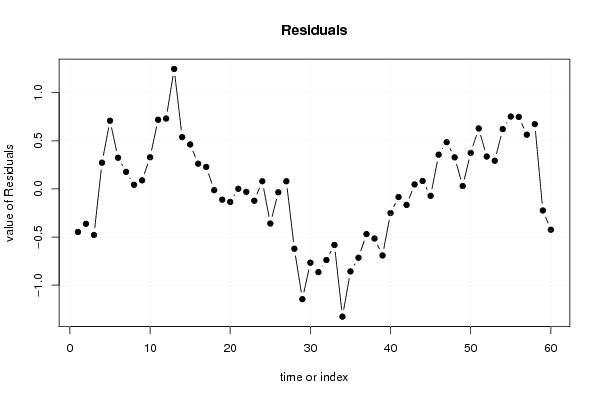
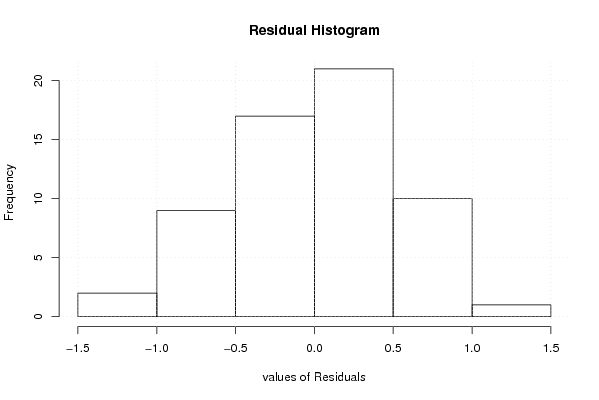
| Multiple Linear Regression - Residual Statistics | |
| Residual Standard Deviation | 0.592634001321065 |
| Sum Squared Residuals | 16.5071077975254 |
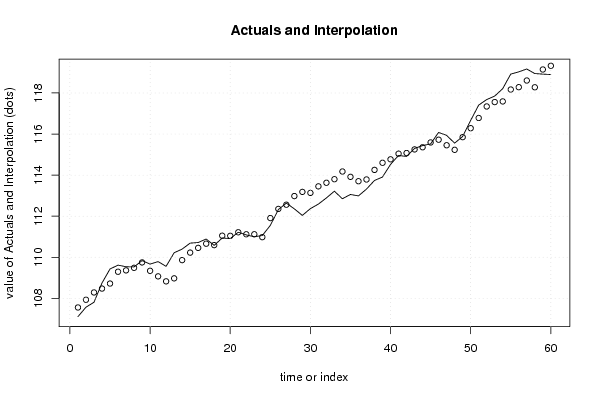
| Multiple Linear Regression - Actuals, Interpolation, and Residuals | |||
| Time or Index | Actuals | Interpolation Forecast | Residuals Prediction Error |
| 1 | 107.11 | 107.556950019794 | -0.446950019794272 |
| 2 | 107.57 | 107.932188925909 | -0.362188925909045 |
| 3 | 107.81 | 108.288199351853 | -0.47819935185267 |
| 4 | 108.75 | 108.477552943347 | 0.272447056652891 |
| 5 | 109.43 | 108.721636350896 | 0.708363649103795 |
| 6 | 109.62 | 109.296076021708 | 0.323923978292471 |
| 7 | 109.54 | 109.362762352809 | 0.177237647190873 |
| 8 | 109.53 | 109.486877038189 | 0.0431229618108451 |
| 9 | 109.84 | 109.751033427344 | 0.08896657265628 |
| 10 | 109.67 | 109.341250590982 | 0.328749409018399 |
| 11 | 109.79 | 109.071780532929 | 0.718219467071378 |
| 12 | 109.56 | 108.829186254141 | 0.730813745858746 |
| 13 | 110.22 | 108.974300310060 | 1.24569968994042 |
| 14 | 110.4 | 109.862197831802 | 0.537802168198367 |
| 15 | 110.69 | 110.228260387463 | 0.461739612536538 |
| 16 | 110.72 | 110.457822497831 | 0.262177502169334 |
| 17 | 110.89 | 110.661697386507 | 0.228302613492988 |
| 18 | 110.58 | 110.592800755354 | -0.0128007553541341 |
| 19 | 110.94 | 111.051520145465 | -0.111520145465170 |
| 20 | 110.91 | 111.044957144509 | -0.134957144508706 |
| 21 | 111.22 | 111.218644366200 | 0.00135563380044771 |
| 22 | 111.09 | 111.120477551101 | -0.0304775511013389 |
| 23 | 111 | 111.122414995440 | -0.122414995439526 |
| 24 | 111.06 | 110.980342013834 | 0.0796579861659482 |
| 25 | 111.55 | 111.909522187771 | -0.359522187771252 |
| 26 | 112.32 | 112.355126001913 | -0.0351260019129142 |
| 27 | 112.64 | 112.560354482084 | 0.0796455179163046 |
| 28 | 112.36 | 112.980907057097 | -0.620907057096522 |
| 29 | 112.04 | 113.184781945773 | -1.14478194577285 |
| 30 | 112.37 | 113.135989574056 | -0.765989574056362 |
| 31 | 112.59 | 113.453979148113 | -0.863979148112714 |
| 32 | 112.89 | 113.628354482084 | -0.73835448208369 |
| 33 | 113.22 | 113.802041703775 | -0.582041703774555 |
| 34 | 112.85 | 114.176324985431 | -1.32632498543131 |
| 35 | 113.06 | 113.916907057097 | -0.856907057096523 |
| 36 | 112.99 | 113.704469167464 | -0.714469167463717 |
| 37 | 113.32 | 113.789270445073 | -0.46927044507291 |
| 38 | 113.74 | 114.254978518651 | -0.514978518650945 |
| 39 | 113.91 | 114.600936814876 | -0.690936814876401 |
| 40 | 114.52 | 114.770186146934 | -0.250186146934460 |
| 41 | 114.96 | 115.044425943638 | -0.0844259436381378 |
| 42 | 114.91 | 115.076050609667 | -0.166050609667156 |
| 43 | 115.3 | 115.253310367669 | 0.0466896323311486 |
| 44 | 115.44 | 115.357320793612 | 0.0826792063875177 |
| 45 | 115.52 | 115.591320793612 | -0.0713207936124928 |
| 46 | 116.08 | 115.724352962033 | 0.355647037967329 |
| 47 | 115.94 | 115.454882903980 | 0.485117096020317 |
| 48 | 115.56 | 115.232392884629 | 0.327607115371302 |
| 49 | 115.88 | 115.849957037302 | 0.0300429626980139 |
| 50 | 116.66 | 116.285508721725 | 0.374491278274537 |
| 51 | 117.41 | 116.782248963724 | 0.627751036276228 |
| 52 | 117.68 | 117.343531354791 | 0.336468645208758 |
| 53 | 117.85 | 117.557458373186 | 0.292541626814202 |
| 54 | 118.21 | 117.589083039215 | 0.620916960785181 |
| 55 | 118.92 | 118.168427985944 | 0.751572014055861 |
| 56 | 119.03 | 118.282490541606 | 0.747509458394033 |
| 57 | 119.17 | 118.606959709070 | 0.56304029093032 |
| 58 | 118.95 | 118.277593910453 | 0.672406089546919 |
| 59 | 118.92 | 119.144014510556 | -0.224014510555646 |
| 60 | 118.9 | 119.323609679932 | -0.423609679932279 |
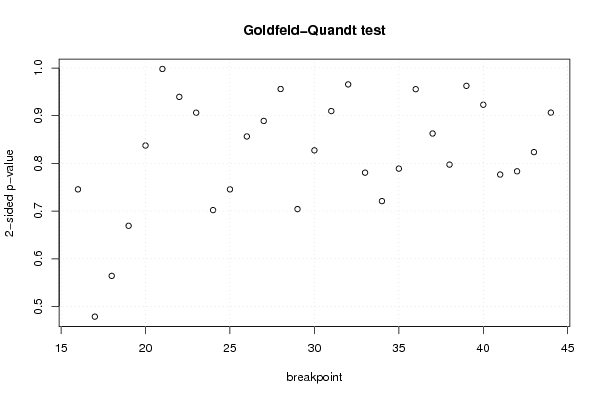
| Goldfeld-Quandt test for Heteroskedasticity | |||
| p-values | Alternative Hypothesis | ||
| breakpoint index | greater | 2-sided | less |
| 16 | 0.627181854495576 | 0.745636291008848 | 0.372818145504424 |
| 17 | 0.760669476644624 | 0.478661046710752 | 0.239330523355376 |
| 18 | 0.71791528702387 | 0.564169425952261 | 0.282084712976130 |
| 19 | 0.66540748956459 | 0.669185020870821 | 0.334592510435410 |
| 20 | 0.581231197837836 | 0.837537604324327 | 0.418768802162164 |
| 21 | 0.499049840808313 | 0.998099681616626 | 0.500950159191687 |
| 22 | 0.469776676239497 | 0.939553352478994 | 0.530223323760503 |
| 23 | 0.546828687028798 | 0.906342625942405 | 0.453171312971202 |
| 24 | 0.648934016060533 | 0.702131967878934 | 0.351065983939467 |
| 25 | 0.627183784366929 | 0.745632431266143 | 0.372816215633071 |
| 26 | 0.571726990828027 | 0.856546018343946 | 0.428273009171973 |
| 27 | 0.555437785379433 | 0.889124429241134 | 0.444562214620567 |
| 28 | 0.521995796868149 | 0.956008406263702 | 0.478004203131851 |
| 29 | 0.647899456759136 | 0.704201086481727 | 0.352100543240864 |
| 30 | 0.586302977627375 | 0.82739404474525 | 0.413697022372625 |
| 31 | 0.545114456145094 | 0.909771087709813 | 0.454885543854906 |
| 32 | 0.482847211769255 | 0.96569442353851 | 0.517152788230745 |
| 33 | 0.390302123570833 | 0.780604247141665 | 0.609697876429167 |
| 34 | 0.63950039606008 | 0.720999207879839 | 0.360499603939919 |
| 35 | 0.605465385548611 | 0.789069228902778 | 0.394534614451389 |
| 36 | 0.522174460573231 | 0.955651078853537 | 0.477825539426769 |
| 37 | 0.431371134878631 | 0.862742269757262 | 0.568628865121369 |
| 38 | 0.398719991226755 | 0.79743998245351 | 0.601280008773245 |
| 39 | 0.518670973467479 | 0.962658053065041 | 0.481329026532521 |
| 40 | 0.461514795466123 | 0.923029590932246 | 0.538485204533877 |
| 41 | 0.388334213298095 | 0.77666842659619 | 0.611665786701905 |
| 42 | 0.391739810707263 | 0.783479621414527 | 0.608260189292737 |
| 43 | 0.411863178150485 | 0.82372635630097 | 0.588136821849515 |
| 44 | 0.453254633154413 | 0.906509266308827 | 0.546745366845587 |
| Meta Analysis of Goldfeld-Quandt test for Heteroskedasticity | |||
| Description | # significant tests | % significant tests | OK/NOK |
| 1% type I error level | 0 | 0 | OK |
| 5% type I error level | 0 | 0 | OK |
| 10% type I error level | 0 | 0 | OK |