| Multiple Linear Regression - Estimated Regression Equation |
| Y[t] = + 12.1462142797098 -0.0462787604274321X[t] + 0.742587338241901M1[t] + 1.25511786026870M2[t] + 0.990289718193554M3[t] + 0.520021757297351M4[t] + 0.299973001171929M5[t] + 0.564238222626601M6[t] + 0.63293105409161M7[t] + 0.943323526066729M8[t] + 0.511004148721019M9[t] + 0.356519722495564M10[t] + 0.488839099841274M11[t] + e[t] |
| Multiple Linear Regression - Ordinary Least Squares | |||||
| Variable | Parameter | S.D. | T-STAT H0: parameter = 0 | 2-tail p-value | 1-tail p-value |
| (Intercept) | 12.1462142797098 | 1.55747 | 7.7987 | 0 | 0 |
| X | -0.0462787604274321 | 0.017123 | -2.7027 | 0.009541 | 0.004771 |
| M1 | 0.742587338241901 | 0.47363 | 1.5679 | 0.123622 | 0.061811 |
| M2 | 1.25511786026870 | 0.610256 | 2.0567 | 0.045289 | 0.022645 |
| M3 | 0.990289718193554 | 0.61944 | 1.5987 | 0.116592 | 0.058296 |
| M4 | 0.520021757297351 | 0.552833 | 0.9406 | 0.351694 | 0.175847 |
| M5 | 0.299973001171929 | 0.482362 | 0.6219 | 0.537024 | 0.268512 |
| M6 | 0.564238222626601 | 0.47989 | 1.1758 | 0.24561 | 0.122805 |
| M7 | 0.63293105409161 | 0.484441 | 1.3065 | 0.197734 | 0.098867 |
| M8 | 0.943323526066729 | 0.572327 | 1.6482 | 0.105976 | 0.052988 |
| M9 | 0.511004148721019 | 0.520697 | 0.9814 | 0.331428 | 0.165714 |
| M10 | 0.356519722495564 | 0.54307 | 0.6565 | 0.514711 | 0.257355 |
| M11 | 0.488839099841274 | 0.598388 | 0.8169 | 0.418092 | 0.209046 |
| Multiple Linear Regression - Regression Statistics | |
| Multiple R | 0.496313832173041 |
| R-squared | 0.24632742000629 |
| Adjusted R-squared | 0.0539003783057682 |
| F-TEST (value) | 1.28010812736837 |
| F-TEST (DF numerator) | 12 |
| F-TEST (DF denominator) | 47 |
| p-value | 0.261695716134239 |
| Multiple Linear Regression - Residual Statistics | |
| Residual Standard Deviation | 0.68873946915187 |
| Sum Squared Residuals | 22.2950166492772 |
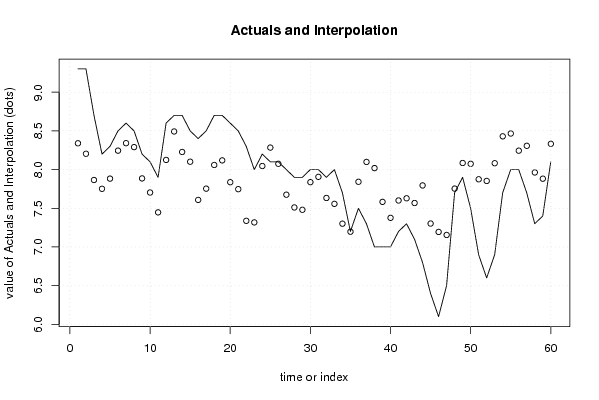
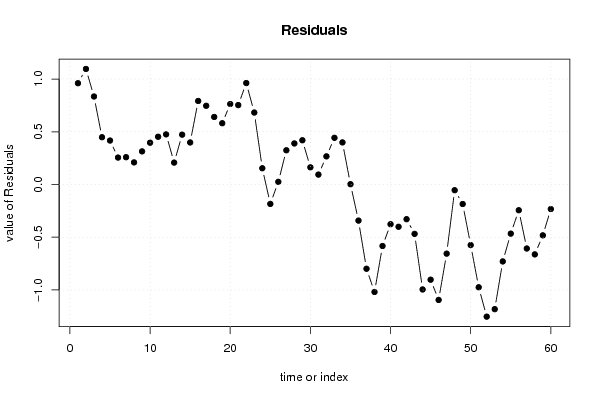
| Multiple Linear Regression - Actuals, Interpolation, and Residuals | |||
| Time or Index | Actuals | Interpolation Forecast | Residuals Prediction Error |
| 1 | 9.3 | 8.33959946793523 | 0.960400532064768 |
| 2 | 9.3 | 8.20422734397793 | 1.09577265602207 |
| 3 | 8.7 | 7.86535318521888 | 0.834646814781115 |
| 4 | 8.2 | 7.7514316796139 | 0.448568320386093 |
| 5 | 8.3 | 7.88310150273697 | 0.416898497263031 |
| 6 | 8.5 | 8.24455212108925 | 0.25544787891075 |
| 7 | 8.6 | 8.34101220881072 | 0.258987791189283 |
| 8 | 8.5 | 8.29043034945187 | 0.209569650548135 |
| 9 | 8.2 | 7.88587822836262 | 0.314121771637384 |
| 10 | 8.1 | 7.7036265458807 | 0.396373454119299 |
| 11 | 7.9 | 7.44720433563598 | 0.452795664364019 |
| 12 | 8.6 | 8.124589998566 | 0.475410001434004 |
| 13 | 8.7 | 8.4923193773457 | 0.207680622654303 |
| 14 | 8.7 | 8.22736672419164 | 0.472633275808357 |
| 15 | 8.5 | 8.10137486339879 | 0.398625136601213 |
| 16 | 8.4 | 7.60796752228887 | 0.792032477711132 |
| 17 | 8.5 | 7.75352097354016 | 0.74647902645984 |
| 18 | 8.7 | 8.05943707937952 | 0.640562920620478 |
| 19 | 8.7 | 8.11887415875904 | 0.581125841240957 |
| 20 | 8.6 | 7.83689849726303 | 0.763101502736969 |
| 21 | 8.5 | 7.74704194708032 | 0.752958052919681 |
| 22 | 8.3 | 7.33802433850399 | 0.961975661496013 |
| 23 | 8 | 7.31762380643917 | 0.682376193560829 |
| 24 | 8.2 | 8.04591610583936 | 0.154083894160637 |
| 25 | 8.1 | 8.28406495542225 | -0.184064955422253 |
| 26 | 8.1 | 8.07464681478112 | 0.0253531852188832 |
| 27 | 8 | 7.67561026746641 | 0.324389732533588 |
| 28 | 7.9 | 7.51078212539126 | 0.38921787460874 |
| 29 | 7.9 | 7.48047628701831 | 0.419523712981690 |
| 30 | 8 | 7.83729902932785 | 0.162700970672153 |
| 31 | 8 | 7.90599186079285 | 0.0940081392071448 |
| 32 | 7.9 | 7.63327195138233 | 0.266728048617671 |
| 33 | 8 | 7.55729902932785 | 0.442700970672153 |
| 34 | 7.7 | 7.30100133016204 | 0.398998669837959 |
| 35 | 7.2 | 7.19729902932785 | 0.00270097067215272 |
| 36 | 7.5 | 7.84228955995866 | -0.342289559958661 |
| 37 | 7.3 | 8.09894991371252 | -0.798949913712524 |
| 38 | 7 | 8.0191123022682 | -1.01911230226820 |
| 39 | 7 | 7.58305274661155 | -0.583052746611547 |
| 40 | 7 | 7.37657372015171 | -0.376573720151707 |
| 41 | 7.2 | 7.60080106412963 | -0.400801064129633 |
| 42 | 7.3 | 7.6290446074044 | -0.329044607404403 |
| 43 | 7.1 | 7.5681569096726 | -0.468156909672601 |
| 44 | 6.8 | 7.79524761287834 | -0.995247612878342 |
| 45 | 6.4 | 7.30276584697697 | -0.90276584697697 |
| 46 | 6.1 | 7.19456018117895 | -1.09456018117895 |
| 47 | 6.5 | 7.15564814494316 | -0.655648144943159 |
| 48 | 7.7 | 7.75435991514654 | -0.054359915146539 |
| 49 | 7.9 | 8.0850662855843 | -0.185066285584294 |
| 50 | 7.5 | 8.07464681478112 | -0.574646814781117 |
| 51 | 6.9 | 7.87460893730437 | -0.97460893730437 |
| 52 | 6.6 | 7.85324495255426 | -1.25324495255426 |
| 53 | 6.9 | 8.08210017257493 | -1.18210017257493 |
| 54 | 7.7 | 8.42966716279898 | -0.729667162798978 |
| 55 | 8 | 8.46596486196478 | -0.465964861964783 |
| 56 | 8 | 8.24415158902443 | -0.244151589024433 |
| 57 | 7.7 | 8.30701494825225 | -0.607014948252247 |
| 58 | 7.3 | 7.96278760427432 | -0.662787604274321 |
| 59 | 7.4 | 7.88222468365384 | -0.482224683653842 |
| 60 | 8.1 | 8.33284442048944 | -0.232844420489441 |
| Goldfeld-Quandt test for Heteroskedasticity | |||
| p-values | Alternative Hypothesis | ||
| breakpoint index | greater | 2-sided | less |
| 16 | 0.0874404191120598 | 0.174880838224120 | 0.91255958088794 |
| 17 | 0.0326868477491820 | 0.0653736954983639 | 0.967313152250818 |
| 18 | 0.0119940871120098 | 0.0239881742240196 | 0.98800591288799 |
| 19 | 0.00523987759258985 | 0.0104797551851797 | 0.99476012240741 |
| 20 | 0.00364534707904228 | 0.00729069415808455 | 0.996354652920958 |
| 21 | 0.00183800137968609 | 0.00367600275937218 | 0.998161998620314 |
| 22 | 0.00103944891931884 | 0.00207889783863769 | 0.998960551080681 |
| 23 | 0.000480360990344215 | 0.00096072198068843 | 0.999519639009656 |
| 24 | 0.000533989305006299 | 0.00106797861001260 | 0.999466010694994 |
| 25 | 0.0111578030685698 | 0.0223156061371395 | 0.98884219693143 |
| 26 | 0.0417669272958461 | 0.0835338545916923 | 0.958233072704154 |
| 27 | 0.0598655982300874 | 0.119731196460175 | 0.940134401769913 |
| 28 | 0.0742342116063968 | 0.148468423212794 | 0.925765788393603 |
| 29 | 0.0924425217094447 | 0.184885043418889 | 0.907557478290555 |
| 30 | 0.087223329168826 | 0.174446658337652 | 0.912776670831174 |
| 31 | 0.0770876444687386 | 0.154175288937477 | 0.922912355531261 |
| 32 | 0.0764994098945029 | 0.152998819789006 | 0.923500590105497 |
| 33 | 0.129095029980392 | 0.258190059960784 | 0.870904970019608 |
| 34 | 0.333293359965631 | 0.666586719931261 | 0.66670664003437 |
| 35 | 0.385972351917548 | 0.771944703835096 | 0.614027648082452 |
| 36 | 0.368561944684645 | 0.73712388936929 | 0.631438055315355 |
| 37 | 0.538692066287264 | 0.922615867425472 | 0.461307933712736 |
| 38 | 0.720550036079432 | 0.558899927841136 | 0.279449963920568 |
| 39 | 0.70897841189667 | 0.582043176206661 | 0.291021588103331 |
| 40 | 0.818158816567777 | 0.363682366864446 | 0.181841183432223 |
| 41 | 0.915855456554655 | 0.168289086890689 | 0.0841445434453446 |
| 42 | 0.929204074257457 | 0.141591851485087 | 0.0707959257425433 |
| 43 | 0.879771314439204 | 0.240457371121591 | 0.120228685560796 |
| 44 | 0.956214488106274 | 0.0875710237874524 | 0.0437855118937262 |
| Meta Analysis of Goldfeld-Quandt test for Heteroskedasticity | |||
| Description | # significant tests | % significant tests | OK/NOK |
| 1% type I error level | 5 | 0.172413793103448 | NOK |
| 5% type I error level | 8 | 0.275862068965517 | NOK |
| 10% type I error level | 11 | 0.379310344827586 | NOK |