| Multiple Linear Regression - Estimated Regression Equation |
| ktot[t] = + 86.1933134730192 + 0.135872441268998vmtot[t] + e[t] |
| Multiple Linear Regression - Ordinary Least Squares | |||||
| Variable | Parameter | S.D. | T-STAT H0: parameter = 0 | 2-tail p-value | 1-tail p-value |
| (Intercept) | 86.1933134730192 | 1.09882 | 78.4417 | 0 | 0 |
| vmtot | 0.135872441268998 | 0.009884 | 13.7461 | 0 | 0 |
| Multiple Linear Regression - Regression Statistics | |
| Multiple R | 0.902562117697146 |
| R-squared | 0.814618376301957 |
| Adjusted R-squared | 0.81030717575084 |
| F-TEST (value) | 188.953950678736 |
| F-TEST (DF numerator) | 1 |
| F-TEST (DF denominator) | 43 |
| p-value | 0 |
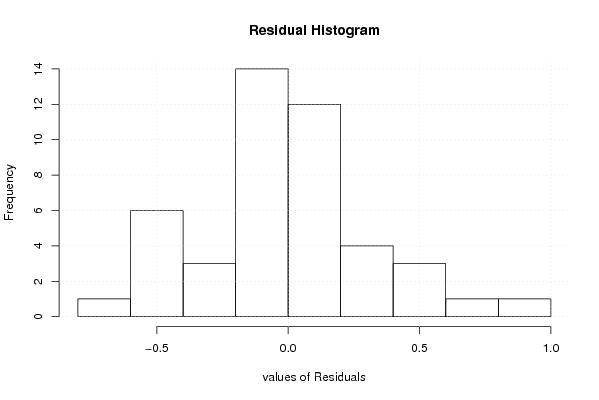
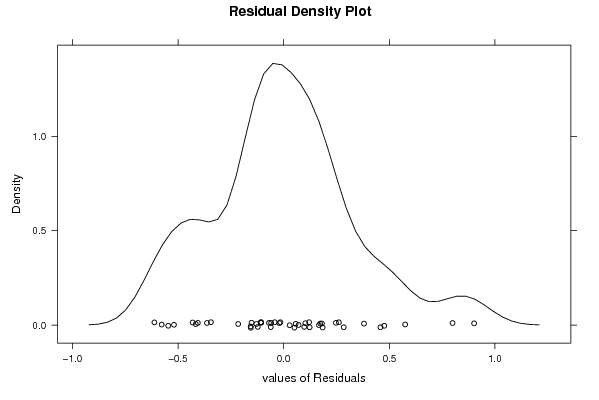
| Multiple Linear Regression - Residual Statistics | |
| Residual Standard Deviation | 0.341291632139295 |
| Sum Squared Residuals | 5.00863906123707 |
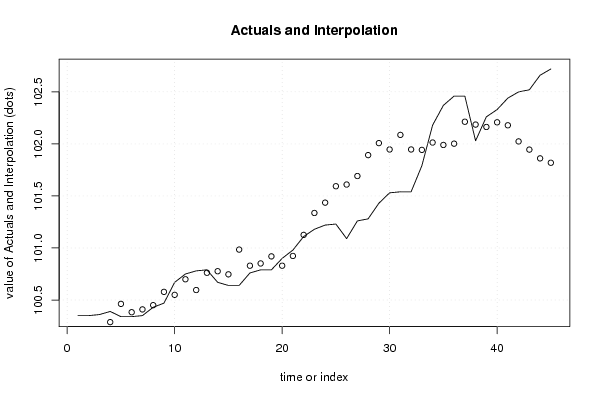
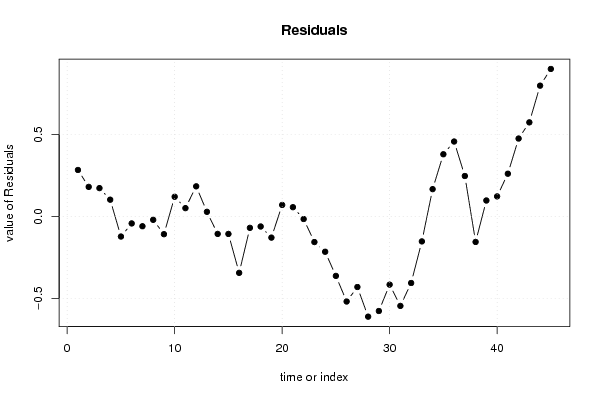
| Multiple Linear Regression - Actuals, Interpolation, and Residuals | |||
| Time or Index | Actuals | Interpolation Forecast | Residuals Prediction Error |
| 1 | 100.35 | 100.065889726584 | 0.284110273416090 |
| 2 | 100.35 | 100.169152781948 | 0.180847218051646 |
| 3 | 100.36 | 100.186816199313 | 0.173183800686682 |
| 4 | 100.39 | 100.287361805852 | 0.102638194147623 |
| 5 | 100.34 | 100.462637255089 | -0.122637255089381 |
| 6 | 100.34 | 100.382472514741 | -0.0424725147406731 |
| 7 | 100.35 | 100.409647002994 | -0.0596470029944803 |
| 8 | 100.43 | 100.450408735375 | -0.0204087353751689 |
| 9 | 100.47 | 100.578128830168 | -0.108128830168035 |
| 10 | 100.67 | 100.549595617502 | 0.120404382498459 |
| 11 | 100.75 | 100.699055302897 | 0.0509446971025573 |
| 12 | 100.78 | 100.595792247533 | 0.184207752466998 |
| 13 | 100.79 | 100.761556625881 | 0.0284433741188252 |
| 14 | 100.67 | 100.776502594421 | -0.106502594420769 |
| 15 | 100.64 | 100.746610657342 | -0.106610657341591 |
| 16 | 100.64 | 100.984387429562 | -0.344387429562338 |
| 17 | 100.76 | 100.829492846516 | -0.0694928465156753 |
| 18 | 100.79 | 100.851232437119 | -0.0612324371187134 |
| 19 | 100.79 | 100.919168657753 | -0.129168657753213 |
| 20 | 100.9 | 100.829492846516 | 0.0705071534843253 |
| 21 | 100.98 | 100.923244830991 | 0.056755169008715 |
| 22 | 101.11 | 101.125694768482 | -0.0156947684820985 |
| 23 | 101.18 | 101.336297052449 | -0.156297052449038 |
| 24 | 101.22 | 101.435483934575 | -0.215483934575416 |
| 25 | 101.23 | 101.593095966447 | -0.363095966447448 |
| 26 | 101.09 | 101.609400659400 | -0.519400659399727 |
| 27 | 101.26 | 101.690924124161 | -0.430924124161126 |
| 28 | 101.28 | 101.892015337239 | -0.612015337239248 |
| 29 | 101.43 | 102.007506912318 | -0.57750691231789 |
| 30 | 101.53 | 101.946364313747 | -0.416364313746846 |
| 31 | 101.54 | 102.086312928254 | -0.54631292825391 |
| 32 | 101.54 | 101.946364313747 | -0.406364313746841 |
| 33 | 101.79 | 101.942288140509 | -0.152288140508771 |
| 34 | 102.18 | 102.012941809969 | 0.167058190031349 |
| 35 | 102.37 | 101.989843494953 | 0.380156505047077 |
| 36 | 102.46 | 102.002072014667 | 0.457927985332857 |
| 37 | 102.46 | 102.212674298634 | 0.247325701365908 |
| 38 | 102.03 | 102.185499810380 | -0.155499810380284 |
| 39 | 102.26 | 102.162401495365 | 0.0975985046354496 |
| 40 | 102.33 | 102.207239400983 | 0.122760599016673 |
| 41 | 102.44 | 102.178706188317 | 0.261293811683162 |
| 42 | 102.5 | 102.023811605270 | 0.476188394729822 |
| 43 | 102.52 | 101.945005589334 | 0.574994410665837 |
| 44 | 102.66 | 101.860764675747 | 0.799235324252617 |
| 45 | 102.72 | 101.818644218954 | 0.90135578104601 |
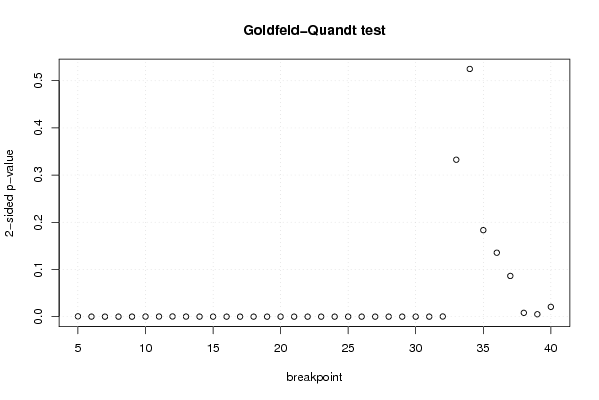
| Goldfeld-Quandt test for Heteroskedasticity | |||
| p-values | Alternative Hypothesis | ||
| breakpoint index | greater | 2-sided | less |
| 5 | 0.000342369094410682 | 0.000684738188821363 | 0.99965763090559 |
| 6 | 2.19631162840807e-05 | 4.39262325681614e-05 | 0.999978036883716 |
| 7 | 1.04239163641696e-06 | 2.08478327283392e-06 | 0.999998957608364 |
| 8 | 2.46188157367723e-06 | 4.92376314735446e-06 | 0.999997538118426 |
| 9 | 1.51631937953053e-06 | 3.03263875906105e-06 | 0.99999848368062 |
| 10 | 0.000109555781856124 | 0.000219111563712248 | 0.999890444218144 |
| 11 | 0.000135767934125275 | 0.00027153586825055 | 0.999864232065875 |
| 12 | 0.000202420202925220 | 0.000404840405850441 | 0.999797579797075 |
| 13 | 7.13425922918265e-05 | 0.000142685184583653 | 0.999928657407708 |
| 14 | 2.13539224248931e-05 | 4.27078448497862e-05 | 0.999978646077575 |
| 15 | 6.10672489369811e-06 | 1.22134497873962e-05 | 0.999993893275106 |
| 16 | 4.91325394364517e-06 | 9.82650788729034e-06 | 0.999995086746056 |
| 17 | 1.41843882489512e-06 | 2.83687764979024e-06 | 0.999998581561175 |
| 18 | 4.12411497536744e-07 | 8.24822995073487e-07 | 0.999999587588502 |
| 19 | 9.85092500084599e-08 | 1.97018500016920e-07 | 0.99999990149075 |
| 20 | 8.03774541945972e-08 | 1.60754908389194e-07 | 0.999999919622546 |
| 21 | 6.6352821021149e-08 | 1.32705642042298e-07 | 0.999999933647179 |
| 22 | 3.70526485351663e-08 | 7.41052970703326e-08 | 0.999999962947351 |
| 23 | 9.65474930837686e-09 | 1.93094986167537e-08 | 0.99999999034525 |
| 24 | 2.20421855835674e-09 | 4.40843711671349e-09 | 0.999999997795781 |
| 25 | 6.97163422498064e-10 | 1.39432684499613e-09 | 0.999999999302837 |
| 26 | 1.13440742382762e-09 | 2.26881484765524e-09 | 0.999999998865593 |
| 27 | 7.55858612668382e-10 | 1.51171722533676e-09 | 0.999999999244141 |
| 28 | 3.49207994486241e-09 | 6.98415988972483e-09 | 0.99999999650792 |
| 29 | 9.73866646069665e-09 | 1.94773329213933e-08 | 0.999999990261333 |
| 30 | 4.97482163301949e-08 | 9.94964326603898e-08 | 0.999999950251784 |
| 31 | 4.57861652815101e-07 | 9.15723305630201e-07 | 0.999999542138347 |
| 32 | 0.000156276012723636 | 0.000312552025447273 | 0.999843723987276 |
| 33 | 0.1663009265904 | 0.3326018531808 | 0.8336990734096 |
| 34 | 0.737515761424077 | 0.524968477151847 | 0.262484238575923 |
| 35 | 0.90833899312973 | 0.183322013740541 | 0.0916610068702703 |
| 36 | 0.93225260393449 | 0.135494792131019 | 0.0677473960655093 |
| 37 | 0.95684529745877 | 0.0863094050824605 | 0.0431547025412303 |
| 38 | 0.99595164773361 | 0.00809670453277799 | 0.00404835226638899 |
| 39 | 0.997458906835098 | 0.00508218632980332 | 0.00254109316490166 |
| 40 | 0.98960478848302 | 0.0207904230339585 | 0.0103952115169793 |
| Meta Analysis of Goldfeld-Quandt test for Heteroskedasticity | |||
| Description | # significant tests | % significant tests | OK/NOK |
| 1% type I error level | 30 | 0.833333333333333 | NOK |
| 5% type I error level | 31 | 0.861111111111111 | NOK |
| 10% type I error level | 32 | 0.888888888888889 | NOK |