| Multiple Linear Regression - Estimated Regression Equation |
| Y[t] = + 56.6688184694744 -0.414546054148085X[t] + 0.33464476226903Y1[t] + 0.436658336644705Y2[t] + 13.8710231589707M1[t] + 21.8094757766993M2[t] + 13.4085304100481M3[t] + 4.64011859452247M4[t] + 4.34174638169133M5[t] + 4.82811135206612M6[t] + 23.9529557196014M7[t] + 7.17288389240209M8[t] + 11.3657529755177M9[t] + 16.1462848792535M10[t] + 5.96354837739477M11[t] -0.0685256950949151t + e[t] |
| Multiple Linear Regression - Ordinary Least Squares | |||||
| Variable | Parameter | S.D. | T-STAT H0: parameter = 0 | 2-tail p-value | 1-tail p-value |
| (Intercept) | 56.6688184694744 | 35.495238 | 1.5965 | 0.117871 | 0.058935 |
| X | -0.414546054148085 | 0.284414 | -1.4575 | 0.152403 | 0.076202 |
| Y1 | 0.33464476226903 | 0.141499 | 2.365 | 0.022726 | 0.011363 |
| Y2 | 0.436658336644705 | 0.161109 | 2.7103 | 0.009692 | 0.004846 |
| M1 | 13.8710231589707 | 7.787796 | 1.7811 | 0.082125 | 0.041063 |
| M2 | 21.8094757766993 | 8.076136 | 2.7005 | 0.009938 | 0.004969 |
| M3 | 13.4085304100481 | 7.859373 | 1.7061 | 0.095383 | 0.047692 |
| M4 | 4.64011859452247 | 7.653853 | 0.6062 | 0.547614 | 0.273807 |
| M5 | 4.34174638169133 | 7.707779 | 0.5633 | 0.57623 | 0.288115 |
| M6 | 4.82811135206612 | 7.872739 | 0.6133 | 0.543005 | 0.271503 |
| M7 | 23.9529557196014 | 8.033431 | 2.9817 | 0.004755 | 0.002378 |
| M8 | 7.17288389240209 | 8.335585 | 0.8605 | 0.394392 | 0.197196 |
| M9 | 11.3657529755177 | 7.779751 | 1.4609 | 0.151473 | 0.075737 |
| M10 | 16.1462848792535 | 8.021862 | 2.0128 | 0.050577 | 0.025289 |
| M11 | 5.96354837739477 | 8.106628 | 0.7356 | 0.466039 | 0.23302 |
| t | -0.0685256950949151 | 0.145264 | -0.4717 | 0.63956 | 0.31978 |
| Multiple Linear Regression - Regression Statistics | |
| Multiple R | 0.783083562088961 |
| R-squared | 0.613219865213936 |
| Adjusted R-squared | 0.475084102790342 |
| F-TEST (value) | 4.43925493626692 |
| F-TEST (DF numerator) | 15 |
| F-TEST (DF denominator) | 42 |
| p-value | 6.60816942024134e-05 |
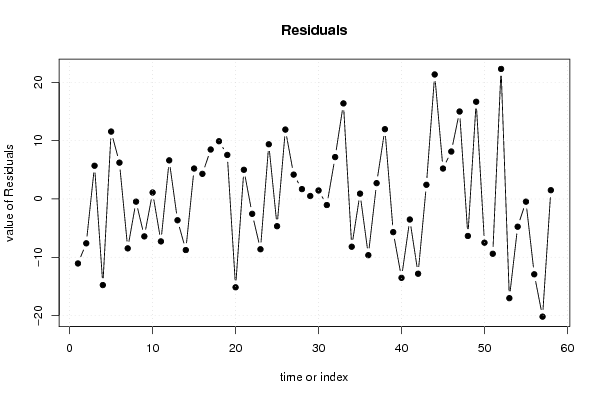
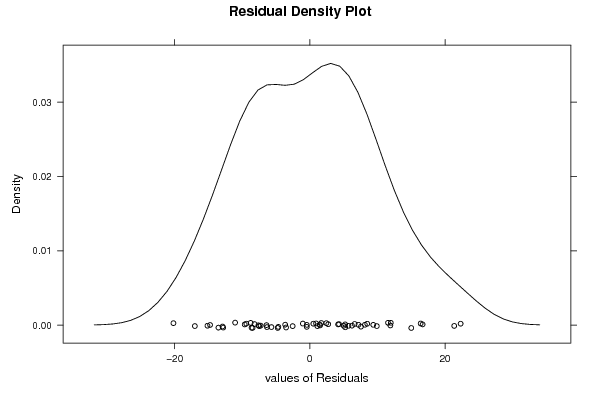
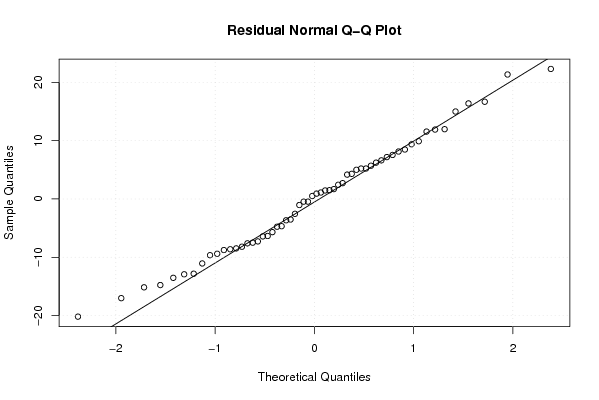
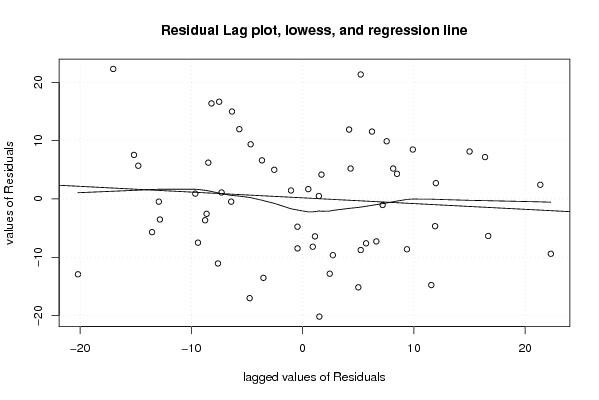
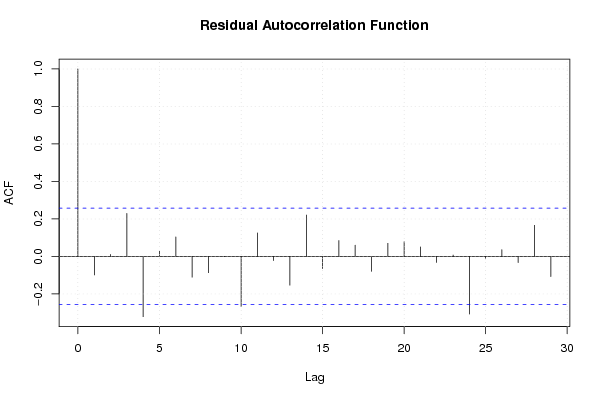
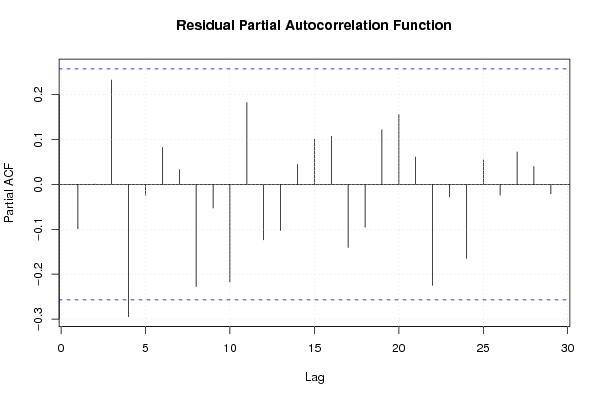
| Multiple Linear Regression - Residual Statistics | |
| Residual Standard Deviation | 11.3831582891788 |
| Sum Squared Residuals | 5442.20429073303 |
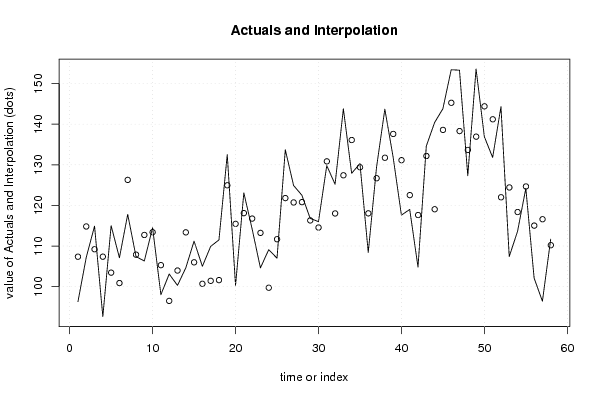
| Multiple Linear Regression - Actuals, Interpolation, and Residuals | |||
| Time or Index | Actuals | Interpolation Forecast | Residuals Prediction Error |
| 1 | 96.3 | 107.362646638182 | -11.0626466381815 |
| 2 | 107.2 | 114.808919914822 | -7.6089199148215 |
| 3 | 114.9 | 109.201650487176 | 5.69834951282385 |
| 4 | 92.6 | 107.369416672136 | -14.7694166721359 |
| 5 | 115 | 103.441119628167 | 11.5588803718328 |
| 6 | 107.1 | 100.87133777363 | 6.22866222637008 |
| 7 | 117.8 | 126.277472062105 | -8.47747206210496 |
| 8 | 107.4 | 107.860333814589 | -0.460333814589034 |
| 9 | 106.3 | 112.720615217547 | -6.42061521754726 |
| 10 | 114.5 | 113.393812200298 | 1.10618779970174 |
| 11 | 98 | 105.281949067397 | -7.28194906739706 |
| 12 | 103.1 | 96.4797426696588 | 6.6202573303412 |
| 13 | 100.3 | 103.954973758173 | -3.65497375817286 |
| 14 | 104.6 | 113.36358049583 | -8.7635804958301 |
| 15 | 111.2 | 105.980985282947 | 5.21901471705336 |
| 16 | 105 | 100.691424180481 | 4.30857581951862 |
| 17 | 109.9 | 101.421856006246 | 8.47814399375395 |
| 18 | 111.5 | 101.601265037743 | 9.89873496225682 |
| 19 | 132.5 | 124.949370790551 | 7.55062920944943 |
| 20 | 100.3 | 115.453875165804 | -15.1538751658042 |
| 21 | 123.1 | 118.096846094545 | 5.00315390545463 |
| 22 | 114.2 | 116.751445891694 | -2.55144589169392 |
| 23 | 104.6 | 113.228927753556 | -8.62892775355634 |
| 24 | 109.1 | 99.7249133184128 | 9.37508668158718 |
| 25 | 107 | 111.670484289006 | -4.67048428900626 |
| 26 | 133.7 | 121.797530255732 | 11.9024697442685 |
| 27 | 124.9 | 120.724272758393 | 4.17572724160745 |
| 28 | 122.5 | 120.808511955292 | 1.69148804470785 |
| 29 | 116.8 | 116.293328520425 | 0.506671479575255 |
| 30 | 116 | 114.543350145705 | 1.45664985429479 |
| 31 | 129.8 | 130.843000489456 | -1.04300048945553 |
| 32 | 125.2 | 118.014446384669 | 7.18555361533069 |
| 33 | 143.8 | 127.412946414831 | 16.3870535851693 |
| 34 | 127.9 | 136.091989220621 | -8.1919892206211 |
| 35 | 130.3 | 129.387903262648 | 0.912096737352066 |
| 36 | 108.4 | 118.045201175249 | -9.6452011752493 |
| 37 | 129.4 | 126.686232699580 | 2.71376730041953 |
| 38 | 143.7 | 131.730699819441 | 11.9693001805589 |
| 39 | 131.9 | 137.589565376414 | -5.68956537641419 |
| 40 | 117.6 | 131.130943095868 | -13.5309430958680 |
| 41 | 119 | 122.525695537094 | -3.52569553709440 |
| 42 | 104.8 | 117.623823925095 | -12.8238239250945 |
| 43 | 134.6 | 132.166417195884 | 2.43358280411601 |
| 44 | 140.4 | 119.048230603437 | 21.3517693965628 |
| 45 | 143.8 | 138.581932704193 | 5.21806729580663 |
| 46 | 153.4 | 145.264710635081 | 8.13528936491888 |
| 47 | 153.3 | 138.301219916399 | 14.9987800836013 |
| 48 | 127.3 | 133.650142836679 | -6.35014283667909 |
| 49 | 153.6 | 136.925662615059 | 16.6743373849411 |
| 50 | 136.9 | 144.399269514176 | -7.49926951417574 |
| 51 | 131.8 | 141.203526095070 | -9.40352609507046 |
| 52 | 144.3 | 121.999704096223 | 22.3002959037774 |
| 53 | 107.4 | 124.418000308068 | -17.0180003080676 |
| 54 | 113.6 | 118.360223117827 | -4.76022311782716 |
| 55 | 124.2 | 124.663739462005 | -0.46373946200495 |
| 56 | 102.1 | 115.023114031500 | -12.9231140315002 |
| 57 | 96.4 | 116.587659568883 | -20.1876595688832 |
| 58 | 111.7 | 110.198042052306 | 1.50195794769441 |
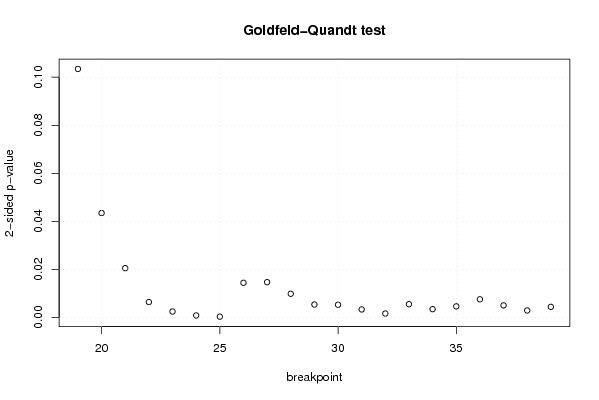
| Goldfeld-Quandt test for Heteroskedasticity | |||
| p-values | Alternative Hypothesis | ||
| breakpoint index | greater | 2-sided | less |
| 19 | 0.0517249140379958 | 0.103449828075992 | 0.948275085962004 |
| 20 | 0.0217229741926588 | 0.0434459483853176 | 0.978277025807341 |
| 21 | 0.0102476506618771 | 0.0204953013237541 | 0.989752349338123 |
| 22 | 0.00319409762150188 | 0.00638819524300376 | 0.996805902378498 |
| 23 | 0.00122580835889825 | 0.0024516167177965 | 0.998774191641102 |
| 24 | 0.000408308577141472 | 0.000816617154282944 | 0.999591691422859 |
| 25 | 0.000153923004417758 | 0.000307846008835515 | 0.999846076995582 |
| 26 | 0.00720553289136122 | 0.0144110657827224 | 0.992794467108639 |
| 27 | 0.00732987014190539 | 0.0146597402838108 | 0.992670129858095 |
| 28 | 0.00491435581732351 | 0.00982871163464702 | 0.995085644182677 |
| 29 | 0.002672551326406 | 0.005345102652812 | 0.997327448673594 |
| 30 | 0.00262313447920807 | 0.00524626895841614 | 0.997376865520792 |
| 31 | 0.00165669049793232 | 0.00331338099586464 | 0.998343309502068 |
| 32 | 0.000801877298457971 | 0.00160375459691594 | 0.999198122701542 |
| 33 | 0.00274788983262078 | 0.00549577966524156 | 0.99725211016738 |
| 34 | 0.00171160563120588 | 0.00342321126241176 | 0.998288394368794 |
| 35 | 0.00229872291849142 | 0.00459744583698285 | 0.997701277081509 |
| 36 | 0.00376489421458175 | 0.0075297884291635 | 0.996235105785418 |
| 37 | 0.00250308357520116 | 0.00500616715040231 | 0.997496916424799 |
| 38 | 0.00143892628193705 | 0.00287785256387411 | 0.998561073718063 |
| 39 | 0.00219574019336480 | 0.00439148038672961 | 0.997804259806635 |
| Meta Analysis of Goldfeld-Quandt test for Heteroskedasticity | |||
| Description | # significant tests | % significant tests | OK/NOK |
| 1% type I error level | 16 | 0.761904761904762 | NOK |
| 5% type I error level | 20 | 0.952380952380952 | NOK |
| 10% type I error level | 20 | 0.952380952380952 | NOK |