| Multiple Linear Regression - Estimated Regression Equation |
| TIA[t] = + 34.5997540927041 + 0.298221021904011IAidM[t] + 0.3378221767271`TIA(t-3)`[t] -1.02304293176696M1[t] + 2.56849582970055M2[t] + 11.8907715171465M3[t] + 6.85428025389231M4[t] + 5.83103077546227M5[t] + 10.3857785141985M6[t] -8.11533998012746M7[t] + 2.61781806550856M8[t] + 8.80566945224169M9[t] + 16.9982285968716M10[t] + 9.45582905532634M11[t] + e[t] |
| Multiple Linear Regression - Ordinary Least Squares | |||||
| Variable | Parameter | S.D. | T-STAT H0: parameter = 0 | 2-tail p-value | 1-tail p-value |
| (Intercept) | 34.5997540927041 | 11.151053 | 3.1028 | 0.003273 | 0.001636 |
| IAidM | 0.298221021904011 | 0.071117 | 4.1934 | 0.000124 | 6.2e-05 |
| `TIA(t-3)` | 0.3378221767271 | 0.122632 | 2.7548 | 0.008386 | 0.004193 |
| M1 | -1.02304293176696 | 2.310845 | -0.4427 | 0.660048 | 0.330024 |
| M2 | 2.56849582970055 | 2.522807 | 1.0181 | 0.313951 | 0.156975 |
| M3 | 11.8907715171465 | 3.429961 | 3.4667 | 0.001153 | 0.000577 |
| M4 | 6.85428025389231 | 3.162832 | 2.1671 | 0.035438 | 0.017719 |
| M5 | 5.83103077546227 | 2.977952 | 1.9581 | 0.056303 | 0.028152 |
| M6 | 10.3857785141985 | 2.584277 | 4.0188 | 0.000215 | 0.000107 |
| M7 | -8.11533998012746 | 2.404222 | -3.3755 | 0.001506 | 0.000753 |
| M8 | 2.61781806550856 | 2.50453 | 1.0452 | 0.301377 | 0.150688 |
| M9 | 8.80566945224169 | 2.544644 | 3.4605 | 0.001174 | 0.000587 |
| M10 | 16.9982285968716 | 4.754544 | 3.5752 | 0.000836 | 0.000418 |
| M11 | 9.45582905532634 | 3.259021 | 2.9014 | 0.005682 | 0.002841 |
| Multiple Linear Regression - Regression Statistics | |
| Multiple R | 0.938876145706808 |
| R-squared | 0.881488416977271 |
| Adjusted R-squared | 0.847996013079543 |
| F-TEST (value) | 26.3190549017914 |
| F-TEST (DF numerator) | 13 |
| F-TEST (DF denominator) | 46 |
| p-value | 0 |
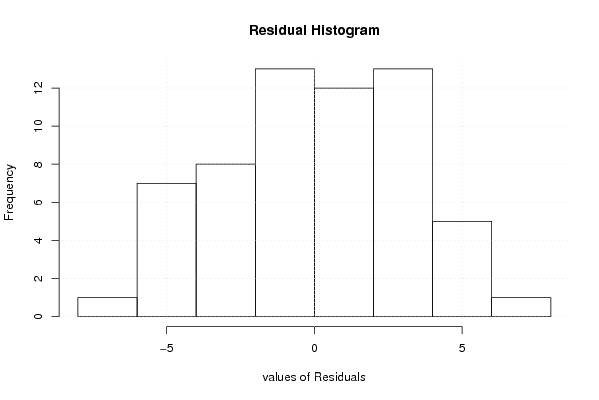
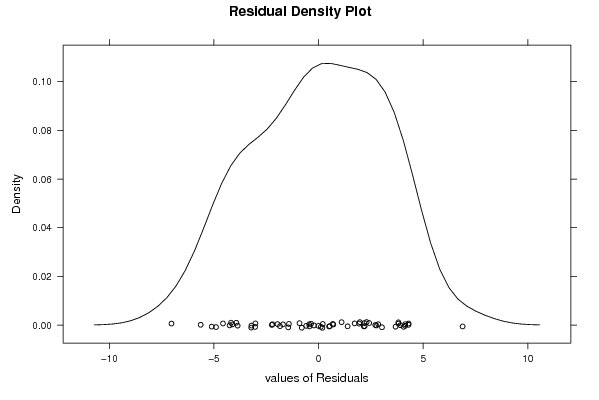
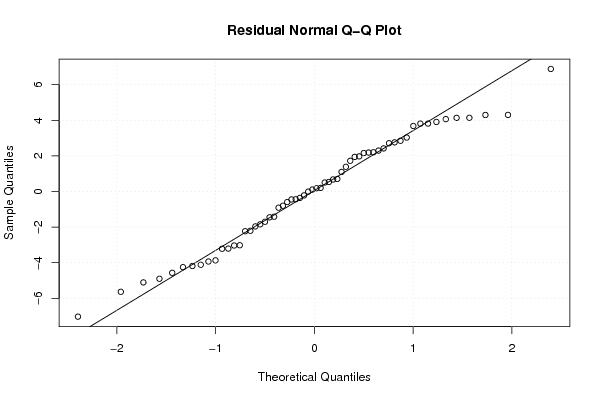
| Multiple Linear Regression - Residual Statistics | |
| Residual Standard Deviation | 3.50877077042316 |
| Sum Squared Residuals | 566.327726691294 |
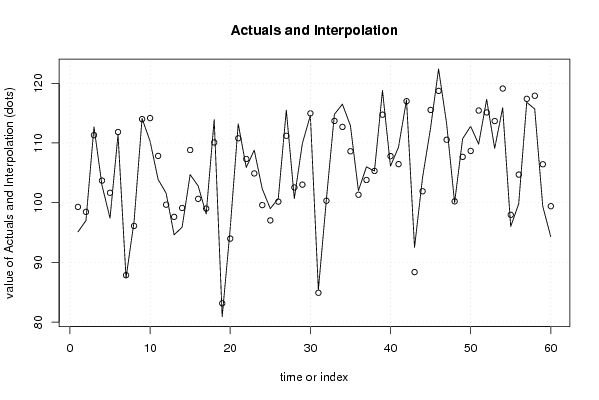
| Multiple Linear Regression - Actuals, Interpolation, and Residuals | |||
| Time or Index | Actuals | Interpolation Forecast | Residuals Prediction Error |
| 1 | 95.1 | 99.2845801559503 | -4.18458015595026 |
| 2 | 97 | 98.450648402293 | -1.45064840229292 |
| 3 | 112.7 | 111.314076491578 | 1.38592350842182 |
| 4 | 102.9 | 103.701246565649 | -0.801246565648725 |
| 5 | 97.4 | 101.649821500338 | -4.24982150033771 |
| 6 | 111.4 | 111.836420537784 | -0.436420537783846 |
| 7 | 87.4 | 87.847631251633 | -0.447631251633005 |
| 8 | 96.8 | 96.0965031792716 | 0.703496820728446 |
| 9 | 114.1 | 113.992236952738 | 0.107763047262040 |
| 10 | 110.3 | 114.166530162489 | -3.86653016248863 |
| 11 | 103.9 | 107.831400337612 | -3.93140033761166 |
| 12 | 101.6 | 99.6571133045328 | 1.94288669546721 |
| 13 | 94.6 | 97.6187450209164 | -3.01874502091646 |
| 14 | 95.9 | 99.1078660557113 | -3.20786605571133 |
| 15 | 104.7 | 108.816212722111 | -4.1162127221106 |
| 16 | 102.8 | 100.639591564816 | 2.16040843518373 |
| 17 | 98.1 | 99.0117373394674 | -0.911737339467426 |
| 18 | 113.9 | 110.08815039406 | 3.81184960594011 |
| 19 | 80.9 | 83.1317789900673 | -2.23177899006733 |
| 20 | 95.7 | 93.9770326299388 | 1.72296737006117 |
| 21 | 113.2 | 110.780986496661 | 2.41901350333886 |
| 22 | 105.9 | 107.31843807206 | -1.41843807205991 |
| 23 | 108.8 | 104.895095154837 | 3.90490484516264 |
| 24 | 102.3 | 99.5916501630016 | 2.70834983699839 |
| 25 | 99 | 97.0269905090292 | 1.97300949097075 |
| 26 | 100.7 | 100.166752677866 | 0.533247322133904 |
| 27 | 115.5 | 111.199879603528 | 4.30012039647155 |
| 28 | 100.7 | 102.543518573081 | -1.84351857308113 |
| 29 | 109.9 | 103.019051962990 | 6.88094803701041 |
| 30 | 114.6 | 114.959336092519 | -0.359336092519019 |
| 31 | 85.4 | 84.8975869007437 | 0.502413099256293 |
| 32 | 100.5 | 100.319280388360 | 0.180719611639698 |
| 33 | 114.8 | 113.701451217506 | 1.09854878249378 |
| 34 | 116.5 | 112.685689049894 | 3.8143109501064 |
| 35 | 112.9 | 108.604188756456 | 4.29581124354449 |
| 36 | 102 | 101.325049733381 | 0.67495026661899 |
| 37 | 106 | 103.798870516709 | 2.20112948329057 |
| 38 | 105.3 | 105.309408478438 | -0.00940847843775233 |
| 39 | 118.8 | 114.736829417739 | 4.06317058226074 |
| 40 | 106.1 | 107.801017722640 | -1.70101772263975 |
| 41 | 109.3 | 106.451826413930 | 2.84817358607048 |
| 42 | 117.2 | 116.998634443621 | 0.201365556379122 |
| 43 | 92.5 | 88.3620422755421 | 4.13795772445789 |
| 44 | 104.2 | 101.905913213748 | 2.29408678625189 |
| 45 | 112.5 | 115.534096147090 | -3.03409614708951 |
| 46 | 122.4 | 118.722522971885 | 3.67747702811506 |
| 47 | 113.3 | 110.540039160725 | 2.75996083927499 |
| 48 | 100 | 100.220015602814 | -0.220015602814265 |
| 49 | 110.7 | 107.670813797395 | 3.02918620260541 |
| 50 | 112.8 | 108.665324385692 | 4.13467561430809 |
| 51 | 109.8 | 115.433001765044 | -5.63300176504351 |
| 52 | 117.3 | 115.114625573814 | 2.18537442618588 |
| 53 | 109.1 | 113.667562783276 | -4.56756278327575 |
| 54 | 115.9 | 119.117458532016 | -3.21745853201637 |
| 55 | 96 | 97.9609605820139 | -1.96096058201385 |
| 56 | 99.8 | 104.701270588681 | -4.9012705886812 |
| 57 | 116.8 | 117.391229186005 | -0.59122918600517 |
| 58 | 115.7 | 117.906819743673 | -2.20681974367292 |
| 59 | 99.4 | 106.429276590370 | -7.02927659037046 |
| 60 | 94.3 | 99.4061711962703 | -5.10617119627032 |
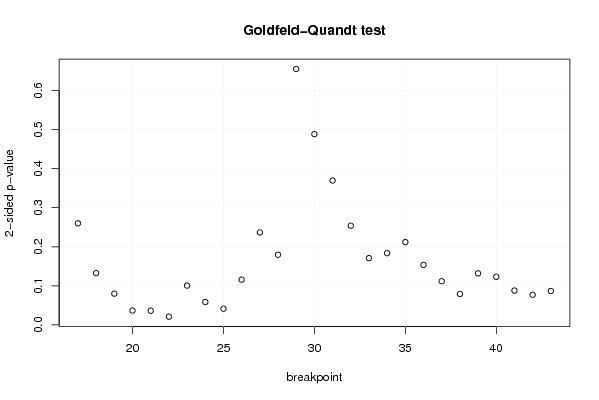
| Goldfeld-Quandt test for Heteroskedasticity | |||
| p-values | Alternative Hypothesis | ||
| breakpoint index | greater | 2-sided | less |
| 17 | 0.130010385281992 | 0.260020770563984 | 0.869989614718008 |
| 18 | 0.0662062631748249 | 0.132412526349650 | 0.933793736825175 |
| 19 | 0.0400664367385688 | 0.0801328734771377 | 0.959933563261431 |
| 20 | 0.0184216635902407 | 0.0368433271804813 | 0.98157833640976 |
| 21 | 0.0181739333780818 | 0.0363478667561637 | 0.981826066621918 |
| 22 | 0.0105814829498701 | 0.0211629658997401 | 0.98941851705013 |
| 23 | 0.0503261007822526 | 0.100652201564505 | 0.949673899217747 |
| 24 | 0.0292680309317347 | 0.0585360618634693 | 0.970731969068265 |
| 25 | 0.0207002341356536 | 0.0414004682713071 | 0.979299765864346 |
| 26 | 0.0578773995050915 | 0.115754799010183 | 0.942122600494908 |
| 27 | 0.118318201188694 | 0.236636402377388 | 0.881681798811306 |
| 28 | 0.089760434685679 | 0.179520869371358 | 0.910239565314321 |
| 29 | 0.327538363598708 | 0.655076727197417 | 0.672461636401292 |
| 30 | 0.244100112650181 | 0.488200225300363 | 0.755899887349819 |
| 31 | 0.184809646026605 | 0.369619292053211 | 0.815190353973394 |
| 32 | 0.126936678751184 | 0.253873357502369 | 0.873063321248816 |
| 33 | 0.085475766473833 | 0.170951532947666 | 0.914524233526167 |
| 34 | 0.0917775182832606 | 0.183555036566521 | 0.90822248171674 |
| 35 | 0.105934648733168 | 0.211869297466337 | 0.894065351266832 |
| 36 | 0.0767698889034632 | 0.153539777806926 | 0.923230111096537 |
| 37 | 0.0558966312672782 | 0.111793262534556 | 0.944103368732722 |
| 38 | 0.0396151226737504 | 0.0792302453475009 | 0.96038487732625 |
| 39 | 0.06598040566108 | 0.13196081132216 | 0.93401959433892 |
| 40 | 0.0615639655985189 | 0.123127931197038 | 0.938436034401481 |
| 41 | 0.0439470406739921 | 0.0878940813479842 | 0.956052959326008 |
| 42 | 0.0385600347253864 | 0.0771200694507729 | 0.961439965274614 |
| 43 | 0.043352462416866 | 0.086704924833732 | 0.956647537583134 |
| Meta Analysis of Goldfeld-Quandt test for Heteroskedasticity | |||
| Description | # significant tests | % significant tests | OK/NOK |
| 1% type I error level | 0 | 0 | OK |
| 5% type I error level | 4 | 0.148148148148148 | NOK |
| 10% type I error level | 10 | 0.370370370370370 | NOK |