| Multiple Linear Regression - Estimated Regression Equation |
| Y[t] = + 106.850129100590 -0.538798718918726X[t] + 0.291815822997867Y1[t] + 0.500730273935326Y2[t] + 0.260686397627196Y3[t] -0.383518985923385Y4[t] -11.1406334334353M1[t] -25.8052401812007M2[t] -25.288184371146M3[t] -20.9695688872197M4[t] -1.12377457251293M5[t] -18.6728896312874M6[t] -16.4695496880641M7[t] -16.1366071199349M8[t] -17.4192741971750M9[t] -30.11444063088M10[t] -8.84376235170137M11[t] -0.0619092178886454t + e[t] |
| Multiple Linear Regression - Ordinary Least Squares | |||||
| Variable | Parameter | S.D. | T-STAT H0: parameter = 0 | 2-tail p-value | 1-tail p-value |
| (Intercept) | 106.850129100590 | 35.621142 | 2.9996 | 0.004751 | 0.002376 |
| X | -0.538798718918726 | 0.283326 | -1.9017 | 0.064813 | 0.032406 |
| Y1 | 0.291815822997867 | 0.148786 | 1.9613 | 0.0572 | 0.0286 |
| Y2 | 0.500730273935326 | 0.157535 | 3.1785 | 0.00294 | 0.00147 |
| Y3 | 0.260686397627196 | 0.169209 | 1.5406 | 0.131697 | 0.065848 |
| Y4 | -0.383518985923385 | 0.171674 | -2.234 | 0.031446 | 0.015723 |
| M1 | -11.1406334334353 | 7.707668 | -1.4454 | 0.156544 | 0.078272 |
| M2 | -25.8052401812007 | 8.277069 | -3.1177 | 0.003467 | 0.001733 |
| M3 | -25.288184371146 | 7.816939 | -3.235 | 0.00252 | 0.00126 |
| M4 | -20.9695688872197 | 7.452359 | -2.8138 | 0.007711 | 0.003855 |
| M5 | -1.12377457251293 | 7.449147 | -0.1509 | 0.880885 | 0.440442 |
| M6 | -18.6728896312874 | 7.636335 | -2.4453 | 0.01922 | 0.00961 |
| M7 | -16.4695496880641 | 8.442743 | -1.9507 | 0.058492 | 0.029246 |
| M8 | -16.1366071199349 | 7.910961 | -2.0398 | 0.048369 | 0.024184 |
| M9 | -17.4192741971750 | 8.067463 | -2.1592 | 0.037212 | 0.018606 |
| M10 | -30.11444063088 | 8.312143 | -3.6229 | 0.000849 | 0.000424 |
| M11 | -8.84376235170137 | 8.077025 | -1.0949 | 0.28044 | 0.14022 |
| t | -0.0619092178886454 | 0.187738 | -0.3298 | 0.74339 | 0.371695 |
| Multiple Linear Regression - Regression Statistics | |
| Multiple R | 0.822066171071495 |
| R-squared | 0.675792789620149 |
| Adjusted R-squared | 0.530752721818636 |
| F-TEST (value) | 4.65935241112113 |
| F-TEST (DF numerator) | 17 |
| F-TEST (DF denominator) | 38 |
| p-value | 3.97256906923271e-05 |
| Multiple Linear Regression - Residual Statistics | |
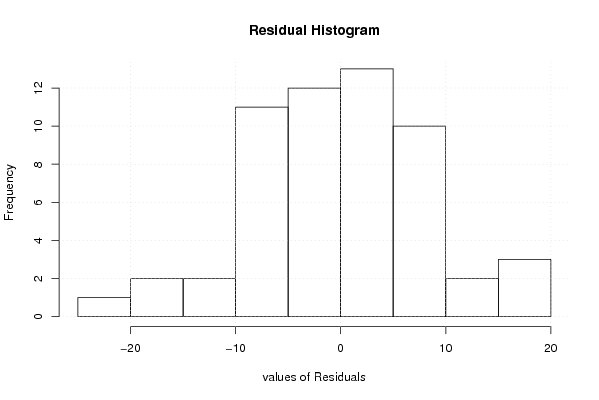
| Residual Standard Deviation | 10.6850633507316 |
| Sum Squared Residuals | 4338.48199474764 |
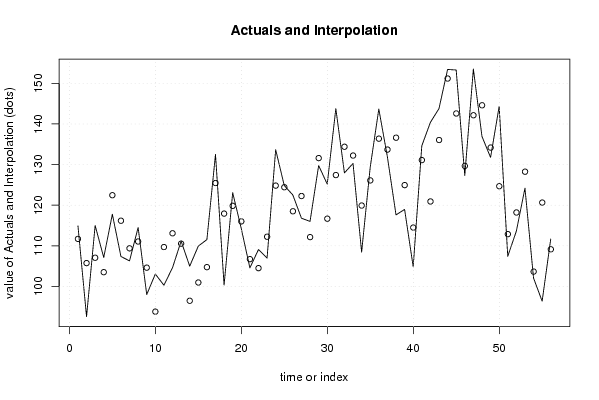
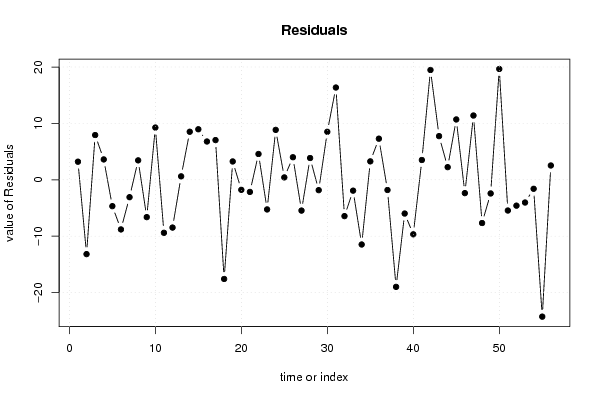
| Multiple Linear Regression - Actuals, Interpolation, and Residuals | |||
| Time or Index | Actuals | Interpolation Forecast | Residuals Prediction Error |
| 1 | 114.91 | 111.700154071361 | 3.20984592863867 |
| 2 | 92.56 | 105.747819052381 | -13.1878190523812 |
| 3 | 115 | 107.063438557842 | 7.93656144215788 |
| 4 | 107.12 | 103.510483154601 | 3.60951684539874 |
| 5 | 117.78 | 122.459690496717 | -4.67969049671719 |
| 6 | 107.37 | 116.177553800474 | -8.80755380047352 |
| 7 | 106.3 | 109.387465029074 | -3.08746502907399 |
| 8 | 114.51 | 111.066177214552 | 3.44382278544845 |
| 9 | 98 | 104.623318015396 | -6.62331801539574 |
| 10 | 103.06 | 93.7952594352802 | 9.26474056471982 |
| 11 | 100.29 | 109.697338914265 | -9.40733891426535 |
| 12 | 104.61 | 113.085989310960 | -8.47598931096034 |
| 13 | 111.15 | 110.539517095504 | 0.610482904495695 |
| 14 | 104.99 | 96.4676057989711 | 8.52239420102888 |
| 15 | 109.93 | 100.965614845008 | 8.96438515499232 |
| 16 | 111.54 | 104.748181145857 | 6.79181885414297 |
| 17 | 132.5 | 125.457381910214 | 7.04261808978643 |
| 18 | 100.34 | 117.934341935161 | -17.5943419351612 |
| 19 | 123.1 | 119.846103324017 | 3.25389667598318 |
| 20 | 114.24 | 116.01914729302 | -1.7791472930201 |
| 21 | 104.57 | 106.724028155335 | -2.15402815533472 |
| 22 | 109.08 | 104.501673392927 | 4.57832660707274 |
| 23 | 106.98 | 112.239657863795 | -5.25965786379481 |
| 24 | 133.68 | 124.826473006013 | 8.8535269939869 |
| 25 | 124.85 | 124.429229447889 | 0.420770552110658 |
| 26 | 122.51 | 118.509317325922 | 4.00068267407811 |
| 27 | 116.8 | 122.261665748833 | -5.46166574883334 |
| 28 | 116.01 | 112.14613061372 | 3.86386938627997 |
| 29 | 129.76 | 131.600613859887 | -1.84061385988741 |
| 30 | 125.2 | 116.681340123916 | 8.51865987608409 |
| 31 | 143.79 | 127.422516594758 | 16.3674834052421 |
| 32 | 127.95 | 134.393826793097 | -6.44382679309673 |
| 33 | 130.3 | 132.227021356999 | -1.92702135699910 |
| 34 | 108.44 | 119.918301444609 | -11.4783014446093 |
| 35 | 129.37 | 126.104394851696 | 3.26560514830363 |
| 36 | 143.68 | 136.385323976781 | 7.29467602321861 |
| 37 | 131.88 | 133.697055028054 | -1.8170550280537 |
| 38 | 117.62 | 136.618661700689 | -18.9986617006888 |
| 39 | 118.96 | 124.948670069839 | -5.98867006983904 |
| 40 | 104.82 | 114.495194217001 | -9.67519421700053 |
| 41 | 134.62 | 131.109283390083 | 3.51071660991693 |
| 42 | 140.4 | 120.921569103020 | 19.4784308969795 |
| 43 | 143.8 | 136.053338961402 | 7.74666103859817 |
| 44 | 153.43 | 151.187717468672 | 2.24228253132755 |
| 45 | 153.29 | 142.585632472270 | 10.7043675277296 |
| 46 | 127.31 | 129.674765727183 | -2.36476572718326 |
| 47 | 153.55 | 142.148608370243 | 11.4013916297565 |
| 48 | 136.93 | 144.602213706245 | -7.67221370624518 |
| 49 | 131.77 | 134.194044357191 | -2.42404435719133 |
| 50 | 144.34 | 124.676596122037 | 19.663403877963 |
| 51 | 107.42 | 112.870610778478 | -5.45061077847782 |
| 52 | 113.62 | 118.210010868821 | -4.59001086882115 |
| 53 | 124.22 | 128.253030343099 | -4.03303034309875 |
| 54 | 102.06 | 103.655195037429 | -1.59519503742886 |
| 55 | 96.37 | 120.650576090749 | -24.2805760907494 |
| 56 | 111.68 | 109.143131230659 | 2.53686876934082 |
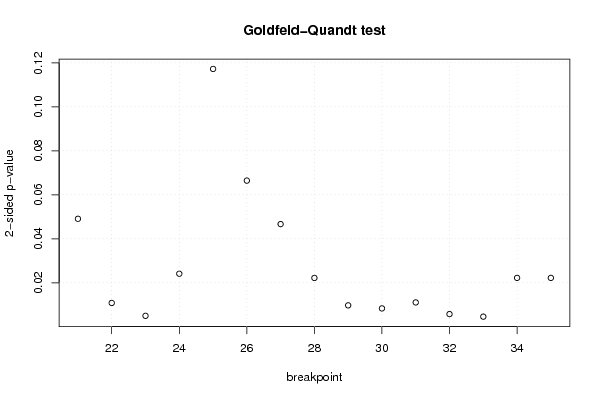
| Goldfeld-Quandt test for Heteroskedasticity | |||
| p-values | Alternative Hypothesis | ||
| breakpoint index | greater | 2-sided | less |
| 21 | 0.0245400847239681 | 0.0490801694479361 | 0.975459915276032 |
| 22 | 0.00540706971063744 | 0.0108141394212749 | 0.994592930289363 |
| 23 | 0.00248134963239024 | 0.00496269926478049 | 0.99751865036761 |
| 24 | 0.0120536218700694 | 0.0241072437401389 | 0.98794637812993 |
| 25 | 0.0586095109158621 | 0.117219021831724 | 0.941390489084138 |
| 26 | 0.0332215486875245 | 0.066443097375049 | 0.966778451312476 |
| 27 | 0.0233359739881288 | 0.0466719479762576 | 0.976664026011871 |
| 28 | 0.0110968979905668 | 0.0221937959811337 | 0.988903102009433 |
| 29 | 0.00486341652313687 | 0.00972683304627374 | 0.995136583476863 |
| 30 | 0.00416954354095026 | 0.00833908708190052 | 0.99583045645905 |
| 31 | 0.00552771924401556 | 0.0110554384880311 | 0.994472280755984 |
| 32 | 0.00287549589434724 | 0.00575099178869447 | 0.997124504105653 |
| 33 | 0.00229275271241693 | 0.00458550542483385 | 0.997707247287583 |
| 34 | 0.0111032921992575 | 0.0222065843985149 | 0.988896707800742 |
| 35 | 0.0110998610493838 | 0.0221997220987675 | 0.988900138950616 |
| Meta Analysis of Goldfeld-Quandt test for Heteroskedasticity | |||
| Description | # significant tests | % significant tests | OK/NOK |
| 1% type I error level | 5 | 0.333333333333333 | NOK |
| 5% type I error level | 13 | 0.866666666666667 | NOK |
| 10% type I error level | 14 | 0.933333333333333 | NOK |