| Multiple Linear Regression - Estimated Regression Equation |
| Y[t] = + 4.44986041010845 -0.00197808566653005X[t] + 0.994282176708847`Yt-1`[t] + 0.147066157402592`Yt-2`[t] -0.382511912582321`Yt-3`[t] + 0.261349548161055M1[t] -0.168476823791646M2[t] -0.471950531563776M3[t] -0.510604588431602M4[t] + 0.146131731851114M5[t] + 0.88606344273659M6[t] + 1.08792158458782M7[t] + 0.0320781246262102M8[t] + 0.147371388525378M9[t] + 0.201264697862938M10[t] -0.309509853446752M11[t] -0.0185575755601159t + e[t] |
| Multiple Linear Regression - Ordinary Least Squares | |||||
| Variable | Parameter | S.D. | T-STAT H0: parameter = 0 | 2-tail p-value | 1-tail p-value |
| (Intercept) | 4.44986041010845 | 6.102328 | 0.7292 | 0.470124 | 0.235062 |
| X | -0.00197808566653005 | 0.228791 | -0.0086 | 0.993145 | 0.496572 |
| `Yt-1` | 0.994282176708847 | 0.146636 | 6.7806 | 0 | 0 |
| `Yt-2` | 0.147066157402592 | 0.216018 | 0.6808 | 0.499916 | 0.249958 |
| `Yt-3` | -0.382511912582321 | 0.149498 | -2.5586 | 0.014398 | 0.007199 |
| M1 | 0.261349548161055 | 3.492971 | 0.0748 | 0.94073 | 0.470365 |
| M2 | -0.168476823791646 | 3.498967 | -0.0482 | 0.961836 | 0.480918 |
| M3 | -0.471950531563776 | 3.495366 | -0.135 | 0.893272 | 0.446636 |
| M4 | -0.510604588431602 | 3.535994 | -0.1444 | 0.885908 | 0.442954 |
| M5 | 0.146131731851114 | 3.498611 | 0.0418 | 0.966891 | 0.483446 |
| M6 | 0.88606344273659 | 3.50557 | 0.2528 | 0.801749 | 0.400875 |
| M7 | 1.08792158458782 | 3.509969 | 0.31 | 0.758207 | 0.379103 |
| M8 | 0.0320781246262102 | 3.519304 | 0.0091 | 0.992773 | 0.496386 |
| M9 | 0.147371388525378 | 3.532918 | 0.0417 | 0.966934 | 0.483467 |
| M10 | 0.201264697862938 | 3.673779 | 0.0548 | 0.956583 | 0.478292 |
| M11 | -0.309509853446752 | 3.792425 | -0.0816 | 0.935362 | 0.467681 |
| t | -0.0185575755601159 | 0.083933 | -0.2211 | 0.826139 | 0.41307 |
| Multiple Linear Regression - Regression Statistics | |
| Multiple R | 0.897242589915076 |
| R-squared | 0.805044265157513 |
| Adjusted R-squared | 0.727061971220518 |
| F-TEST (value) | 10.3234237480618 |
| F-TEST (DF numerator) | 16 |
| F-TEST (DF denominator) | 40 |
| p-value | 1.33000888080659e-09 |
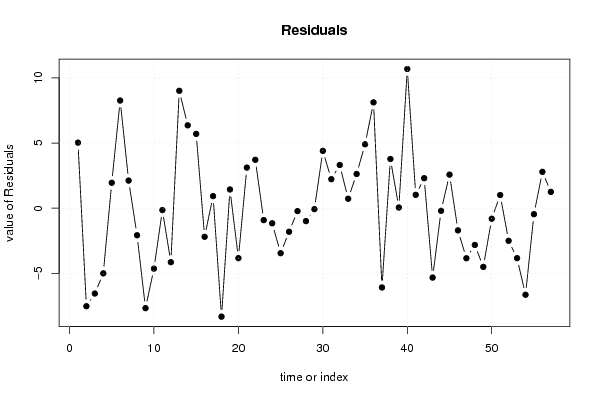
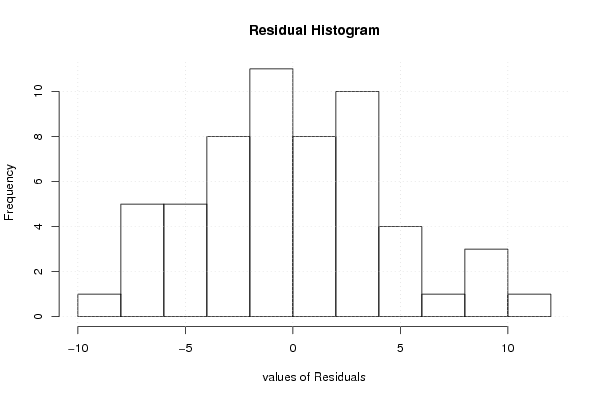
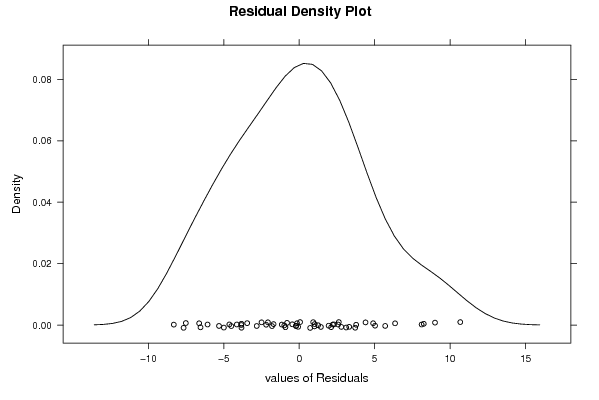
| Multiple Linear Regression - Residual Statistics | |
| Residual Standard Deviation | 5.18760048847671 |
| Sum Squared Residuals | 1076.44795312175 |
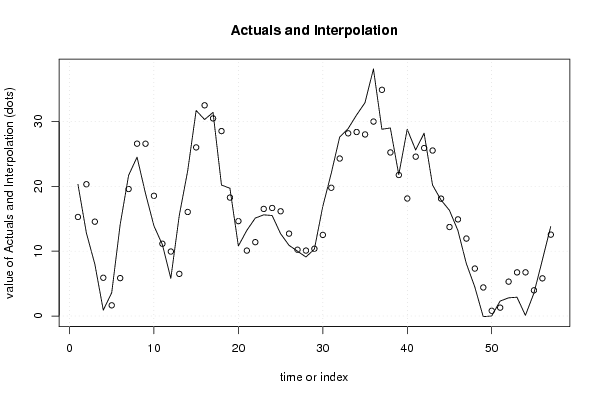
| Multiple Linear Regression - Actuals, Interpolation, and Residuals | |||
| Time or Index | Actuals | Interpolation Forecast | Residuals Prediction Error |
| 1 | 20.3 | 15.2708601459521 | 5.0291398540479 |
| 2 | 12.8 | 20.3185369022278 | -7.51853690222775 |
| 3 | 8 | 14.5457730495929 | -6.54577304959294 |
| 4 | 0.9 | 5.8971762091086 | -4.9971762091086 |
| 5 | 3.6 | 1.64876371636601 | 1.95123628363399 |
| 6 | 14.1 | 5.84263102030894 | 8.25736897969105 |
| 7 | 21.7 | 19.5807857320310 | 2.11921426796903 |
| 8 | 24.5 | 26.5763198139180 | -2.07631981391795 |
| 9 | 18.9 | 26.5682637395198 | -7.66826373951976 |
| 10 | 13.9 | 18.5343797318297 | -4.63437973182968 |
| 11 | 11 | 11.1449671417302 | -0.144967141730218 |
| 12 | 5.8 | 9.94143425961047 | -4.14143425961047 |
| 13 | 15.5 | 6.49607044843643 | 9.00392955156357 |
| 14 | 22.4 | 16.0446764856608 | 6.3553235143392 |
| 15 | 31.7 | 26.0007739795193 | 5.69922602048065 |
| 16 | 30.3 | 32.4927994388465 | -2.19279943884652 |
| 17 | 31.4 | 30.4733004602024 | 0.926699539797574 |
| 18 | 20.2 | 28.5172192398622 | -8.31721923986218 |
| 19 | 19.7 | 18.2638269634388 | 1.43617303656117 |
| 20 | 10.8 | 14.6303150298127 | -3.83031502981268 |
| 21 | 13.2 | 10.0865616019972 | 3.11343839800283 |
| 22 | 15.1 | 11.3885636296174 | 3.71143637038260 |
| 23 | 15.6 | 16.5155728665759 | -0.915572866575938 |
| 24 | 15.5 | 16.6571509990182 | -1.15715099901824 |
| 25 | 12.7 | 16.1512313700762 | -3.45123137007623 |
| 26 | 10.9 | 12.7049824130811 | -1.80498241308110 |
| 27 | 10 | 10.2216872478704 | -0.221687247870438 |
| 28 | 9.1 | 10.0897825279761 | -0.989782527976076 |
| 29 | 10.3 | 10.3734445293143 | -0.0734445293143178 |
| 30 | 16.9 | 12.5038146276851 | 4.39618537231489 |
| 31 | 22 | 19.7760519274614 | 2.22394807253859 |
| 32 | 27.6 | 24.2841123369131 | 3.31588766308688 |
| 33 | 28.9 | 28.1742869945316 | 0.725713005468367 |
| 34 | 31 | 28.3749492853152 | 2.62505071468475 |
| 35 | 32.9 | 27.9985537090286 | 4.90144629097136 |
| 36 | 38.1 | 29.9842813098509 | 8.11571869014908 |
| 37 | 28.8 | 34.8794255409795 | -6.0794255409795 |
| 38 | 29 | 25.224166820328 | 3.77583317967199 |
| 39 | 21.8 | 21.7442147630654 | 0.0557852369346515 |
| 40 | 28.8 | 18.1208797338294 | 10.6791202661706 |
| 41 | 25.6 | 24.5737645713662 | 1.02623542863384 |
| 42 | 28.2 | 25.9009407849671 | 2.29905921503288 |
| 43 | 20.2 | 25.5192018332702 | -5.31920183327018 |
| 44 | 17.9 | 18.0989315992544 | -0.198931599254356 |
| 45 | 16.3 | 13.7239114495626 | 2.57608855043742 |
| 46 | 13.2 | 14.9021073532377 | -1.70210735323766 |
| 47 | 8.1 | 11.9409062826652 | -3.8409062826652 |
| 48 | 4.5 | 7.3171334315204 | -2.81713343152039 |
| 49 | -0.1 | 4.40241249455575 | -4.50241249455575 |
| 50 | 0 | 0.80763737870233 | -0.80763737870233 |
| 51 | 2.3 | 1.28755095995193 | 1.01244904004807 |
| 52 | 2.8 | 5.29936209023939 | -2.49936209023940 |
| 53 | 2.9 | 6.73072672275109 | -3.83072672275109 |
| 54 | 0.1 | 6.73539432717664 | -6.63539432717664 |
| 55 | 3.5 | 3.96013354379861 | -0.460133543798610 |
| 56 | 8.6 | 5.81032122010188 | 2.78967877989812 |
| 57 | 13.8 | 12.5469762143888 | 1.25302378561116 |
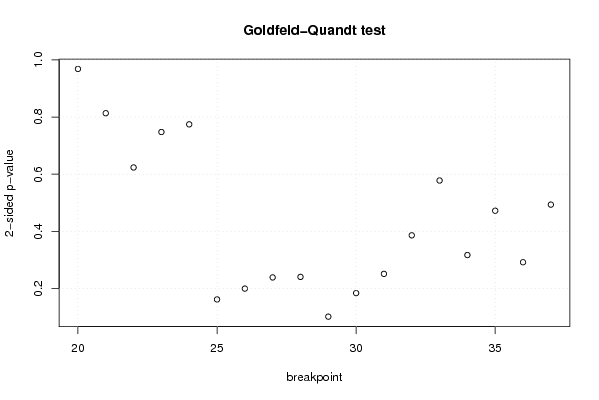
| Goldfeld-Quandt test for Heteroskedasticity | |||
| p-values | Alternative Hypothesis | ||
| breakpoint index | greater | 2-sided | less |
| 20 | 0.484179905285782 | 0.968359810571564 | 0.515820094714218 |
| 21 | 0.406743277817977 | 0.813486555635955 | 0.593256722182023 |
| 22 | 0.31176777280981 | 0.62353554561962 | 0.68823222719019 |
| 23 | 0.626222086499188 | 0.747555827001625 | 0.373777913500812 |
| 24 | 0.612751521969809 | 0.774496956060381 | 0.387248478030191 |
| 25 | 0.9192124125142 | 0.161575174971601 | 0.0807875874858007 |
| 26 | 0.900258895221135 | 0.199482209557731 | 0.0997411047788653 |
| 27 | 0.880673011989075 | 0.238653976021850 | 0.119326988010925 |
| 28 | 0.879737068877782 | 0.240525862244437 | 0.120262931122218 |
| 29 | 0.94930753646021 | 0.101384927079579 | 0.0506924635397893 |
| 30 | 0.90811199081415 | 0.183776018371702 | 0.091888009185851 |
| 31 | 0.874464250578052 | 0.251071498843895 | 0.125535749421948 |
| 32 | 0.806966135671783 | 0.386067728656435 | 0.193033864328218 |
| 33 | 0.711064463603532 | 0.577871072792937 | 0.288935536396468 |
| 34 | 0.841518140392014 | 0.316963719215971 | 0.158481859607986 |
| 35 | 0.763948456876766 | 0.472103086246469 | 0.236051543123234 |
| 36 | 0.85406889398904 | 0.29186221202192 | 0.14593110601096 |
| 37 | 0.753262453180023 | 0.493475093639953 | 0.246737546819977 |
| Meta Analysis of Goldfeld-Quandt test for Heteroskedasticity | |||
| Description | # significant tests | % significant tests | OK/NOK |
| 1% type I error level | 0 | 0 | OK |
| 5% type I error level | 0 | 0 | OK |
| 10% type I error level | 0 | 0 | OK |