| Multiple Linear Regression - Estimated Regression Equation |
| Y[t] = -3.14673253583627 + 0.159273111161314X[t] + 1.19239391388524Y1[t] + 0.0547489071340255Y2[t] -0.846957446955572Y3[t] + 0.51657962018494Y4[t] + 1.18489455307365M1[t] + 0.787703242296826M2[t] + 1.77623608216405M3[t] + 1.99845232381733M4[t] + 2.44382728416817M5[t] + 2.51934153446727M6[t] + 1.65025027547976M7[t] + 1.96425139545177M8[t] + 1.97878859140112M9[t] + 1.43407402510184M10[t] + 1.18187657202455M11[t] + 0.0360920857270811t + e[t] |
| Multiple Linear Regression - Ordinary Least Squares | |||||
| Variable | Parameter | S.D. | T-STAT H0: parameter = 0 | 2-tail p-value | 1-tail p-value |
| (Intercept) | -3.14673253583627 | 5.714127 | -0.5507 | 0.585067 | 0.292534 |
| X | 0.159273111161314 | 0.204092 | 0.7804 | 0.439991 | 0.219996 |
| Y1 | 1.19239391388524 | 0.138054 | 8.6371 | 0 | 0 |
| Y2 | 0.0547489071340255 | 0.190013 | 0.2881 | 0.774812 | 0.387406 |
| Y3 | -0.846957446955572 | 0.18777 | -4.5106 | 6e-05 | 3e-05 |
| Y4 | 0.51657962018494 | 0.143438 | 3.6014 | 0.000903 | 0.000452 |
| M1 | 1.18489455307365 | 3.044019 | 0.3893 | 0.699262 | 0.349631 |
| M2 | 0.787703242296826 | 3.054939 | 0.2578 | 0.797917 | 0.398959 |
| M3 | 1.77623608216405 | 3.13858 | 0.5659 | 0.574764 | 0.287382 |
| M4 | 1.99845232381733 | 3.072049 | 0.6505 | 0.519266 | 0.259633 |
| M5 | 2.44382728416817 | 3.047575 | 0.8019 | 0.427602 | 0.213801 |
| M6 | 2.51934153446727 | 3.0586 | 0.8237 | 0.415255 | 0.207628 |
| M7 | 1.65025027547976 | 3.069212 | 0.5377 | 0.593934 | 0.296967 |
| M8 | 1.96425139545177 | 3.069922 | 0.6398 | 0.526117 | 0.263059 |
| M9 | 1.97878859140112 | 3.215322 | 0.6154 | 0.541943 | 0.270971 |
| M10 | 1.43407402510184 | 3.376825 | 0.4247 | 0.673464 | 0.336732 |
| M11 | 1.18187657202455 | 3.206876 | 0.3685 | 0.714513 | 0.357256 |
| t | 0.0360920857270811 | 0.075509 | 0.478 | 0.635398 | 0.317699 |
| Multiple Linear Regression - Regression Statistics | |
| Multiple R | 0.92674741174573 |
| R-squared | 0.858860765177409 |
| Adjusted R-squared | 0.79571952854625 |
| F-TEST (value) | 13.6022164119855 |
| F-TEST (DF numerator) | 17 |
| F-TEST (DF denominator) | 38 |
| p-value | 2.89758217419944e-11 |
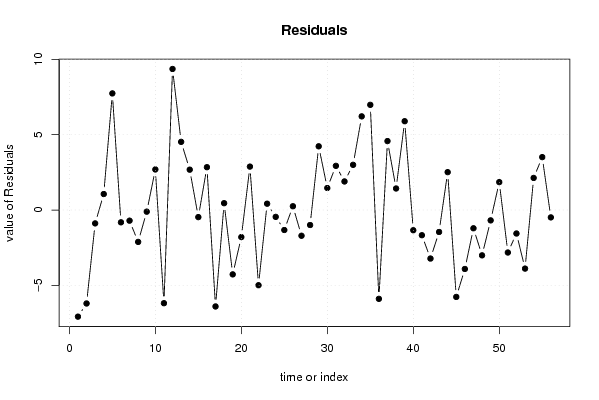
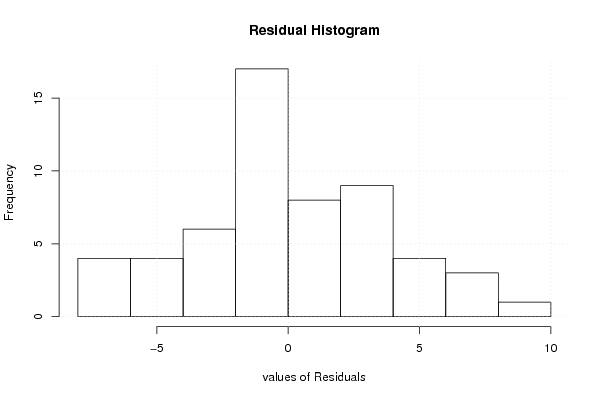
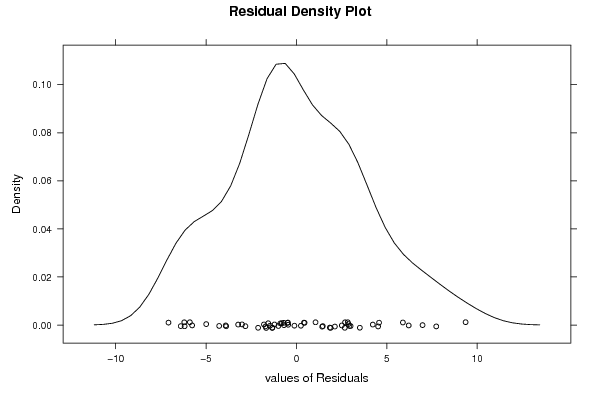
| Multiple Linear Regression - Residual Statistics | |
| Residual Standard Deviation | 4.52155480976008 |
| Sum Squared Residuals | 776.889400111252 |
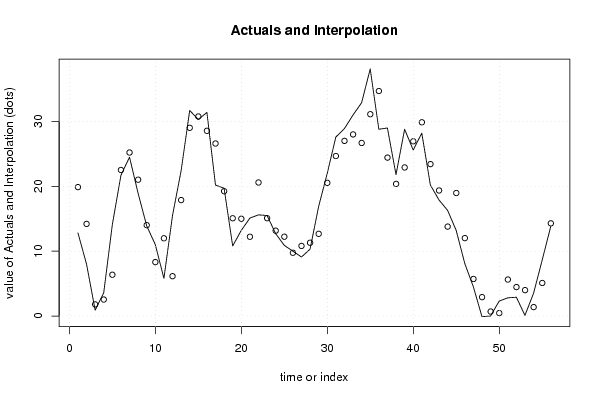
| Multiple Linear Regression - Actuals, Interpolation, and Residuals | |||
| Time or Index | Actuals | Interpolation Forecast | Residuals Prediction Error |
| 1 | 12.8 | 19.8774889828420 | -7.07748898284196 |
| 2 | 8 | 14.2031237507828 | -6.20312375078278 |
| 3 | 0.9 | 1.78879416237584 | -0.888794162375841 |
| 4 | 3.6 | 2.54184154660096 | 1.05815845339904 |
| 5 | 14.1 | 6.36364973583978 | 7.73635026416022 |
| 6 | 21.7 | 22.5177568022584 | -0.81775680225839 |
| 7 | 24.5 | 25.2080413781786 | -0.708041378178616 |
| 8 | 18.9 | 21.0182754626342 | -2.11827546263423 |
| 9 | 13.9 | 14.0098245150921 | -0.109824515092060 |
| 10 | 11 | 8.30934351358911 | 2.69065648641089 |
| 11 | 5.8 | 11.9843939002224 | -6.18439390022245 |
| 12 | 15.5 | 6.13987681509788 | 9.36012318490212 |
| 13 | 22.4 | 17.8785761520897 | 4.5214238479103 |
| 14 | 31.7 | 29.0228840465195 | 2.6771159534805 |
| 15 | 30.3 | 30.7721116812019 | -0.472111681201894 |
| 16 | 31.4 | 28.5592299638059 | 2.84077003619412 |
| 17 | 20.2 | 26.6004694124044 | -6.40046941240445 |
| 18 | 19.7 | 19.2481454930598 | 0.451854506940208 |
| 19 | 10.8 | 15.0730776095617 | -4.27307760956167 |
| 20 | 13.2 | 14.9969246273823 | -1.79692462738228 |
| 21 | 15.1 | 12.2190941174582 | 2.88090588254176 |
| 22 | 15.6 | 20.5906833623952 | -4.9906833623952 |
| 23 | 15.5 | 15.0816338278482 | 0.418366172151823 |
| 24 | 12.7 | 13.1560101206348 | -0.45601012063484 |
| 25 | 10.9 | 12.2279339093623 | -1.32793390936235 |
| 26 | 10 | 9.75094114297062 | 0.249058857029382 |
| 27 | 9.1 | 10.8087746245549 | -1.70877462455487 |
| 28 | 10.3 | 11.2969397703106 | -0.9969397703106 |
| 29 | 16.9 | 12.6738776602347 | 4.22612233976531 |
| 30 | 22 | 20.5405032270739 | 1.45949677292609 |
| 31 | 27.6 | 24.6687852071996 | 2.93121479280037 |
| 32 | 28.9 | 27.0054801513548 | 1.89451984864525 |
| 33 | 31 | 28.0027579147797 | 2.99724208522027 |
| 34 | 32.9 | 26.6867457033422 | 6.21325429665776 |
| 35 | 38.1 | 31.1207820028328 | 6.9792179971672 |
| 36 | 28.8 | 34.694592326443 | -5.894592326443 |
| 37 | 29 | 24.4273348252194 | 4.57266517478059 |
| 38 | 21.8 | 20.3728721007827 | 1.42712789921731 |
| 39 | 28.8 | 22.9083095759946 | 5.89169042400536 |
| 40 | 25.6 | 26.9419667679022 | -1.34196676790221 |
| 41 | 28.2 | 29.87387895928 | -1.67387895928003 |
| 42 | 20.2 | 23.4217106857197 | -3.22171068571968 |
| 43 | 17.9 | 19.3589554203169 | -1.4589554203169 |
| 44 | 16.3 | 13.7883189984606 | 2.51168100153937 |
| 45 | 13.2 | 18.9683234526700 | -5.76832345266998 |
| 46 | 8.1 | 12.0132274206734 | -3.91322742067344 |
| 47 | 4.5 | 5.71319026909658 | -1.21319026909658 |
| 48 | -0.1 | 2.90952073782429 | -3.00952073782429 |
| 49 | 0 | 0.688666130486581 | -0.688666130486581 |
| 50 | 2.3 | 0.4501789589444 | 1.8498210410556 |
| 51 | 2.8 | 5.62200995587275 | -2.82200995587275 |
| 52 | 2.9 | 4.46002195138034 | -1.56002195138034 |
| 53 | 0.1 | 3.98812423224105 | -3.88812423224105 |
| 54 | 3.5 | 1.37188379188822 | 2.12811620811178 |
| 55 | 8.6 | 5.09114038474318 | 3.50885961525682 |
| 56 | 13.8 | 14.2910007601681 | -0.491000760168099 |
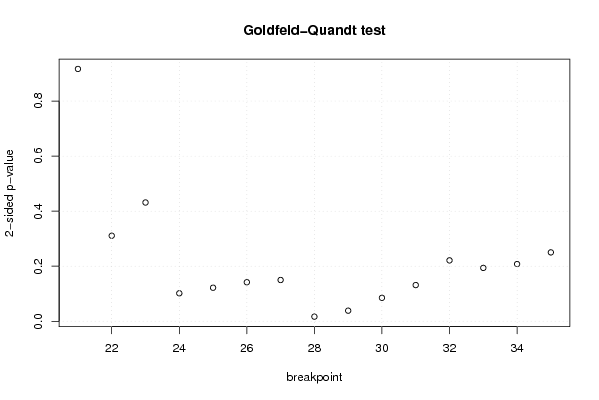
| Goldfeld-Quandt test for Heteroskedasticity | |||
| p-values | Alternative Hypothesis | ||
| breakpoint index | greater | 2-sided | less |
| 21 | 0.458371295529067 | 0.916742591058135 | 0.541628704470933 |
| 22 | 0.84455182567338 | 0.310896348653240 | 0.155448174326620 |
| 23 | 0.784215001147905 | 0.43156999770419 | 0.215784998852095 |
| 24 | 0.949137749583338 | 0.101724500833324 | 0.0508622504166618 |
| 25 | 0.939026004144066 | 0.121947991711868 | 0.060973995855934 |
| 26 | 0.929057403473308 | 0.141885193053385 | 0.0709425965266925 |
| 27 | 0.924993611196012 | 0.150012777607976 | 0.0750063888039879 |
| 28 | 0.991568167727073 | 0.0168636645458544 | 0.00843183227292722 |
| 29 | 0.980705718409128 | 0.0385885631817441 | 0.0192942815908721 |
| 30 | 0.957380372211167 | 0.085239255577666 | 0.042619627788833 |
| 31 | 0.934219080513254 | 0.131561838973492 | 0.0657809194867459 |
| 32 | 0.889307674284809 | 0.221384651430382 | 0.110692325715191 |
| 33 | 0.90302896528495 | 0.193942069430102 | 0.0969710347150508 |
| 34 | 0.896018662492057 | 0.207962675015886 | 0.103981337507943 |
| 35 | 0.874825637299067 | 0.250348725401867 | 0.125174362700933 |
| Meta Analysis of Goldfeld-Quandt test for Heteroskedasticity | |||
| Description | # significant tests | % significant tests | OK/NOK |
| 1% type I error level | 0 | 0 | OK |
| 5% type I error level | 2 | 0.133333333333333 | NOK |
| 10% type I error level | 3 | 0.2 | NOK |