| Multiple Linear Regression - Estimated Regression Equation |
| TIA[t] = + 49.3851818122445 + 0.328226028431917IAidM[t] -0.0569153192027402`TIA(t-1)`[t] + 0.0550408037582717`TIA(t-2)`[t] + 0.315315051430443`TIA(t-3)`[t] -0.159716545463239`TIA(t-4)`[t] + 1.07935611922313M1[t] + 5.04024362561899M2[t] + 12.9910144316273M3[t] + 7.48173555248839M4[t] + 5.69904974515526M5[t] + 10.7442308754480M6[t] -5.15002616864018M7[t] + 2.4269950608123M8[t] + 10.1458174187584M9[t] + 19.4896364076166M10[t] + 7.43512929557958M11[t] + 0.0224084944263686t + e[t] |
| Multiple Linear Regression - Ordinary Least Squares | |||||
| Variable | Parameter | S.D. | T-STAT H0: parameter = 0 | 2-tail p-value | 1-tail p-value |
| (Intercept) | 49.3851818122445 | 34.912994 | 1.4145 | 0.16458 | 0.08229 |
| IAidM | 0.328226028431917 | 0.091988 | 3.5681 | 0.000915 | 0.000458 |
| `TIA(t-1)` | -0.0569153192027402 | 0.146032 | -0.3897 | 0.698695 | 0.349347 |
| `TIA(t-2)` | 0.0550408037582717 | 0.160799 | 0.3423 | 0.733835 | 0.366918 |
| `TIA(t-3)` | 0.315315051430443 | 0.174454 | 1.8074 | 0.07786 | 0.03893 |
| `TIA(t-4)` | -0.159716545463239 | 0.168604 | -0.9473 | 0.348911 | 0.174456 |
| M1 | 1.07935611922313 | 4.004491 | 0.2695 | 0.788837 | 0.394418 |
| M2 | 5.04024362561899 | 4.504958 | 1.1188 | 0.269575 | 0.134787 |
| M3 | 12.9910144316273 | 5.105735 | 2.5444 | 0.014712 | 0.007356 |
| M4 | 7.48173555248839 | 4.445992 | 1.6828 | 0.099834 | 0.049917 |
| M5 | 5.69904974515526 | 3.365714 | 1.6933 | 0.097811 | 0.048905 |
| M6 | 10.7442308754480 | 3.410141 | 3.1507 | 0.003 | 0.0015 |
| M7 | -5.15002616864018 | 3.331084 | -1.5461 | 0.129595 | 0.064797 |
| M8 | 2.4269950608123 | 4.135388 | 0.5869 | 0.560423 | 0.280211 |
| M9 | 10.1458174187584 | 5.901105 | 1.7193 | 0.092921 | 0.046461 |
| M10 | 19.4896364076166 | 6.832734 | 2.8524 | 0.006705 | 0.003352 |
| M11 | 7.43512929557958 | 5.026506 | 1.4792 | 0.146553 | 0.073276 |
| t | 0.0224084944263686 | 0.067817 | 0.3304 | 0.742721 | 0.371361 |
| Multiple Linear Regression - Regression Statistics | |
| Multiple R | 0.94203267354235 |
| R-squared | 0.887425558021349 |
| Adjusted R-squared | 0.841859712458562 |
| F-TEST (value) | 19.4756740945041 |
| F-TEST (DF numerator) | 17 |
| F-TEST (DF denominator) | 42 |
| p-value | 1.17683640610267e-14 |
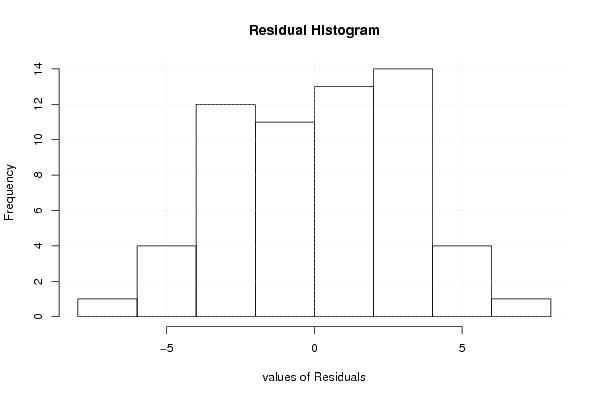
| Multiple Linear Regression - Residual Statistics | |
| Residual Standard Deviation | 3.57889345058774 |
| Sum Squared Residuals | 537.956089887712 |
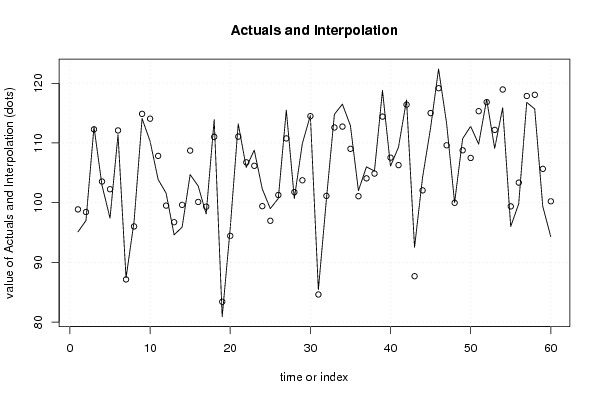
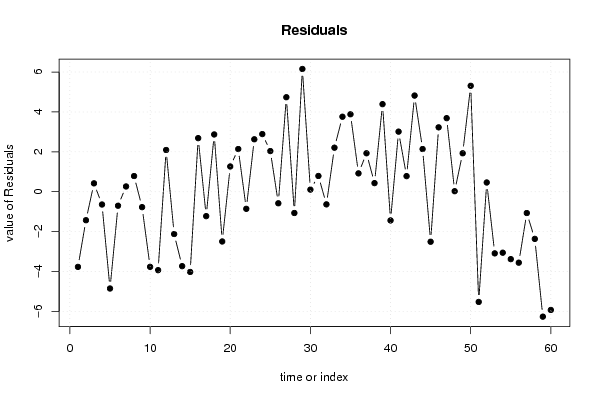
| Multiple Linear Regression - Actuals, Interpolation, and Residuals | |||
| Time or Index | Actuals | Interpolation Forecast | Residuals Prediction Error |
| 1 | 95.1 | 98.8702912655445 | -3.77029126554452 |
| 2 | 97 | 98.4283768644238 | -1.4283768644238 |
| 3 | 112.7 | 112.280113962106 | 0.41988603789447 |
| 4 | 102.9 | 103.541909840113 | -0.641909840112737 |
| 5 | 97.4 | 102.252065894731 | -4.85206589473064 |
| 6 | 111.4 | 112.101323400587 | -0.701323400586641 |
| 7 | 87.4 | 87.1362486860718 | 0.263751313928171 |
| 8 | 96.8 | 96.0139320263975 | 0.786067973602462 |
| 9 | 114.1 | 114.872520373447 | -0.772520373446601 |
| 10 | 110.3 | 114.066371327565 | -3.76637132756515 |
| 11 | 103.9 | 107.833623614856 | -3.93362361485621 |
| 12 | 101.6 | 99.507762429703 | 2.09223757029699 |
| 13 | 94.6 | 96.7222811271049 | -2.12228112710488 |
| 14 | 95.9 | 99.6319422629941 | -3.73194226299409 |
| 15 | 104.7 | 108.722888805716 | -4.02288880571649 |
| 16 | 102.8 | 100.113471677535 | 2.68652832246503 |
| 17 | 98.1 | 99.3248268297767 | -1.22482682977674 |
| 18 | 113.9 | 111.028371609433 | 2.87162839056653 |
| 19 | 80.9 | 83.394443095994 | -2.49444309599395 |
| 20 | 95.7 | 94.434092109663 | 1.26590789033707 |
| 21 | 113.2 | 111.058875993335 | 2.14112400666497 |
| 22 | 105.9 | 106.756786922336 | -0.856786922336051 |
| 23 | 108.8 | 106.171983373505 | 2.62801662649468 |
| 24 | 102.3 | 99.4100852386573 | 2.88991476134270 |
| 25 | 99 | 96.9620790251136 | 2.03792097488638 |
| 26 | 100.7 | 101.280289849433 | -0.580289849432837 |
| 27 | 115.5 | 110.762113611137 | 4.7378863888626 |
| 28 | 100.7 | 101.766985105576 | -1.06698510557587 |
| 29 | 109.9 | 103.744259288091 | 6.15574071190854 |
| 30 | 114.6 | 114.494576941861 | 0.105423058138700 |
| 31 | 85.4 | 84.610161526994 | 0.789838473005926 |
| 32 | 100.5 | 101.134511645962 | -0.634511645961985 |
| 33 | 114.8 | 112.592367566613 | 2.20763243338713 |
| 34 | 116.5 | 112.740052119152 | 3.75994788084775 |
| 35 | 112.9 | 109.018018200391 | 3.88198179960910 |
| 36 | 102 | 101.079835660673 | 0.920164339327007 |
| 37 | 106 | 104.072534426043 | 1.92746557395719 |
| 38 | 105.3 | 104.869716594199 | 0.430283405800751 |
| 39 | 118.8 | 114.40941589727 | 4.3905841027299 |
| 40 | 106.1 | 107.540166982053 | -1.44016698205297 |
| 41 | 109.3 | 106.287710547374 | 3.01228945262617 |
| 42 | 117.2 | 116.418192655523 | 0.781807344477457 |
| 43 | 92.5 | 87.6789389819997 | 4.82106101800034 |
| 44 | 104.2 | 102.060118696742 | 2.13988130325779 |
| 45 | 112.5 | 115.007444877342 | -2.50744487734211 |
| 46 | 122.4 | 119.171341654162 | 3.22865834583831 |
| 47 | 113.3 | 109.612123984464 | 3.68787601553581 |
| 48 | 100 | 99.973487740503 | 0.0265122594969877 |
| 49 | 110.7 | 108.772814156194 | 1.92718584380584 |
| 50 | 112.8 | 107.48967442895 | 5.31032557104998 |
| 51 | 109.8 | 115.325467723770 | -5.52546772377049 |
| 52 | 117.3 | 116.837466394723 | 0.462533605276545 |
| 53 | 109.1 | 112.191137440027 | -3.09113744002732 |
| 54 | 115.9 | 118.957535392596 | -3.05753539259604 |
| 55 | 96 | 99.3802077089405 | -3.38020770894048 |
| 56 | 99.8 | 103.357345521235 | -3.55734552123534 |
| 57 | 116.8 | 117.868791189263 | -1.06879118926339 |
| 58 | 115.7 | 118.065447976785 | -2.36544797678486 |
| 59 | 99.4 | 105.664250826783 | -6.26425082678338 |
| 60 | 94.3 | 100.228828930464 | -5.92882893046369 |
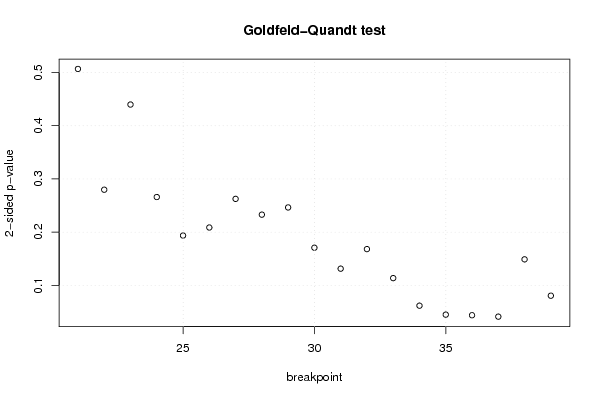
| Goldfeld-Quandt test for Heteroskedasticity | |||
| p-values | Alternative Hypothesis | ||
| breakpoint index | greater | 2-sided | less |
| 21 | 0.25336744939811 | 0.50673489879622 | 0.74663255060189 |
| 22 | 0.139869474815040 | 0.279738949630080 | 0.86013052518496 |
| 23 | 0.219910885490772 | 0.439821770981545 | 0.780089114509228 |
| 24 | 0.132971905185575 | 0.265943810371149 | 0.867028094814425 |
| 25 | 0.0967922759389224 | 0.193584551877845 | 0.903207724061078 |
| 26 | 0.104342634952460 | 0.208685269904921 | 0.89565736504754 |
| 27 | 0.131256812828266 | 0.262513625656532 | 0.868743187171734 |
| 28 | 0.116413776013051 | 0.232827552026101 | 0.88358622398695 |
| 29 | 0.123201673994415 | 0.24640334798883 | 0.876798326005585 |
| 30 | 0.085344244058933 | 0.170688488117866 | 0.914655755941067 |
| 31 | 0.0656565757911339 | 0.131313151582268 | 0.934343424208866 |
| 32 | 0.0840582787059347 | 0.168116557411869 | 0.915941721294065 |
| 33 | 0.0567722464778919 | 0.113544492955784 | 0.943227753522108 |
| 34 | 0.0308638752619234 | 0.0617277505238468 | 0.969136124738077 |
| 35 | 0.0224511424481125 | 0.044902284896225 | 0.977548857551887 |
| 36 | 0.0218944192770318 | 0.0437888385540636 | 0.978105580722968 |
| 37 | 0.020557612429238 | 0.041115224858476 | 0.979442387570762 |
| 38 | 0.0744231257863276 | 0.148846251572655 | 0.925576874213672 |
| 39 | 0.0402451351879862 | 0.0804902703759725 | 0.959754864812014 |
| Meta Analysis of Goldfeld-Quandt test for Heteroskedasticity | |||
| Description | # significant tests | % significant tests | OK/NOK |
| 1% type I error level | 0 | 0 | OK |
| 5% type I error level | 3 | 0.157894736842105 | NOK |
| 10% type I error level | 5 | 0.263157894736842 | NOK |