| Multiple Linear Regression - Estimated Regression Equation |
| wkl[t] = -4.01215883998919 -0.000280109648396460bvg[t] + 1.15480150856078Y1[t] -0.157907674857242Y2[t] + 11.448070491494M1[t] + 7.6106411436112M2[t] + 2.9987316791792M3[t] + 0.957862399611235M4[t] + 3.20446919765004M5[t] + 0.0296764049751569M6[t] + 6.26354126481267M7[t] + 24.8896853724151M8[t] + 2.59965723779642M9[t] -4.93086736514187M10[t] -1.81164970260289M11[t] + 0.0415408990311207t + e[t] |
| Multiple Linear Regression - Ordinary Least Squares | |||||
| Variable | Parameter | S.D. | T-STAT H0: parameter = 0 | 2-tail p-value | 1-tail p-value |
| (Intercept) | -4.01215883998919 | 20.454621 | -0.1961 | 0.845417 | 0.422709 |
| bvg | -0.000280109648396460 | 0.003006 | -0.0932 | 0.926199 | 0.463099 |
| Y1 | 1.15480150856078 | 0.150984 | 7.6485 | 0 | 0 |
| Y2 | -0.157907674857242 | 0.156917 | -1.0063 | 0.319896 | 0.159948 |
| M1 | 11.448070491494 | 3.431728 | 3.3359 | 0.00176 | 0.00088 |
| M2 | 7.6106411436112 | 4.099468 | 1.8565 | 0.070243 | 0.035121 |
| M3 | 2.9987316791792 | 3.898325 | 0.7692 | 0.445958 | 0.222979 |
| M4 | 0.957862399611235 | 3.567971 | 0.2685 | 0.789628 | 0.394814 |
| M5 | 3.20446919765004 | 3.520117 | 0.9103 | 0.367723 | 0.183862 |
| M6 | 0.0296764049751569 | 3.53216 | 0.0084 | 0.993335 | 0.496668 |
| M7 | 6.26354126481267 | 3.522985 | 1.7779 | 0.082491 | 0.041246 |
| M8 | 24.8896853724151 | 3.739534 | 6.6558 | 0 | 0 |
| M9 | 2.59965723779642 | 5.55097 | 0.4683 | 0.641918 | 0.320959 |
| M10 | -4.93086736514187 | 3.949867 | -1.2484 | 0.218653 | 0.109326 |
| M11 | -1.81164970260289 | 3.481531 | -0.5204 | 0.605482 | 0.302741 |
| t | 0.0415408990311207 | 0.067318 | 0.6171 | 0.540433 | 0.270216 |
| Multiple Linear Regression - Regression Statistics | |
| Multiple R | 0.986330732011576 |
| R-squared | 0.972848312910491 |
| Adjusted R-squared | 0.963376794158337 |
| F-TEST (value) | 102.713021888831 |
| F-TEST (DF numerator) | 15 |
| F-TEST (DF denominator) | 43 |
| p-value | 0 |
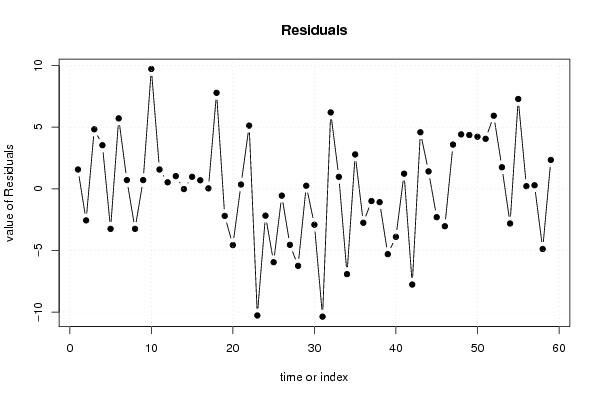
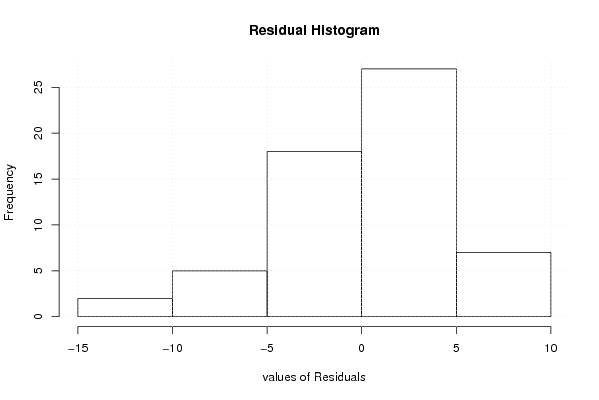
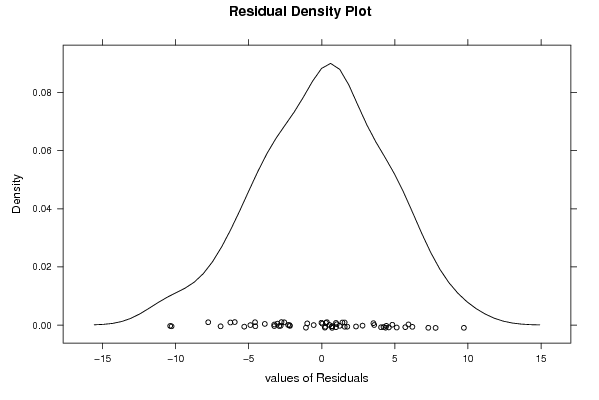
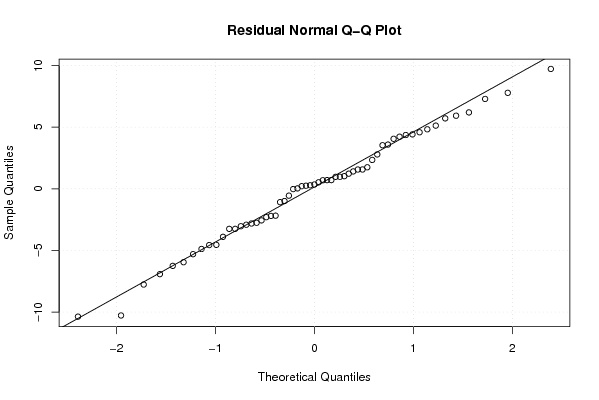
| Multiple Linear Regression - Residual Statistics | |
| Residual Standard Deviation | 5.04826909520104 |
| Sum Squared Residuals | 1095.85589687516 |
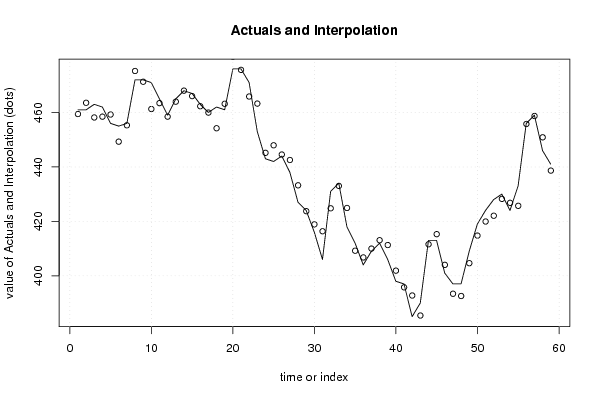
| Multiple Linear Regression - Actuals, Interpolation, and Residuals | |||
| Time or Index | Actuals | Interpolation Forecast | Residuals Prediction Error |
| 1 | 461 | 459.434988119143 | 1.56501188085739 |
| 2 | 461 | 463.563179353837 | -2.56317935383657 |
| 3 | 463 | 458.174495287203 | 4.82550471279691 |
| 4 | 462 | 458.467683235236 | 3.53231676476441 |
| 5 | 456 | 459.249920258332 | -3.24992025833231 |
| 6 | 455 | 449.287504181315 | 5.71249581868537 |
| 7 | 456 | 455.296171235306 | 0.703828764694123 |
| 8 | 472 | 475.250515228057 | -3.25051522805659 |
| 9 | 472 | 471.29545447658 | 0.704545523419844 |
| 10 | 471 | 461.278547426715 | 9.72145257328487 |
| 11 | 465 | 463.437164238101 | 1.56283576189946 |
| 12 | 459 | 458.474635919484 | 0.525364080516317 |
| 13 | 465 | 463.975881566578 | 1.02411843342234 |
| 14 | 468 | 468.022354950778 | -0.0223549507781517 |
| 15 | 467 | 466.027207668783 | 0.972792331217376 |
| 16 | 463 | 462.308879338681 | 0.691120661318806 |
| 17 | 460 | 459.966262339085 | 0.0337376609146295 |
| 18 | 462 | 454.215080719508 | 7.78491928049164 |
| 19 | 461 | 463.202944779026 | -2.20294477902595 |
| 20 | 476 | 480.566117948883 | -4.56611794888338 |
| 21 | 476 | 475.654144876586 | 0.345855123414272 |
| 22 | 471 | 465.875536970668 | 5.12446302933226 |
| 23 | 453 | 463.276573581502 | -10.2765735815022 |
| 24 | 443 | 445.181894591798 | -2.18189459179776 |
| 25 | 442 | 447.955745096803 | -5.95574509680317 |
| 26 | 444 | 444.555560703827 | -0.555560703826707 |
| 27 | 438 | 442.548500330156 | -4.54850033015622 |
| 28 | 427 | 433.252727263587 | -6.25272726358687 |
| 29 | 424 | 423.753852025363 | 0.246147974637118 |
| 30 | 416 | 418.915588801338 | -2.91558880133817 |
| 31 | 406 | 416.3725244638 | -10.3725244638002 |
| 32 | 431 | 424.804194862505 | 6.19580513749513 |
| 33 | 434 | 433.030592177162 | 0.969407822838323 |
| 34 | 418 | 424.923588386627 | -6.92358838662707 |
| 35 | 412 | 409.213070817149 | 2.78692918285082 |
| 36 | 404 | 406.758092006996 | -2.75809200699563 |
| 37 | 409 | 409.995112400008 | -0.995112400008286 |
| 38 | 412 | 413.083833134442 | -1.08383313444235 |
| 39 | 406 | 411.304016005225 | -5.30401600522536 |
| 40 | 398 | 401.898794232971 | -3.89879423297135 |
| 41 | 397 | 395.774968542591 | 1.22503145740878 |
| 42 | 385 | 392.768103556742 | -7.76810355674199 |
| 43 | 390 | 385.416067177025 | 4.5839328229752 |
| 44 | 413 | 411.590188228679 | 1.40981177132079 |
| 45 | 413 | 415.30363209591 | -2.30363209590975 |
| 46 | 401 | 404.038515401362 | -3.03851540136181 |
| 47 | 397 | 393.41364403984 | 3.58635596015953 |
| 48 | 397 | 392.585377481723 | 4.41462251827706 |
| 49 | 409 | 404.638272817468 | 4.36172718253173 |
| 50 | 419 | 414.775071857116 | 4.22492814288378 |
| 51 | 424 | 419.945780708633 | 4.05421929136729 |
| 52 | 428 | 422.071915929525 | 5.928084070475 |
| 53 | 430 | 428.254996834628 | 1.74500316537178 |
| 54 | 424 | 426.813722741097 | -2.81372274109687 |
| 55 | 433 | 425.712292344843 | 7.2877076551568 |
| 56 | 456 | 455.788983731876 | 0.211016268124042 |
| 57 | 459 | 458.716176373763 | 0.283823626237321 |
| 58 | 446 | 450.883811814628 | -4.88381181462826 |
| 59 | 441 | 438.659547323408 | 2.34045267659235 |
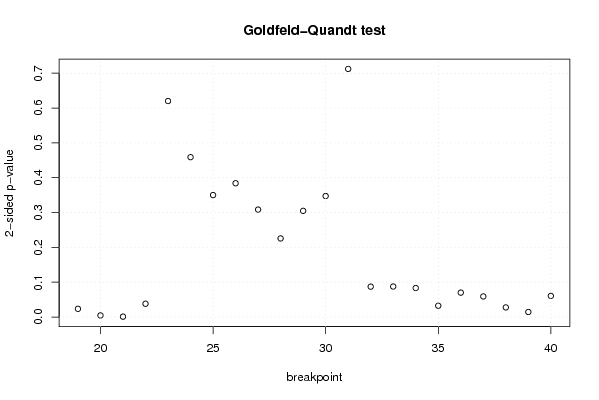
| Goldfeld-Quandt test for Heteroskedasticity | |||
| p-values | Alternative Hypothesis | ||
| breakpoint index | greater | 2-sided | less |
| 19 | 0.0117706822355485 | 0.0235413644710969 | 0.988229317764452 |
| 20 | 0.00226135138533448 | 0.00452270277066896 | 0.997738648614666 |
| 21 | 0.000517123244952553 | 0.00103424648990511 | 0.999482876755047 |
| 22 | 0.0190381692260883 | 0.0380763384521767 | 0.980961830773912 |
| 23 | 0.310082330915587 | 0.620164661831174 | 0.689917669084413 |
| 24 | 0.229476887439123 | 0.458953774878245 | 0.770523112560877 |
| 25 | 0.17508936642015 | 0.3501787328403 | 0.82491063357985 |
| 26 | 0.192054371172327 | 0.384108742344654 | 0.807945628827673 |
| 27 | 0.154229045065239 | 0.308458090130478 | 0.845770954934761 |
| 28 | 0.112840068647842 | 0.225680137295684 | 0.887159931352158 |
| 29 | 0.152415879541353 | 0.304831759082706 | 0.847584120458647 |
| 30 | 0.173681865769602 | 0.347363731539204 | 0.826318134230398 |
| 31 | 0.35616476221701 | 0.71232952443402 | 0.64383523778299 |
| 32 | 0.956407737092184 | 0.0871845258156331 | 0.0435922629078166 |
| 33 | 0.956247098943606 | 0.0875058021127881 | 0.0437529010563940 |
| 34 | 0.958390964811724 | 0.0832180703765518 | 0.0416090351882759 |
| 35 | 0.983807158870345 | 0.0323856822593108 | 0.0161928411296554 |
| 36 | 0.965001054822588 | 0.0699978903548239 | 0.0349989451774120 |
| 37 | 0.970461333219701 | 0.0590773335605973 | 0.0295386667802987 |
| 38 | 0.98624742175923 | 0.0275051564815399 | 0.0137525782407699 |
| 39 | 0.992765328746094 | 0.0144693425078121 | 0.00723467125390604 |
| 40 | 0.969693894140539 | 0.060612211718922 | 0.030306105859461 |
| Meta Analysis of Goldfeld-Quandt test for Heteroskedasticity | |||
| Description | # significant tests | % significant tests | OK/NOK |
| 1% type I error level | 2 | 0.090909090909091 | NOK |
| 5% type I error level | 7 | 0.318181818181818 | NOK |
| 10% type I error level | 13 | 0.590909090909091 | NOK |