| Multiple Linear Regression - Estimated Regression Equation |
| Y[t] = + 74.8461699959766 + 2.19376705976759X[t] + 0.583817180808853Y1[t] -0.784569819676212Y2[t] -10.6853024858533M1[t] -16.6925710430407M2[t] -10.2731451518584M3[t] -12.6971781321019M4[t] + 2.54561934032703M5[t] + 54.8658399069361M6[t] -12.0357994812021M7[t] -66.5419062293564M8[t] -60.0192868381692M9[t] -40.3833766595293M10[t] -10.1516715402114M11[t] + 0.150462479682088t + e[t] |
| Multiple Linear Regression - Ordinary Least Squares | |||||
| Variable | Parameter | S.D. | T-STAT H0: parameter = 0 | 2-tail p-value | 1-tail p-value |
| (Intercept) | 74.8461699959766 | 30.351477 | 2.466 | 0.017937 | 0.008968 |
| X | 2.19376705976759 | 0.332196 | 6.6038 | 0 | 0 |
| Y1 | 0.583817180808853 | 0.145715 | 4.0066 | 0.000253 | 0.000127 |
| Y2 | -0.784569819676212 | 0.422976 | -1.8549 | 0.070814 | 0.035407 |
| M1 | -10.6853024858533 | 6.26046 | -1.7068 | 0.095425 | 0.047713 |
| M2 | -16.6925710430407 | 7.232645 | -2.3079 | 0.026123 | 0.013061 |
| M3 | -10.2731451518584 | 7.597654 | -1.3521 | 0.18374 | 0.09187 |
| M4 | -12.6971781321019 | 7.727253 | -1.6432 | 0.107996 | 0.053998 |
| M5 | 2.54561934032703 | 9.167188 | 0.2777 | 0.782647 | 0.391324 |
| M6 | 54.8658399069361 | 8.582989 | 6.3924 | 0 | 0 |
| M7 | -12.0357994812021 | 13.813277 | -0.8713 | 0.388653 | 0.194326 |
| M8 | -66.5419062293564 | 17.098992 | -3.8916 | 0.000359 | 0.000179 |
| M9 | -60.0192868381692 | 6.978926 | -8.6001 | 0 | 0 |
| M10 | -40.3833766595293 | 5.812018 | -6.9483 | 0 | 0 |
| M11 | -10.1516715402114 | 6.160731 | -1.6478 | 0.107037 | 0.053518 |
| t | 0.150462479682088 | 0.110129 | 1.3662 | 0.179311 | 0.089656 |
| Multiple Linear Regression - Regression Statistics | |
| Multiple R | 0.987071748987967 |
| R-squared | 0.974310637650165 |
| Adjusted R-squared | 0.964912090449005 |
| F-TEST (value) | 103.666089747359 |
| F-TEST (DF numerator) | 15 |
| F-TEST (DF denominator) | 41 |
| p-value | 0 |
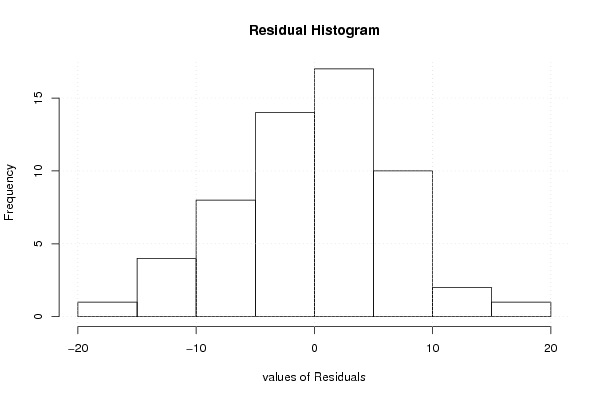
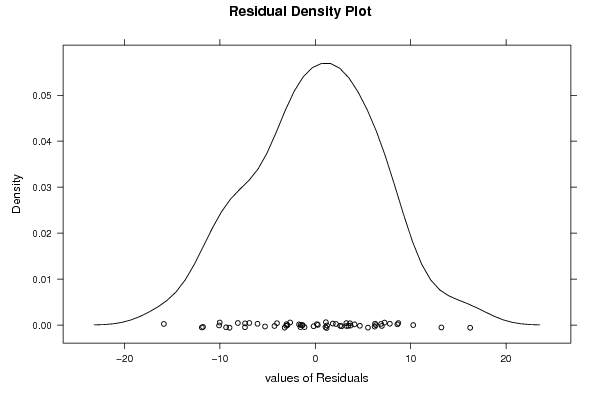
| Multiple Linear Regression - Residual Statistics | |
| Residual Standard Deviation | 7.7464999763229 |
| Sum Squared Residuals | 2460.33873720999 |
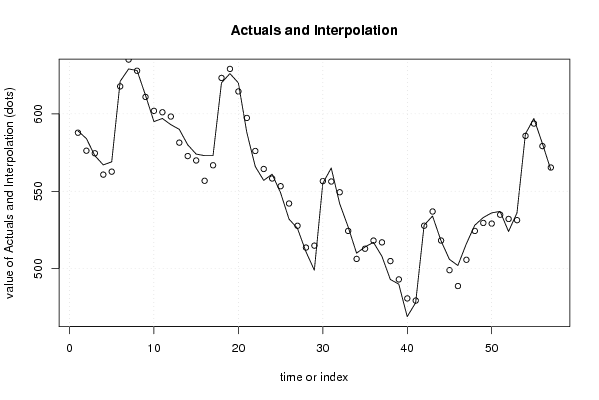
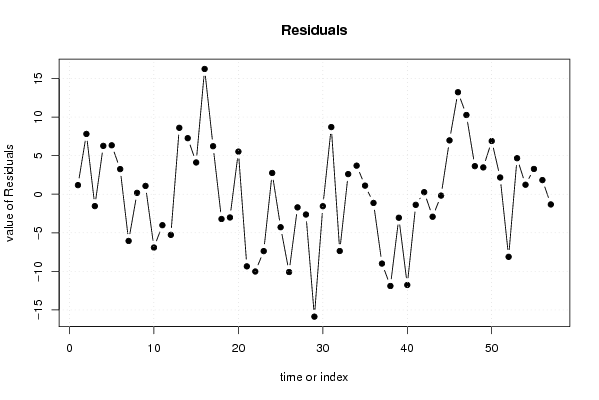
| Multiple Linear Regression - Actuals, Interpolation, and Residuals | |||
| Time or Index | Actuals | Interpolation Forecast | Residuals Prediction Error |
| 1 | 589 | 587.817065405867 | 1.18293459413330 |
| 2 | 584 | 576.181968704528 | 7.8180312954722 |
| 3 | 573 | 574.538236513318 | -1.53823651331768 |
| 4 | 567 | 560.730454268903 | 6.26954573109736 |
| 5 | 569 | 562.655739031659 | 6.34426096834063 |
| 6 | 621 | 617.740135151246 | 3.25986484875400 |
| 7 | 629 | 635.055055854422 | -6.05505585442201 |
| 8 | 628 | 627.823471646475 | 0.176528353525246 |
| 9 | 612 | 610.922577455471 | 1.07742254452880 |
| 10 | 595 | 601.910903777899 | -6.91090377789872 |
| 11 | 597 | 601.014325886281 | -4.01432588628114 |
| 12 | 593 | 598.268430730348 | -5.26843073034825 |
| 13 | 590 | 581.390553864184 | 8.60944613581628 |
| 14 | 580 | 572.733794042289 | 7.26620595771116 |
| 15 | 574 | 569.881617249855 | 4.11838275014532 |
| 16 | 573 | 556.757713401254 | 16.2422865987457 |
| 17 | 573 | 566.774188007267 | 6.22581199273327 |
| 18 | 620 | 623.208530391545 | -3.20853039154525 |
| 19 | 626 | 629.01160885468 | -3.01160885468073 |
| 20 | 620 | 614.473404623154 | 5.52659537684597 |
| 21 | 588 | 597.34938828947 | -9.34938828946997 |
| 22 | 566 | 576.018933048368 | -10.0189330483677 |
| 23 | 557 | 564.372083023717 | -7.37208302371713 |
| 24 | 561 | 558.242416942586 | 2.75758305741416 |
| 25 | 549 | 553.277257385341 | -4.27725738534084 |
| 26 | 532 | 542.085106410199 | -10.0851064101989 |
| 27 | 526 | 527.702016433075 | -1.70201643307534 |
| 28 | 511 | 513.629671597518 | -2.62967159751786 |
| 29 | 499 | 514.87107796446 | -15.8710779644599 |
| 30 | 555 | 556.550678638112 | -1.55067863811170 |
| 31 | 565 | 556.292463150478 | 8.70753684952182 |
| 32 | 542 | 549.36232300526 | -7.36232300525979 |
| 33 | 527 | 524.389309915649 | 2.61069008435057 |
| 34 | 510 | 506.296564959402 | 3.7034350405978 |
| 35 | 514 | 512.884990226418 | 1.11500977358164 |
| 36 | 517 | 518.12959348988 | -1.12959348987961 |
| 37 | 508 | 516.99115058403 | -8.9911505840297 |
| 38 | 493 | 504.895297629557 | -11.8952976295568 |
| 39 | 490 | 493.048229014536 | -3.04822901453604 |
| 40 | 469 | 480.768145961011 | -11.7681459610114 |
| 41 | 478 | 479.373469750845 | -1.37346975084486 |
| 42 | 528 | 527.734432818805 | 0.265567181194724 |
| 43 | 534 | 536.917983647975 | -2.91798364797492 |
| 44 | 518 | 518.174557199987 | -0.174557199987186 |
| 45 | 506 | 499.016716205797 | 6.98328379420343 |
| 46 | 502 | 488.773598214331 | 13.2264017856686 |
| 47 | 516 | 505.728600863583 | 10.2713991364166 |
| 48 | 528 | 524.359558837186 | 3.6404411628137 |
| 49 | 533 | 529.523972760579 | 3.47602723942096 |
| 50 | 536 | 529.103833213428 | 6.89616678657241 |
| 51 | 537 | 534.829900789216 | 2.17009921078374 |
| 52 | 524 | 532.114014771314 | -8.11401477131376 |
| 53 | 536 | 531.325525245769 | 4.67447475423087 |
| 54 | 587 | 585.766223000292 | 1.23377699970823 |
| 55 | 597 | 593.722888492444 | 3.27711150755584 |
| 56 | 581 | 579.166243525124 | 1.83375647487575 |
| 57 | 564 | 565.322008133613 | -1.32200813361284 |
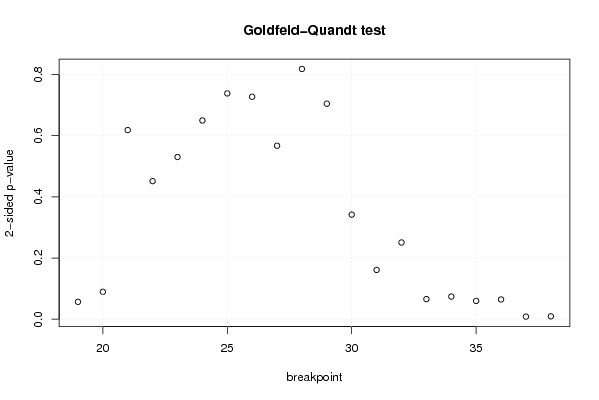
| Goldfeld-Quandt test for Heteroskedasticity | |||
| p-values | Alternative Hypothesis | ||
| breakpoint index | greater | 2-sided | less |
| 19 | 0.0283768931458563 | 0.0567537862917125 | 0.971623106854144 |
| 20 | 0.0447921881496406 | 0.0895843762992813 | 0.95520781185036 |
| 21 | 0.309170099783677 | 0.618340199567354 | 0.690829900216323 |
| 22 | 0.225628221591002 | 0.451256443182004 | 0.774371778408998 |
| 23 | 0.265094039874138 | 0.530188079748275 | 0.734905960125862 |
| 24 | 0.324804866514263 | 0.649609733028526 | 0.675195133485737 |
| 25 | 0.369114569877968 | 0.738229139755936 | 0.630885430122032 |
| 26 | 0.363631817449975 | 0.72726363489995 | 0.636368182550025 |
| 27 | 0.283578874742693 | 0.567157749485386 | 0.716421125257307 |
| 28 | 0.40908881612458 | 0.81817763224916 | 0.59091118387542 |
| 29 | 0.647702336948023 | 0.704595326103953 | 0.352297663051977 |
| 30 | 0.829046626176074 | 0.341906747647852 | 0.170953373823926 |
| 31 | 0.919483447029695 | 0.161033105940611 | 0.0805165529703053 |
| 32 | 0.87464226715627 | 0.250715465687459 | 0.125357732843730 |
| 33 | 0.967230169489098 | 0.0655396610218032 | 0.0327698305109016 |
| 34 | 0.96307590606435 | 0.0738481878712986 | 0.0369240939356493 |
| 35 | 0.970080048462836 | 0.0598399030743276 | 0.0299199515371638 |
| 36 | 0.967809779436742 | 0.0643804411265154 | 0.0321902205632577 |
| 37 | 0.995888710644601 | 0.00822257871079732 | 0.00411128935539866 |
| 38 | 0.99544503969748 | 0.00910992060503854 | 0.00455496030251927 |
| Meta Analysis of Goldfeld-Quandt test for Heteroskedasticity | |||
| Description | # significant tests | % significant tests | OK/NOK |
| 1% type I error level | 2 | 0.1 | NOK |
| 5% type I error level | 2 | 0.1 | NOK |
| 10% type I error level | 8 | 0.4 | NOK |