| Multiple Linear Regression - Estimated Regression Equation |
| Y[t] = -0.298335129214115 + 1.00996082592376X[t] + e[t] |
| Multiple Linear Regression - Ordinary Least Squares | |||||
| Variable | Parameter | S.D. | T-STAT H0: parameter = 0 | 2-tail p-value | 1-tail p-value |
| (Intercept) | -0.298335129214115 | 3.053514 | -0.0977 | 0.922506 | 0.461253 |
| X | 1.00996082592376 | 0.027186 | 37.1497 | 0 | 0 |
| Multiple Linear Regression - Regression Statistics | |
| Multiple R | 0.979626993332085 |
| R-squared | 0.959669046064861 |
| Adjusted R-squared | 0.958973684790118 |
| F-TEST (value) | 1380.10136733382 |
| F-TEST (DF numerator) | 1 |
| F-TEST (DF denominator) | 58 |
| p-value | 0 |
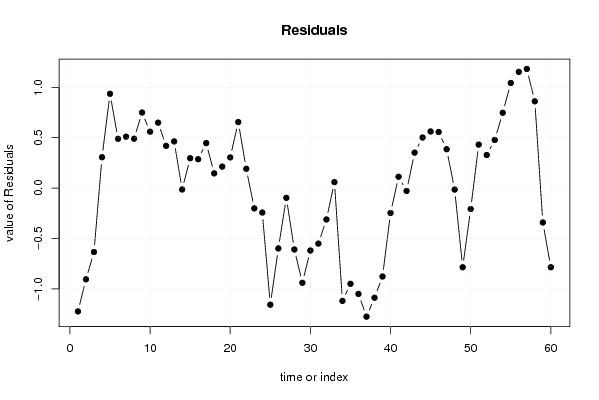
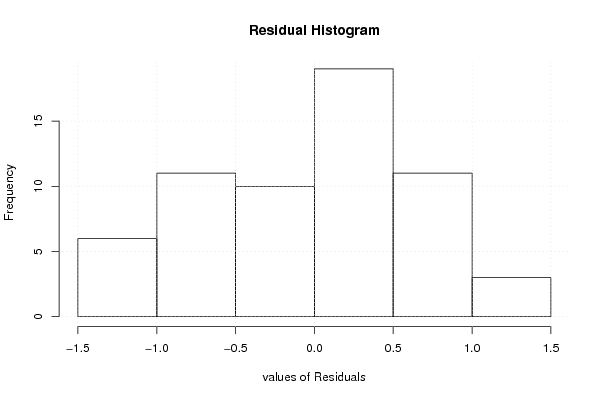
| Multiple Linear Regression - Residual Statistics | |
| Residual Standard Deviation | 0.669834872622641 |
| Sum Squared Residuals | 26.0233678817206 |
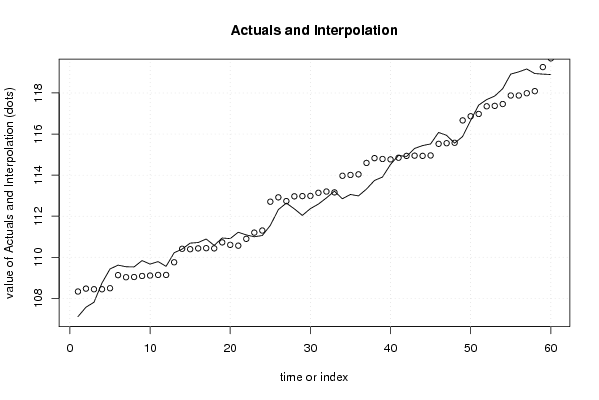
| Multiple Linear Regression - Actuals, Interpolation, and Residuals | |||
| Time or Index | Actuals | Interpolation Forecast | Residuals Prediction Error |
| 1 | 107.11 | 108.333051307146 | -1.22305130714556 |
| 2 | 107.57 | 108.474445822775 | -0.904445822775337 |
| 3 | 107.81 | 108.444146997998 | -0.634146997997608 |
| 4 | 108.75 | 108.444146997998 | 0.30585300200239 |
| 5 | 109.43 | 108.494645039294 | 0.935354960706211 |
| 6 | 109.62 | 109.130920359626 | 0.489079640374242 |
| 7 | 109.54 | 109.029924277033 | 0.510075722966614 |
| 8 | 109.53 | 109.040023885293 | 0.489976114707366 |
| 9 | 109.84 | 109.090521926589 | 0.749478073411183 |
| 10 | 109.67 | 109.110721143107 | 0.55927885689271 |
| 11 | 109.79 | 109.141019967885 | 0.648980032115 |
| 12 | 109.56 | 109.141019967885 | 0.418980032114996 |
| 13 | 110.22 | 109.757096071698 | 0.462903928301497 |
| 14 | 110.4 | 110.413570608549 | -0.0135706085489491 |
| 15 | 110.69 | 110.393371392030 | 0.296628607969529 |
| 16 | 110.72 | 110.433769825067 | 0.286230174932573 |
| 17 | 110.89 | 110.443869433327 | 0.446130566673332 |
| 18 | 110.58 | 110.433769825067 | 0.146230174932572 |
| 19 | 110.94 | 110.726658464585 | 0.213341535414674 |
| 20 | 110.91 | 110.605463165474 | 0.304536834525529 |
| 21 | 111.22 | 110.565064732438 | 0.654935267562488 |
| 22 | 111.09 | 110.898351804992 | 0.191648195007652 |
| 23 | 111 | 111.201340052769 | -0.201340052769492 |
| 24 | 111.06 | 111.302336135362 | -0.242336135361861 |
| 25 | 111.55 | 112.706181683396 | -1.1561816833959 |
| 26 | 112.32 | 112.918273456840 | -0.598273456839888 |
| 27 | 112.64 | 112.736480508174 | -0.0964805081736104 |
| 28 | 112.36 | 112.968771498136 | -0.608771498136081 |
| 29 | 112.04 | 112.978871106395 | -0.938871106395303 |
| 30 | 112.37 | 112.988970714655 | -0.618970714654548 |
| 31 | 112.59 | 113.140464838543 | -0.550464838543105 |
| 32 | 112.89 | 113.201062488099 | -0.311062488098536 |
| 33 | 113.22 | 113.160664055062 | 0.0593359449384049 |
| 34 | 112.85 | 113.968632715801 | -1.11863271580061 |
| 35 | 113.06 | 114.009031148838 | -0.949031148837557 |
| 36 | 112.99 | 114.039329973615 | -1.04932997361526 |
| 37 | 113.32 | 114.594808427873 | -1.27480842787335 |
| 38 | 113.74 | 114.827099417836 | -1.08709941783580 |
| 39 | 113.91 | 114.786700984799 | -0.876700984798858 |
| 40 | 114.52 | 114.766501768280 | -0.246501768280387 |
| 41 | 114.96 | 114.847298634354 | 0.112701365645711 |
| 42 | 114.91 | 114.938195108687 | -0.0281951086874143 |
| 43 | 115.3 | 114.948294716947 | 0.351705283053343 |
| 44 | 115.44 | 114.938195108687 | 0.501804891312587 |
| 45 | 115.52 | 114.958394325206 | 0.5616056747941 |
| 46 | 116.08 | 115.523972387723 | 0.556027612276791 |
| 47 | 115.94 | 115.554271212501 | 0.385728787499091 |
| 48 | 115.56 | 115.574470429019 | -0.0144704290193902 |
| 49 | 115.88 | 116.665228121017 | -0.78522812101706 |
| 50 | 116.66 | 116.867220286202 | -0.207220286201816 |
| 51 | 117.41 | 116.978315977053 | 0.43168402294657 |
| 52 | 117.68 | 117.352001482645 | 0.327998517354797 |
| 53 | 117.85 | 117.372200699164 | 0.477799300836299 |
| 54 | 118.21 | 117.463097173497 | 0.746902826503171 |
| 55 | 118.92 | 117.877181112126 | 1.04281888787442 |
| 56 | 119.03 | 117.877181112126 | 1.15281888787442 |
| 57 | 119.17 | 117.988276802977 | 1.18172319702281 |
| 58 | 118.95 | 118.089272885570 | 0.860727114430441 |
| 59 | 118.92 | 119.260827443641 | -0.340827443641123 |
| 60 | 118.9 | 119.685010990529 | -0.785010990529103 |
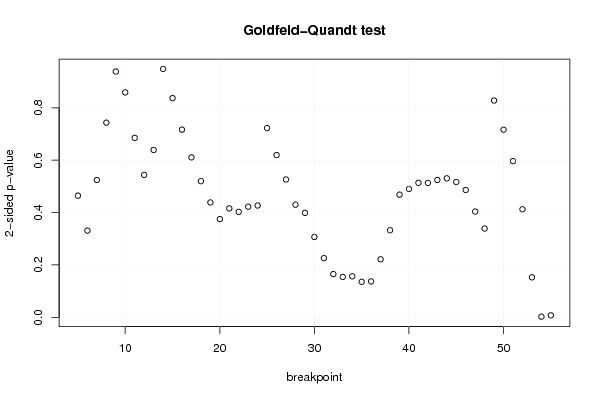
| Goldfeld-Quandt test for Heteroskedasticity | |||
| p-values | Alternative Hypothesis | ||
| breakpoint index | greater | 2-sided | less |
| 5 | 0.767618091420645 | 0.464763817158710 | 0.232381908579355 |
| 6 | 0.834458476092361 | 0.331083047815277 | 0.165541523907638 |
| 7 | 0.73786710263271 | 0.524265794734581 | 0.262132897367291 |
| 8 | 0.6283503484302 | 0.743299303139601 | 0.371649651569801 |
| 9 | 0.530722149271271 | 0.938555701457458 | 0.469277850728729 |
| 10 | 0.429458763221344 | 0.858917526442688 | 0.570541236778656 |
| 11 | 0.342588182756759 | 0.685176365513518 | 0.657411817243241 |
| 12 | 0.271878245170186 | 0.543756490340372 | 0.728121754829814 |
| 13 | 0.319545418641242 | 0.639090837282484 | 0.680454581358758 |
| 14 | 0.474222567883328 | 0.948445135766657 | 0.525777432116672 |
| 15 | 0.418514346086908 | 0.837028692173815 | 0.581485653913092 |
| 16 | 0.358302221326066 | 0.716604442652133 | 0.641697778673934 |
| 17 | 0.305333660719337 | 0.610667321438673 | 0.694666339280663 |
| 18 | 0.259895311877751 | 0.519790623755502 | 0.740104688122249 |
| 19 | 0.219272268180266 | 0.438544536360532 | 0.780727731819734 |
| 20 | 0.187440350493938 | 0.374880700987877 | 0.812559649506062 |
| 21 | 0.208017293405519 | 0.416034586811037 | 0.791982706594481 |
| 22 | 0.201395957574698 | 0.402791915149396 | 0.798604042425302 |
| 23 | 0.211211788354947 | 0.422423576709893 | 0.788788211645053 |
| 24 | 0.213463375174232 | 0.426926750348464 | 0.786536624825768 |
| 25 | 0.361312771301833 | 0.722625542603666 | 0.638687228698167 |
| 26 | 0.309802847439242 | 0.619605694878483 | 0.690197152560758 |
| 27 | 0.263112902546417 | 0.526225805092834 | 0.736887097453583 |
| 28 | 0.214977949241664 | 0.429955898483329 | 0.785022050758336 |
| 29 | 0.199368219928039 | 0.398736439856078 | 0.800631780071961 |
| 30 | 0.153384529823790 | 0.306769059647579 | 0.84661547017621 |
| 31 | 0.112872904207415 | 0.225745808414830 | 0.887127095792585 |
| 32 | 0.0825128811796986 | 0.165025762359397 | 0.917487118820301 |
| 33 | 0.077055098486733 | 0.154110196973466 | 0.922944901513267 |
| 34 | 0.078251254410655 | 0.15650250882131 | 0.921748745589345 |
| 35 | 0.0677681384745049 | 0.135536276949010 | 0.932231861525495 |
| 36 | 0.068478624375253 | 0.136957248750506 | 0.931521375624747 |
| 37 | 0.110812232934877 | 0.221624465869755 | 0.889187767065123 |
| 38 | 0.166217807221204 | 0.332435614442408 | 0.833782192778796 |
| 39 | 0.234192032058338 | 0.468384064116676 | 0.765807967941662 |
| 40 | 0.245021940376076 | 0.490043880752151 | 0.754978059623924 |
| 41 | 0.256768126883671 | 0.513536253767342 | 0.743231873116329 |
| 42 | 0.256594520520396 | 0.513189041040793 | 0.743405479479604 |
| 43 | 0.262326899526058 | 0.524653799052116 | 0.737673100473942 |
| 44 | 0.265372733632876 | 0.530745467265751 | 0.734627266367124 |
| 45 | 0.25833181742769 | 0.51666363485538 | 0.74166818257231 |
| 46 | 0.24316831483328 | 0.48633662966656 | 0.75683168516672 |
| 47 | 0.201892622042420 | 0.403785244084839 | 0.79810737795758 |
| 48 | 0.169517583599119 | 0.339035167198238 | 0.830482416400881 |
| 49 | 0.413963840459378 | 0.827927680918757 | 0.586036159540622 |
| 50 | 0.641705705948097 | 0.716588588103805 | 0.358294294051903 |
| 51 | 0.701776666953007 | 0.596446666093987 | 0.298223333046993 |
| 52 | 0.793722395441631 | 0.412555209116737 | 0.206277604558369 |
| 53 | 0.923689885151717 | 0.152620229696566 | 0.076310114848283 |
| 54 | 0.998776148345425 | 0.00244770330915038 | 0.00122385165457519 |
| 55 | 0.9962714862617 | 0.00745702747659842 | 0.00372851373829921 |
| Meta Analysis of Goldfeld-Quandt test for Heteroskedasticity | |||
| Description | # significant tests | % significant tests | OK/NOK |
| 1% type I error level | 2 | 0.0392156862745098 | NOK |
| 5% type I error level | 2 | 0.0392156862745098 | OK |
| 10% type I error level | 2 | 0.0392156862745098 | OK |