| Multiple Linear Regression - Estimated Regression Equation |
| dzcg[t] = + 77.4426660376957 + 0.756479459281622totid[t] -0.720234730937658ndzcg[t] + 0.27624207061515`indc `[t] + e[t] |
| Multiple Linear Regression - Ordinary Least Squares | |||||
| Variable | Parameter | S.D. | T-STAT H0: parameter = 0 | 2-tail p-value | 1-tail p-value |
| (Intercept) | 77.4426660376957 | 16.198668 | 4.7808 | 1.3e-05 | 6e-06 |
| totid | 0.756479459281622 | 0.161372 | 4.6878 | 1.8e-05 | 9e-06 |
| ndzcg | -0.720234730937658 | 0.196732 | -3.661 | 0.000551 | 0.000276 |
| `indc ` | 0.27624207061515 | 0.085093 | 3.2463 | 0.00196 | 0.00098 |
| Multiple Linear Regression - Regression Statistics | |
| Multiple R | 0.76256897325449 |
| R-squared | 0.581511438970407 |
| Adjusted R-squared | 0.559485725232007 |
| F-TEST (value) | 26.4014799192000 |
| F-TEST (DF numerator) | 3 |
| F-TEST (DF denominator) | 57 |
| p-value | 7.78024311642866e-11 |
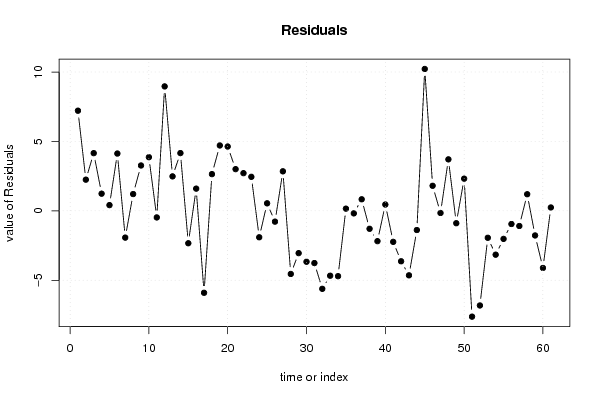
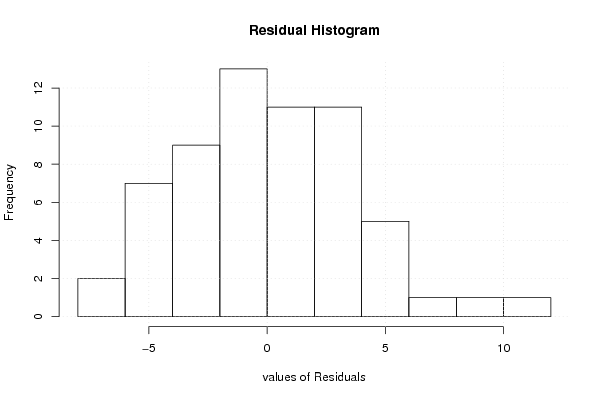
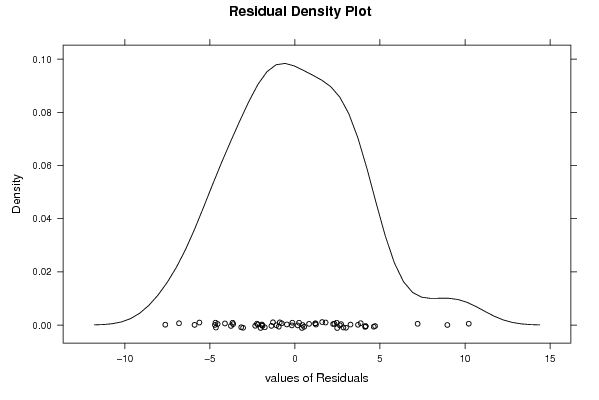
| Multiple Linear Regression - Residual Statistics | |
| Residual Standard Deviation | 3.77517882779633 |
| Sum Squared Residuals | 812.362585364977 |
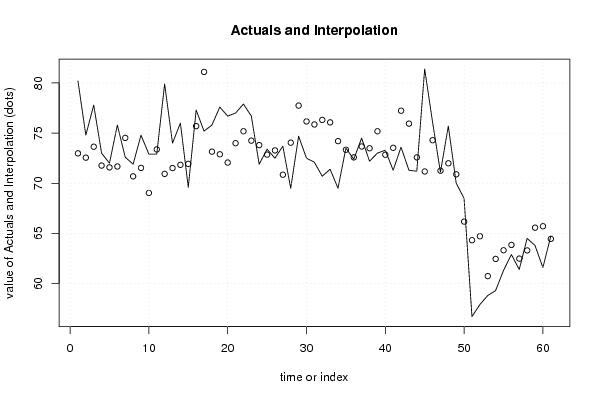
| Multiple Linear Regression - Actuals, Interpolation, and Residuals | |||
| Time or Index | Actuals | Interpolation Forecast | Residuals Prediction Error |
| 1 | 80.2 | 72.9850787129528 | 7.21492128704717 |
| 2 | 74.8 | 72.553916277647 | 2.24608372235302 |
| 3 | 77.8 | 73.6441633892999 | 4.15583661070009 |
| 4 | 73 | 71.763838159599 | 1.23616184040094 |
| 5 | 72 | 71.5878602209662 | 0.412139779033817 |
| 6 | 75.8 | 71.6729371985467 | 4.12706280145334 |
| 7 | 72.6 | 74.5278155493923 | -1.92781554939228 |
| 8 | 71.9 | 70.6910705851223 | 1.20892941487774 |
| 9 | 74.8 | 71.5313789031892 | 3.26862109681083 |
| 10 | 72.9 | 69.035462671154 | 3.86453732884602 |
| 11 | 72.9 | 73.3744810012893 | -0.47448100128933 |
| 12 | 79.9 | 70.936845474797 | 8.96315452520301 |
| 13 | 74 | 71.5171042913216 | 2.48289570867836 |
| 14 | 76 | 71.8392628260572 | 4.16073717394284 |
| 15 | 69.6 | 71.9349705180167 | -2.33497051801672 |
| 16 | 77.3 | 75.6989563100603 | 1.60104368993966 |
| 17 | 75.2 | 81.1016951953495 | -5.90169519534949 |
| 18 | 75.8 | 73.1535185657244 | 2.64648143427558 |
| 19 | 77.6 | 72.8893515963392 | 4.71064840366075 |
| 20 | 76.7 | 72.0673619105 | 4.63263808949998 |
| 21 | 77 | 73.9967426689075 | 3.00325733109253 |
| 22 | 77.9 | 75.1858289503459 | 2.71417104965416 |
| 23 | 76.7 | 74.2490578165327 | 2.45094218346728 |
| 24 | 71.9 | 73.8055775758728 | -1.90557757587277 |
| 25 | 73.4 | 72.8581098669581 | 0.541890133041872 |
| 26 | 72.5 | 73.277197201034 | -0.777197201034032 |
| 27 | 73.7 | 70.8526346036824 | 2.84736539631758 |
| 28 | 69.5 | 74.0465068853323 | -4.54650688533229 |
| 29 | 74.7 | 77.7472089728702 | -3.04720897287022 |
| 30 | 72.5 | 76.1682738441552 | -3.66827384415522 |
| 31 | 72.1 | 75.8622808670782 | -3.76228086707825 |
| 32 | 70.7 | 76.3166345262414 | -5.61663452624137 |
| 33 | 71.4 | 76.0725467275416 | -4.67254672754162 |
| 34 | 69.5 | 74.2055177064516 | -4.70551770645156 |
| 35 | 73.5 | 73.3422144325831 | 0.157785567416899 |
| 36 | 72.4 | 72.5821105004671 | -0.182110500467078 |
| 37 | 74.5 | 73.6687331392856 | 0.831266860714366 |
| 38 | 72.2 | 73.492131798311 | -1.29213179831098 |
| 39 | 73 | 75.184627267619 | -2.18462726761905 |
| 40 | 73.3 | 72.8460541903822 | 0.453945809617794 |
| 41 | 71.3 | 73.5338919452803 | -2.23389194528035 |
| 42 | 73.6 | 77.2338583336857 | -3.63385833368568 |
| 43 | 71.3 | 75.9454398874533 | -4.64543988745333 |
| 44 | 71.2 | 72.5821763611895 | -1.38217636118951 |
| 45 | 81.4 | 71.1781478957139 | 10.2218521042861 |
| 46 | 76.1 | 74.2943044422429 | 1.80569555775710 |
| 47 | 71.1 | 71.2523978908595 | -0.152397890859551 |
| 48 | 75.7 | 71.991956668696 | 3.70804333130403 |
| 49 | 70 | 70.8909019992623 | -0.890901999262271 |
| 50 | 68.5 | 66.1816480089415 | 2.31835199105846 |
| 51 | 56.7 | 64.3223803531828 | -7.62238035318283 |
| 52 | 57.9 | 64.7160769527639 | -6.81607695276391 |
| 53 | 58.8 | 60.7405771814617 | -1.94057718146172 |
| 54 | 59.3 | 62.4582671172089 | -3.1582671172089 |
| 55 | 61.3 | 63.3201260042265 | -2.02012600422649 |
| 56 | 62.9 | 63.8503508887878 | -0.950350888787848 |
| 57 | 61.4 | 62.4908679480644 | -1.09086794806443 |
| 58 | 64.5 | 63.3038945858455 | 1.19610541415449 |
| 59 | 63.8 | 65.5733135390363 | -1.77331353903634 |
| 60 | 61.6 | 65.7142019959836 | -4.11420199598363 |
| 61 | 64.7 | 64.4581611011368 | 0.241838898863238 |
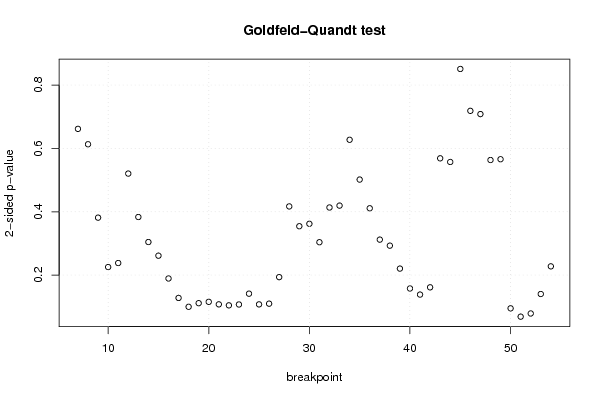
| Goldfeld-Quandt test for Heteroskedasticity | |||
| p-values | Alternative Hypothesis | ||
| breakpoint index | greater | 2-sided | less |
| 7 | 0.330883140661123 | 0.661766281322245 | 0.669116859338877 |
| 8 | 0.306615251444900 | 0.613230502889801 | 0.6933847485551 |
| 9 | 0.190755980142293 | 0.381511960284586 | 0.809244019857707 |
| 10 | 0.112761385157002 | 0.225522770314003 | 0.887238614842998 |
| 11 | 0.119116497095482 | 0.238232994190964 | 0.880883502904518 |
| 12 | 0.260316456612487 | 0.520632913224975 | 0.739683543387513 |
| 13 | 0.191743532548235 | 0.38348706509647 | 0.808256467451765 |
| 14 | 0.152217388801154 | 0.304434777602309 | 0.847782611198846 |
| 15 | 0.130683180156204 | 0.261366360312409 | 0.869316819843796 |
| 16 | 0.094730088579176 | 0.189460177158352 | 0.905269911420824 |
| 17 | 0.0639868605975354 | 0.127973721195071 | 0.936013139402465 |
| 18 | 0.0500027331045407 | 0.100005466209081 | 0.94999726689546 |
| 19 | 0.055725222922247 | 0.111450445844494 | 0.944274777077753 |
| 20 | 0.057814424751571 | 0.115628849503142 | 0.94218557524843 |
| 21 | 0.0538605429090855 | 0.107721085818171 | 0.946139457090915 |
| 22 | 0.052298675062481 | 0.104597350124962 | 0.94770132493752 |
| 23 | 0.0536657673802234 | 0.107331534760447 | 0.946334232619777 |
| 24 | 0.0706802789068912 | 0.141360557813782 | 0.929319721093109 |
| 25 | 0.0538055097356303 | 0.107611019471261 | 0.94619449026437 |
| 26 | 0.0549360083310147 | 0.109872016662029 | 0.945063991668985 |
| 27 | 0.096829505424212 | 0.193659010848424 | 0.903170494575788 |
| 28 | 0.208467267827513 | 0.416934535655027 | 0.791532732172487 |
| 29 | 0.177205502030119 | 0.354411004060239 | 0.82279449796988 |
| 30 | 0.181063536626334 | 0.362127073252667 | 0.818936463373666 |
| 31 | 0.151957522829256 | 0.303915045658512 | 0.848042477170744 |
| 32 | 0.206769486197014 | 0.413538972394029 | 0.793230513802986 |
| 33 | 0.209759229475018 | 0.419518458950036 | 0.790240770524982 |
| 34 | 0.313684411808084 | 0.627368823616169 | 0.686315588191916 |
| 35 | 0.250888063543353 | 0.501776127086707 | 0.749111936456647 |
| 36 | 0.205549994485081 | 0.411099988970162 | 0.794450005514919 |
| 37 | 0.156034305655474 | 0.312068611310948 | 0.843965694344526 |
| 38 | 0.146530762240531 | 0.293061524481063 | 0.853469237759469 |
| 39 | 0.110320243250338 | 0.220640486500675 | 0.889679756749662 |
| 40 | 0.0789187386511197 | 0.157837477302239 | 0.92108126134888 |
| 41 | 0.0692874155226142 | 0.138574831045228 | 0.930712584477386 |
| 42 | 0.0807506559452565 | 0.161501311890513 | 0.919249344054744 |
| 43 | 0.284410319087084 | 0.568820638174168 | 0.715589680912916 |
| 44 | 0.278657642113115 | 0.55731528422623 | 0.721342357886885 |
| 45 | 0.425523603305933 | 0.851047206611865 | 0.574476396694067 |
| 46 | 0.359391623515959 | 0.718783247031919 | 0.64060837648404 |
| 47 | 0.354259117267709 | 0.708518234535418 | 0.645740882732291 |
| 48 | 0.281716115878698 | 0.563432231757395 | 0.718283884121302 |
| 49 | 0.282976424644732 | 0.565952849289464 | 0.717023575355268 |
| 50 | 0.952423803322037 | 0.0951523933559261 | 0.0475761966779631 |
| 51 | 0.96556566096102 | 0.0688686780779618 | 0.0344343390389809 |
| 52 | 0.960550815089572 | 0.0788983698208551 | 0.0394491849104276 |
| 53 | 0.929823459512642 | 0.140353080974717 | 0.0701765404873585 |
| 54 | 0.88613171060993 | 0.22773657878014 | 0.11386828939007 |
| Meta Analysis of Goldfeld-Quandt test for Heteroskedasticity | |||
| Description | # significant tests | % significant tests | OK/NOK |
| 1% type I error level | 0 | 0 | OK |
| 5% type I error level | 0 | 0 | OK |
| 10% type I error level | 3 | 0.0625 | OK |