| Multiple Linear Regression - Estimated Regression Equation |
| X[t] = + 18.3307933952183 + 0.00373894172101956Y[t] -0.00994243414329733Y1[t] -0.0286088377747364Y2[t] -0.0351917944930868Y3[t] -0.0205447551967472Y4[t] + 0.246350043357412M1[t] -0.176443499281986M2[t] -0.7592473898286M3[t] -1.01309436201666M4[t] -0.960018480853686M5[t] -0.882068729586974M6[t] + 0.0324099427149764M7[t] -0.0479806478054456M8[t] -0.549765441448620M9[t] -1.09462221361560M10[t] -0.872758620940506M11[t] -0.0116552255662847t + e[t] |
| Multiple Linear Regression - Ordinary Least Squares | |||||
| Variable | Parameter | S.D. | T-STAT H0: parameter = 0 | 2-tail p-value | 1-tail p-value |
| (Intercept) | 18.3307933952183 | 4.676352 | 3.9199 | 0.000338 | 0.000169 |
| Y | 0.00373894172101956 | 0.021192 | 0.1764 | 0.860844 | 0.430422 |
| Y1 | -0.00994243414329733 | 0.022279 | -0.4463 | 0.65781 | 0.328905 |
| Y2 | -0.0286088377747364 | 0.020082 | -1.4246 | 0.16202 | 0.08101 |
| Y3 | -0.0351917944930868 | 0.022778 | -1.545 | 0.130231 | 0.065116 |
| Y4 | -0.0205447551967472 | 0.021909 | -0.9377 | 0.354017 | 0.177009 |
| M1 | 0.246350043357412 | 0.561956 | 0.4384 | 0.663469 | 0.331735 |
| M2 | -0.176443499281986 | 0.621947 | -0.2837 | 0.778107 | 0.389054 |
| M3 | -0.7592473898286 | 0.677966 | -1.1199 | 0.26944 | 0.13472 |
| M4 | -1.01309436201666 | 0.553894 | -1.829 | 0.074856 | 0.037428 |
| M5 | -0.960018480853686 | 0.433549 | -2.2143 | 0.032568 | 0.016284 |
| M6 | -0.882068729586974 | 0.488682 | -1.805 | 0.078607 | 0.039304 |
| M7 | 0.0324099427149764 | 0.487602 | 0.0665 | 0.947336 | 0.473668 |
| M8 | -0.0479806478054456 | 0.641393 | -0.0748 | 0.940741 | 0.470371 |
| M9 | -0.549765441448620 | 0.771893 | -0.7122 | 0.480456 | 0.240228 |
| M10 | -1.09462221361560 | 0.933406 | -1.1727 | 0.247845 | 0.123923 |
| M11 | -0.872758620940506 | 0.693778 | -1.258 | 0.215694 | 0.107847 |
| t | -0.0116552255662847 | 0.01016 | -1.1472 | 0.25811 | 0.129055 |
| Multiple Linear Regression - Regression Statistics | |
| Multiple R | 0.83781925068927 |
| R-squared | 0.701941096825531 |
| Adjusted R-squared | 0.575266062976381 |
| F-TEST (value) | 5.54127419978774 |
| F-TEST (DF numerator) | 17 |
| F-TEST (DF denominator) | 40 |
| p-value | 4.24438353996415e-06 |
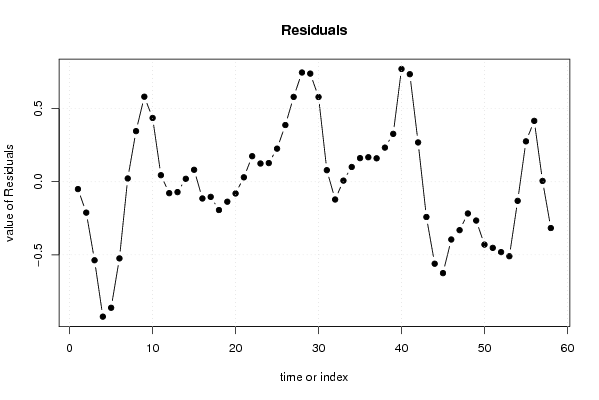
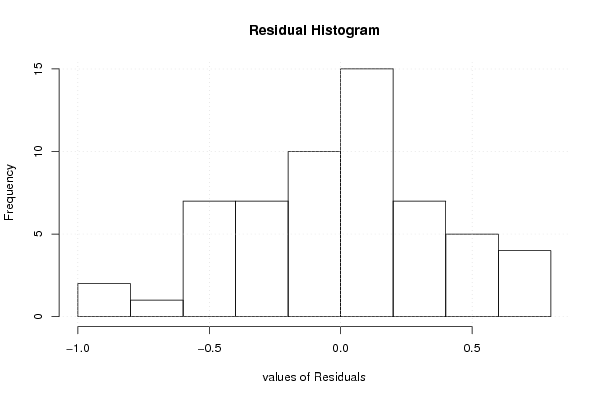
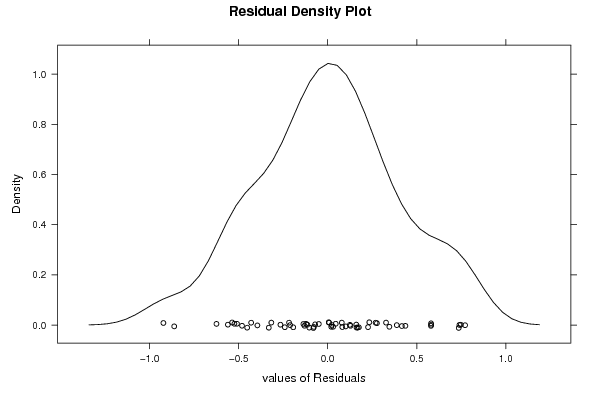
| Multiple Linear Regression - Residual Statistics | |
| Residual Standard Deviation | 0.471101869906799 |
| Sum Squared Residuals | 8.87747887318731 |
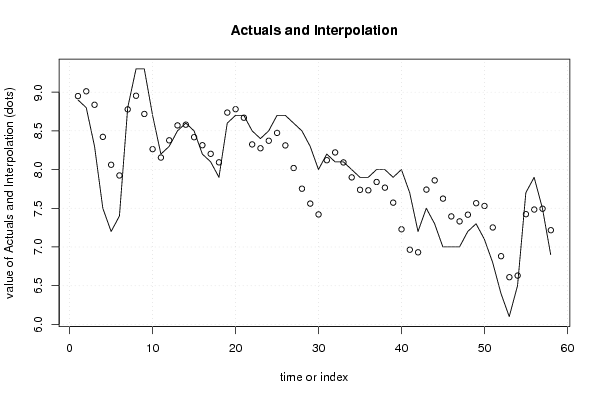
| Multiple Linear Regression - Actuals, Interpolation, and Residuals | |||
| Time or Index | Actuals | Interpolation Forecast | Residuals Prediction Error |
| 1 | 8.9 | 8.9500707321233 | -0.0500707321232941 |
| 2 | 8.8 | 9.01123483184811 | -0.211234831848113 |
| 3 | 8.3 | 8.83704472759312 | -0.537044727593118 |
| 4 | 7.5 | 8.42271920707304 | -0.92271920707304 |
| 5 | 7.2 | 8.06196893456235 | -0.861968934562356 |
| 6 | 7.4 | 7.92411243392233 | -0.524112433922327 |
| 7 | 8.8 | 8.77768273855173 | 0.0223172614482707 |
| 8 | 9.3 | 8.95377113587553 | 0.346228864124469 |
| 9 | 9.3 | 8.71847906476528 | 0.581520935234717 |
| 10 | 8.7 | 8.2638083978102 | 0.436191602189792 |
| 11 | 8.2 | 8.155207150633 | 0.0447928493670056 |
| 12 | 8.3 | 8.37811739853015 | -0.0781173985301458 |
| 13 | 8.5 | 8.57090833873204 | -0.0709083387320373 |
| 14 | 8.6 | 8.58001511515205 | 0.01998488484795 |
| 15 | 8.5 | 8.41822294681427 | 0.0817770531857263 |
| 16 | 8.2 | 8.31452734862594 | -0.114527348625942 |
| 17 | 8.1 | 8.20357178412464 | -0.103571784124643 |
| 18 | 7.9 | 8.09363184796774 | -0.193631847967741 |
| 19 | 8.6 | 8.73651185979242 | -0.136511859792415 |
| 20 | 8.7 | 8.7803195400561 | -0.0803195400561012 |
| 21 | 8.7 | 8.66978461864393 | 0.0302153813560743 |
| 22 | 8.5 | 8.32529703593668 | 0.174702964063322 |
| 23 | 8.4 | 8.2754118052196 | 0.124588194780404 |
| 24 | 8.5 | 8.37230475560633 | 0.127695244393673 |
| 25 | 8.7 | 8.47368814195925 | 0.226311858040754 |
| 26 | 8.7 | 8.31228356179427 | 0.387716438205733 |
| 27 | 8.6 | 8.01983468389998 | 0.580165316100019 |
| 28 | 8.5 | 7.75288692974273 | 0.747113070257266 |
| 29 | 8.3 | 7.56041471693852 | 0.739585283061476 |
| 30 | 8 | 7.42045803134335 | 0.579541968656647 |
| 31 | 8.2 | 8.12094981341 | 0.0790501865899989 |
| 32 | 8.1 | 8.22151742432917 | -0.121517424329170 |
| 33 | 8.1 | 8.09237839726122 | 0.00762160273877814 |
| 34 | 8 | 7.89909239157944 | 0.100907608420555 |
| 35 | 7.9 | 7.73834280516965 | 0.161657194830348 |
| 36 | 7.9 | 7.73238100976156 | 0.167618990238445 |
| 37 | 8 | 7.83977989263602 | 0.160220107363980 |
| 38 | 8 | 7.7665448367377 | 0.233455163262297 |
| 39 | 7.9 | 7.57263746534287 | 0.327362534657132 |
| 40 | 8 | 7.22862468691157 | 0.771375313088429 |
| 41 | 7.7 | 6.96451479503463 | 0.735485204965369 |
| 42 | 7.2 | 6.93115551379277 | 0.268844486207234 |
| 43 | 7.5 | 7.74111518431416 | -0.241115184314158 |
| 44 | 7.3 | 7.86068793990322 | -0.560687939903218 |
| 45 | 7 | 7.62483455741265 | -0.624834557412654 |
| 46 | 7 | 7.39502623528864 | -0.395026235288645 |
| 47 | 7 | 7.33103823897776 | -0.331038238977757 |
| 48 | 7.2 | 7.41719683610197 | -0.217196836101970 |
| 49 | 7.3 | 7.5655528945494 | -0.265552894549402 |
| 50 | 7.1 | 7.52992165446787 | -0.429921654467867 |
| 51 | 6.8 | 7.25226017634976 | -0.452260176349760 |
| 52 | 6.4 | 6.88124182764671 | -0.481241827646712 |
| 53 | 6.1 | 6.60952976933985 | -0.509529769339847 |
| 54 | 6.5 | 6.63064217297381 | -0.130642172973813 |
| 55 | 7.7 | 7.4237404039317 | 0.276259596068304 |
| 56 | 7.9 | 7.48370395983598 | 0.41629604016402 |
| 57 | 7.5 | 7.49452336191692 | 0.00547663808308477 |
| 58 | 6.9 | 7.21677593938503 | -0.316775939385026 |
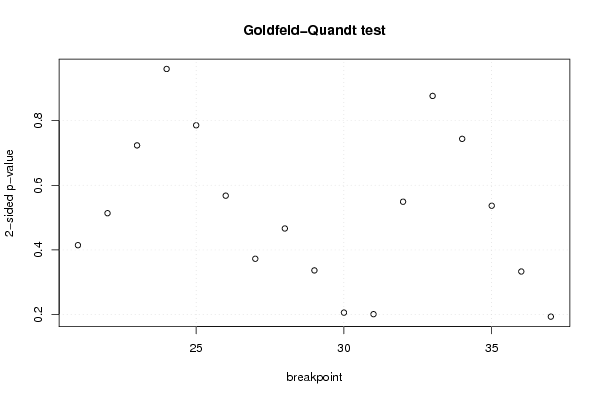
| Goldfeld-Quandt test for Heteroskedasticity | |||
| p-values | Alternative Hypothesis | ||
| breakpoint index | greater | 2-sided | less |
| 21 | 0.79271118526718 | 0.414577629465639 | 0.207288814732819 |
| 22 | 0.743217970052408 | 0.513564059895184 | 0.256782029947592 |
| 23 | 0.638302609545252 | 0.723394780909496 | 0.361697390454748 |
| 24 | 0.520061256725813 | 0.959877486548373 | 0.479938743274187 |
| 25 | 0.392804188405288 | 0.785608376810576 | 0.607195811594712 |
| 26 | 0.283880023102818 | 0.567760046205637 | 0.716119976897182 |
| 27 | 0.186291962436433 | 0.372583924872867 | 0.813708037563567 |
| 28 | 0.233132772889901 | 0.466265545779802 | 0.766867227110099 |
| 29 | 0.168280118171714 | 0.336560236343429 | 0.831719881828286 |
| 30 | 0.102982680797510 | 0.205965361595021 | 0.89701731920249 |
| 31 | 0.10055854740214 | 0.20111709480428 | 0.89944145259786 |
| 32 | 0.274539984765206 | 0.549079969530411 | 0.725460015234795 |
| 33 | 0.438212942165467 | 0.876425884330935 | 0.561787057834533 |
| 34 | 0.371821268925547 | 0.743642537851095 | 0.628178731074453 |
| 35 | 0.268352323723245 | 0.536704647446489 | 0.731647676276755 |
| 36 | 0.166577128761237 | 0.333154257522474 | 0.833422871238763 |
| 37 | 0.0967359004152693 | 0.193471800830539 | 0.90326409958473 |
| Meta Analysis of Goldfeld-Quandt test for Heteroskedasticity | |||
| Description | # significant tests | % significant tests | OK/NOK |
| 1% type I error level | 0 | 0 | OK |
| 5% type I error level | 0 | 0 | OK |
| 10% type I error level | 0 | 0 | OK |