Free Statistics

of Irreproducible Research!

Author's title

Author*The author of this computation has been verified*
R Software Modulerwasp_multipleregression.wasp
Title produced by softwareMultiple Regression
Date of computationFri, 20 Nov 2009 12:22:54 -0700
Cite this page as followsStatistical Computations at FreeStatistics.org, Office for Research Development and Education, URL https://freestatistics.org/blog/index.php?v=date/2009/Nov/20/t1258745027mhvinry1psiuokx.htm/, Retrieved Fri, 26 Apr 2024 15:00:43 +0000
Statistical Computations at FreeStatistics.org, Office for Research Development and Education, URL https://freestatistics.org/blog/index.php?pk=58437, Retrieved Fri, 26 Apr 2024 15:00:43 +0000
QR Codes:

Original text written by user:
IsPrivate?No (this computation is public)
User-defined keywords
Estimated Impact143
Family? (F = Feedback message, R = changed R code, M = changed R Module, P = changed Parameters, D = changed Data)
-     [Multiple Regression] [Q1 The Seatbeltlaw] [2007-11-14 19:27:43] [8cd6641b921d30ebe00b648d1481bba0]
- RM D  [Multiple Regression] [Seatbelt] [2009-11-12 14:10:54] [b98453cac15ba1066b407e146608df68]
- R PD      [Multiple Regression] [Model 4] [2009-11-20 19:22:54] [a25640248f5f3c4d92f02a597edd3aef] [Current]
-    D        [Multiple Regression] [Model 5] [2009-11-20 19:50:08] [2c014794d4323c20be9bea6a55dac7b2]
Feedback Forum

Post a new message
Dataseries X:
95.1	8.9	96.9	98.6	111.7	109.8
97	8.8	95.1	96.9	98.6	111.7
112.7	8.3	97	95.1	96.9	98.6
102.9	7.5	112.7	97	95.1	96.9
97.4	7.2	102.9	112.7	97	95.1
111.4	7.4	97.4	102.9	112.7	97
87.4	8.8	111.4	97.4	102.9	112.7
96.8	9.3	87.4	111.4	97.4	102.9
114.1	9.3	96.8	87.4	111.4	97.4
110.3	8.7	114.1	96.8	87.4	111.4
103.9	8.2	110.3	114.1	96.8	87.4
101.6	8.3	103.9	110.3	114.1	96.8
94.6	8.5	101.6	103.9	110.3	114.1
95.9	8.6	94.6	101.6	103.9	110.3
104.7	8.5	95.9	94.6	101.6	103.9
102.8	8.2	104.7	95.9	94.6	101.6
98.1	8.1	102.8	104.7	95.9	94.6
113.9	7.9	98.1	102.8	104.7	95.9
80.9	8.6	113.9	98.1	102.8	104.7
95.7	8.7	80.9	113.9	98.1	102.8
113.2	8.7	95.7	80.9	113.9	98.1
105.9	8.5	113.2	95.7	80.9	113.9
108.8	8.4	105.9	113.2	95.7	80.9
102.3	8.5	108.8	105.9	113.2	95.7
99	8.7	102.3	108.8	105.9	113.2
100.7	8.7	99	102.3	108.8	105.9
115.5	8.6	100.7	99	102.3	108.8
100.7	8.5	115.5	100.7	99	102.3
109.9	8.3	100.7	115.5	100.7	99
114.6	8	109.9	100.7	115.5	100.7
85.4	8.2	114.6	109.9	100.7	115.5
100.5	8.1	85.4	114.6	109.9	100.7
114.8	8.1	100.5	85.4	114.6	109.9
116.5	8	114.8	100.5	85.4	114.6
112.9	7.9	116.5	114.8	100.5	85.4
102	7.9	112.9	116.5	114.8	100.5
106	8	102	112.9	116.5	114.8
105.3	8	106	102	112.9	116.5
118.8	7.9	105.3	106	102	112.9
106.1	8	118.8	105.3	106	102
109.3	7.7	106.1	118.8	105.3	106
117.2	7.2	109.3	106.1	118.8	105.3
92.5	7.5	117.2	109.3	106.1	118.8
104.2	7.3	92.5	117.2	109.3	106.1
112.5	7	104.2	92.5	117.2	109.3
122.4	7	112.5	104.2	92.5	117.2
113.3	7	122.4	112.5	104.2	92.5
100	7.2	113.3	122.4	112.5	104.2
110.7	7.3	100	113.3	122.4	112.5
112.8	7.1	110.7	100	113.3	122.4
109.8	6.8	112.8	110.7	100	113.3
117.3	6.4	109.8	112.8	110.7	100
109.1	6.1	117.3	109.8	112.8	110.7
115.9	6.5	109.1	117.3	109.8	112.8
96	7.7	115.9	109.1	117.3	109.8
99.8	7.9	96	115.9	109.1	117.3
116.8	7.5	99.8	96	115.9	109.1
115.7	6.9	116.8	99.8	96	115.9


Summary of computational transaction
Raw Inputview raw input (R code)
Raw Outputview raw output of R engine
Computing time8 seconds
R Server'Gwilym Jenkins' @ 72.249.127.135

\begin{tabular}{lllllllll}
\hline
Summary of computational transaction \tabularnewline
Raw Input & view raw input (R code)  \tabularnewline
Raw Output & view raw output of R engine  \tabularnewline
Computing time & 8 seconds \tabularnewline
R Server & 'Gwilym Jenkins' @ 72.249.127.135 \tabularnewline
\hline
\end{tabular}
%Source: https://freestatistics.org/blog/index.php?pk=58437&T=0

[TABLE]
[ROW][C]Summary of computational transaction[/C][/ROW]
[ROW][C]Raw Input[/C][C]view raw input (R code) [/C][/ROW]
[ROW][C]Raw Output[/C][C]view raw output of R engine [/C][/ROW]
[ROW][C]Computing time[/C][C]8 seconds[/C][/ROW]
[ROW][C]R Server[/C][C]'Gwilym Jenkins' @ 72.249.127.135[/C][/ROW]
[/TABLE]
Source: https://freestatistics.org/blog/index.php?pk=58437&T=0

Globally Unique Identifier (entire table): ba.freestatistics.org/blog/index.php?pk=58437&T=0

As an alternative you can also use a QR Code:  

The GUIDs for individual cells are displayed in the table below:

Summary of computational transaction
Raw Inputview raw input (R code)
Raw Outputview raw output of R engine
Computing time8 seconds
R Server'Gwilym Jenkins' @ 72.249.127.135


Multiple Linear Regression - Estimated Regression Equation
X[t] = + 18.3307933952183 + 0.00373894172101956Y[t] -0.00994243414329733Y1[t] -0.0286088377747364Y2[t] -0.0351917944930868Y3[t] -0.0205447551967472Y4[t] + 0.246350043357412M1[t] -0.176443499281986M2[t] -0.7592473898286M3[t] -1.01309436201666M4[t] -0.960018480853686M5[t] -0.882068729586974M6[t] + 0.0324099427149764M7[t] -0.0479806478054456M8[t] -0.549765441448620M9[t] -1.09462221361560M10[t] -0.872758620940506M11[t] -0.0116552255662847t + e[t]

\begin{tabular}{lllllllll}
\hline
Multiple Linear Regression - Estimated Regression Equation \tabularnewline
X[t] =  +  18.3307933952183 +  0.00373894172101956Y[t] -0.00994243414329733Y1[t] -0.0286088377747364Y2[t] -0.0351917944930868Y3[t] -0.0205447551967472Y4[t] +  0.246350043357412M1[t] -0.176443499281986M2[t] -0.7592473898286M3[t] -1.01309436201666M4[t] -0.960018480853686M5[t] -0.882068729586974M6[t] +  0.0324099427149764M7[t] -0.0479806478054456M8[t] -0.549765441448620M9[t] -1.09462221361560M10[t] -0.872758620940506M11[t] -0.0116552255662847t  + e[t] \tabularnewline
\hline
\end{tabular}
%Source: https://freestatistics.org/blog/index.php?pk=58437&T=1

[TABLE]
[ROW][C]Multiple Linear Regression - Estimated Regression Equation[/C][/ROW]
[ROW][C]X[t] =  +  18.3307933952183 +  0.00373894172101956Y[t] -0.00994243414329733Y1[t] -0.0286088377747364Y2[t] -0.0351917944930868Y3[t] -0.0205447551967472Y4[t] +  0.246350043357412M1[t] -0.176443499281986M2[t] -0.7592473898286M3[t] -1.01309436201666M4[t] -0.960018480853686M5[t] -0.882068729586974M6[t] +  0.0324099427149764M7[t] -0.0479806478054456M8[t] -0.549765441448620M9[t] -1.09462221361560M10[t] -0.872758620940506M11[t] -0.0116552255662847t  + e[t][/C][/ROW]
[/TABLE]
Source: https://freestatistics.org/blog/index.php?pk=58437&T=1

Globally Unique Identifier (entire table): ba.freestatistics.org/blog/index.php?pk=58437&T=1

As an alternative you can also use a QR Code:  

The GUIDs for individual cells are displayed in the table below:

Multiple Linear Regression - Estimated Regression Equation
X[t] = + 18.3307933952183 + 0.00373894172101956Y[t] -0.00994243414329733Y1[t] -0.0286088377747364Y2[t] -0.0351917944930868Y3[t] -0.0205447551967472Y4[t] + 0.246350043357412M1[t] -0.176443499281986M2[t] -0.7592473898286M3[t] -1.01309436201666M4[t] -0.960018480853686M5[t] -0.882068729586974M6[t] + 0.0324099427149764M7[t] -0.0479806478054456M8[t] -0.549765441448620M9[t] -1.09462221361560M10[t] -0.872758620940506M11[t] -0.0116552255662847t + e[t]


Multiple Linear Regression - Ordinary Least Squares
VariableParameterS.D.T-STATH0: parameter = 02-tail p-value1-tail p-value
(Intercept)18.33079339521834.6763523.91990.0003380.000169
Y0.003738941721019560.0211920.17640.8608440.430422
Y1-0.009942434143297330.022279-0.44630.657810.328905
Y2-0.02860883777473640.020082-1.42460.162020.08101
Y3-0.03519179449308680.022778-1.5450.1302310.065116
Y4-0.02054475519674720.021909-0.93770.3540170.177009
M10.2463500433574120.5619560.43840.6634690.331735
M2-0.1764434992819860.621947-0.28370.7781070.389054
M3-0.75924738982860.677966-1.11990.269440.13472
M4-1.013094362016660.553894-1.8290.0748560.037428
M5-0.9600184808536860.433549-2.21430.0325680.016284
M6-0.8820687295869740.488682-1.8050.0786070.039304
M70.03240994271497640.4876020.06650.9473360.473668
M8-0.04798064780544560.641393-0.07480.9407410.470371
M9-0.5497654414486200.771893-0.71220.4804560.240228
M10-1.094622213615600.933406-1.17270.2478450.123923
M11-0.8727586209405060.693778-1.2580.2156940.107847
t-0.01165522556628470.01016-1.14720.258110.129055

\begin{tabular}{lllllllll}
\hline
Multiple Linear Regression - Ordinary Least Squares \tabularnewline
Variable & Parameter & S.D. & T-STATH0: parameter = 0 & 2-tail p-value & 1-tail p-value \tabularnewline
(Intercept) & 18.3307933952183 & 4.676352 & 3.9199 & 0.000338 & 0.000169 \tabularnewline
Y & 0.00373894172101956 & 0.021192 & 0.1764 & 0.860844 & 0.430422 \tabularnewline
Y1 & -0.00994243414329733 & 0.022279 & -0.4463 & 0.65781 & 0.328905 \tabularnewline
Y2 & -0.0286088377747364 & 0.020082 & -1.4246 & 0.16202 & 0.08101 \tabularnewline
Y3 & -0.0351917944930868 & 0.022778 & -1.545 & 0.130231 & 0.065116 \tabularnewline
Y4 & -0.0205447551967472 & 0.021909 & -0.9377 & 0.354017 & 0.177009 \tabularnewline
M1 & 0.246350043357412 & 0.561956 & 0.4384 & 0.663469 & 0.331735 \tabularnewline
M2 & -0.176443499281986 & 0.621947 & -0.2837 & 0.778107 & 0.389054 \tabularnewline
M3 & -0.7592473898286 & 0.677966 & -1.1199 & 0.26944 & 0.13472 \tabularnewline
M4 & -1.01309436201666 & 0.553894 & -1.829 & 0.074856 & 0.037428 \tabularnewline
M5 & -0.960018480853686 & 0.433549 & -2.2143 & 0.032568 & 0.016284 \tabularnewline
M6 & -0.882068729586974 & 0.488682 & -1.805 & 0.078607 & 0.039304 \tabularnewline
M7 & 0.0324099427149764 & 0.487602 & 0.0665 & 0.947336 & 0.473668 \tabularnewline
M8 & -0.0479806478054456 & 0.641393 & -0.0748 & 0.940741 & 0.470371 \tabularnewline
M9 & -0.549765441448620 & 0.771893 & -0.7122 & 0.480456 & 0.240228 \tabularnewline
M10 & -1.09462221361560 & 0.933406 & -1.1727 & 0.247845 & 0.123923 \tabularnewline
M11 & -0.872758620940506 & 0.693778 & -1.258 & 0.215694 & 0.107847 \tabularnewline
t & -0.0116552255662847 & 0.01016 & -1.1472 & 0.25811 & 0.129055 \tabularnewline
\hline
\end{tabular}
%Source: https://freestatistics.org/blog/index.php?pk=58437&T=2

[TABLE]
[ROW][C]Multiple Linear Regression - Ordinary Least Squares[/C][/ROW]
[ROW][C]Variable[/C][C]Parameter[/C][C]S.D.[/C][C]T-STATH0: parameter = 0[/C][C]2-tail p-value[/C][C]1-tail p-value[/C][/ROW]
[ROW][C](Intercept)[/C][C]18.3307933952183[/C][C]4.676352[/C][C]3.9199[/C][C]0.000338[/C][C]0.000169[/C][/ROW]
[ROW][C]Y[/C][C]0.00373894172101956[/C][C]0.021192[/C][C]0.1764[/C][C]0.860844[/C][C]0.430422[/C][/ROW]
[ROW][C]Y1[/C][C]-0.00994243414329733[/C][C]0.022279[/C][C]-0.4463[/C][C]0.65781[/C][C]0.328905[/C][/ROW]
[ROW][C]Y2[/C][C]-0.0286088377747364[/C][C]0.020082[/C][C]-1.4246[/C][C]0.16202[/C][C]0.08101[/C][/ROW]
[ROW][C]Y3[/C][C]-0.0351917944930868[/C][C]0.022778[/C][C]-1.545[/C][C]0.130231[/C][C]0.065116[/C][/ROW]
[ROW][C]Y4[/C][C]-0.0205447551967472[/C][C]0.021909[/C][C]-0.9377[/C][C]0.354017[/C][C]0.177009[/C][/ROW]
[ROW][C]M1[/C][C]0.246350043357412[/C][C]0.561956[/C][C]0.4384[/C][C]0.663469[/C][C]0.331735[/C][/ROW]
[ROW][C]M2[/C][C]-0.176443499281986[/C][C]0.621947[/C][C]-0.2837[/C][C]0.778107[/C][C]0.389054[/C][/ROW]
[ROW][C]M3[/C][C]-0.7592473898286[/C][C]0.677966[/C][C]-1.1199[/C][C]0.26944[/C][C]0.13472[/C][/ROW]
[ROW][C]M4[/C][C]-1.01309436201666[/C][C]0.553894[/C][C]-1.829[/C][C]0.074856[/C][C]0.037428[/C][/ROW]
[ROW][C]M5[/C][C]-0.960018480853686[/C][C]0.433549[/C][C]-2.2143[/C][C]0.032568[/C][C]0.016284[/C][/ROW]
[ROW][C]M6[/C][C]-0.882068729586974[/C][C]0.488682[/C][C]-1.805[/C][C]0.078607[/C][C]0.039304[/C][/ROW]
[ROW][C]M7[/C][C]0.0324099427149764[/C][C]0.487602[/C][C]0.0665[/C][C]0.947336[/C][C]0.473668[/C][/ROW]
[ROW][C]M8[/C][C]-0.0479806478054456[/C][C]0.641393[/C][C]-0.0748[/C][C]0.940741[/C][C]0.470371[/C][/ROW]
[ROW][C]M9[/C][C]-0.549765441448620[/C][C]0.771893[/C][C]-0.7122[/C][C]0.480456[/C][C]0.240228[/C][/ROW]
[ROW][C]M10[/C][C]-1.09462221361560[/C][C]0.933406[/C][C]-1.1727[/C][C]0.247845[/C][C]0.123923[/C][/ROW]
[ROW][C]M11[/C][C]-0.872758620940506[/C][C]0.693778[/C][C]-1.258[/C][C]0.215694[/C][C]0.107847[/C][/ROW]
[ROW][C]t[/C][C]-0.0116552255662847[/C][C]0.01016[/C][C]-1.1472[/C][C]0.25811[/C][C]0.129055[/C][/ROW]
[/TABLE]
Source: https://freestatistics.org/blog/index.php?pk=58437&T=2

Globally Unique Identifier (entire table): ba.freestatistics.org/blog/index.php?pk=58437&T=2

As an alternative you can also use a QR Code:  

The GUIDs for individual cells are displayed in the table below:

Multiple Linear Regression - Ordinary Least Squares
VariableParameterS.D.T-STATH0: parameter = 02-tail p-value1-tail p-value
(Intercept)18.33079339521834.6763523.91990.0003380.000169
Y0.003738941721019560.0211920.17640.8608440.430422
Y1-0.009942434143297330.022279-0.44630.657810.328905
Y2-0.02860883777473640.020082-1.42460.162020.08101
Y3-0.03519179449308680.022778-1.5450.1302310.065116
Y4-0.02054475519674720.021909-0.93770.3540170.177009
M10.2463500433574120.5619560.43840.6634690.331735
M2-0.1764434992819860.621947-0.28370.7781070.389054
M3-0.75924738982860.677966-1.11990.269440.13472
M4-1.013094362016660.553894-1.8290.0748560.037428
M5-0.9600184808536860.433549-2.21430.0325680.016284
M6-0.8820687295869740.488682-1.8050.0786070.039304
M70.03240994271497640.4876020.06650.9473360.473668
M8-0.04798064780544560.641393-0.07480.9407410.470371
M9-0.5497654414486200.771893-0.71220.4804560.240228
M10-1.094622213615600.933406-1.17270.2478450.123923
M11-0.8727586209405060.693778-1.2580.2156940.107847
t-0.01165522556628470.01016-1.14720.258110.129055


Multiple Linear Regression - Regression Statistics
Multiple R0.83781925068927
R-squared0.701941096825531
Adjusted R-squared0.575266062976381
F-TEST (value)5.54127419978774
F-TEST (DF numerator)17
F-TEST (DF denominator)40
p-value4.24438353996415e-06
Multiple Linear Regression - Residual Statistics
Residual Standard Deviation0.471101869906799
Sum Squared Residuals8.87747887318731

\begin{tabular}{lllllllll}
\hline
Multiple Linear Regression - Regression Statistics \tabularnewline
Multiple R & 0.83781925068927 \tabularnewline
R-squared & 0.701941096825531 \tabularnewline
Adjusted R-squared & 0.575266062976381 \tabularnewline
F-TEST (value) & 5.54127419978774 \tabularnewline
F-TEST (DF numerator) & 17 \tabularnewline
F-TEST (DF denominator) & 40 \tabularnewline
p-value & 4.24438353996415e-06 \tabularnewline
Multiple Linear Regression - Residual Statistics \tabularnewline
Residual Standard Deviation & 0.471101869906799 \tabularnewline
Sum Squared Residuals & 8.87747887318731 \tabularnewline
\hline
\end{tabular}
%Source: https://freestatistics.org/blog/index.php?pk=58437&T=3

[TABLE]
[ROW][C]Multiple Linear Regression - Regression Statistics[/C][/ROW]
[ROW][C]Multiple R[/C][C]0.83781925068927[/C][/ROW]
[ROW][C]R-squared[/C][C]0.701941096825531[/C][/ROW]
[ROW][C]Adjusted R-squared[/C][C]0.575266062976381[/C][/ROW]
[ROW][C]F-TEST (value)[/C][C]5.54127419978774[/C][/ROW]
[ROW][C]F-TEST (DF numerator)[/C][C]17[/C][/ROW]
[ROW][C]F-TEST (DF denominator)[/C][C]40[/C][/ROW]
[ROW][C]p-value[/C][C]4.24438353996415e-06[/C][/ROW]
[ROW][C]Multiple Linear Regression - Residual Statistics[/C][/ROW]
[ROW][C]Residual Standard Deviation[/C][C]0.471101869906799[/C][/ROW]
[ROW][C]Sum Squared Residuals[/C][C]8.87747887318731[/C][/ROW]
[/TABLE]
Source: https://freestatistics.org/blog/index.php?pk=58437&T=3

Globally Unique Identifier (entire table): ba.freestatistics.org/blog/index.php?pk=58437&T=3

As an alternative you can also use a QR Code:  

The GUIDs for individual cells are displayed in the table below:

Multiple Linear Regression - Regression Statistics
Multiple R0.83781925068927
R-squared0.701941096825531
Adjusted R-squared0.575266062976381
F-TEST (value)5.54127419978774
F-TEST (DF numerator)17
F-TEST (DF denominator)40
p-value4.24438353996415e-06
Multiple Linear Regression - Residual Statistics
Residual Standard Deviation0.471101869906799
Sum Squared Residuals8.87747887318731


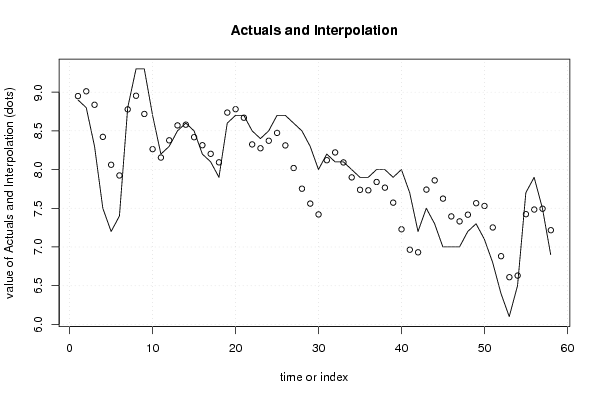
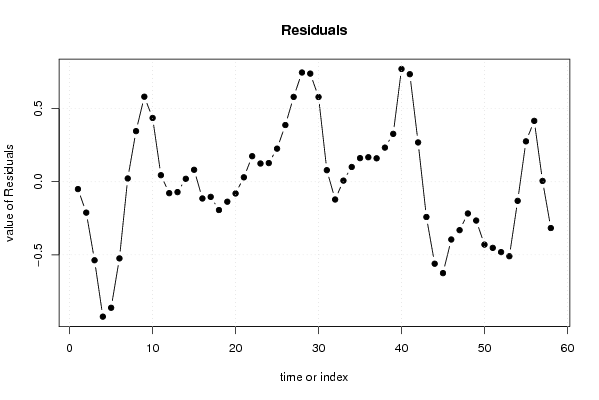
Multiple Linear Regression - Actuals, Interpolation, and Residuals
Time or IndexActualsInterpolationForecastResidualsPrediction Error
18.98.9500707321233-0.0500707321232941
28.89.01123483184811-0.211234831848113
38.38.83704472759312-0.537044727593118
47.58.42271920707304-0.92271920707304
57.28.06196893456235-0.861968934562356
67.47.92411243392233-0.524112433922327
78.88.777682738551730.0223172614482707
89.38.953771135875530.346228864124469
99.38.718479064765280.581520935234717
108.78.26380839781020.436191602189792
118.28.1552071506330.0447928493670056
128.38.37811739853015-0.0781173985301458
138.58.57090833873204-0.0709083387320373
148.68.580015115152050.01998488484795
158.58.418222946814270.0817770531857263
168.28.31452734862594-0.114527348625942
178.18.20357178412464-0.103571784124643
187.98.09363184796774-0.193631847967741
198.68.73651185979242-0.136511859792415
208.78.7803195400561-0.0803195400561012
218.78.669784618643930.0302153813560743
228.58.325297035936680.174702964063322
238.48.27541180521960.124588194780404
248.58.372304755606330.127695244393673
258.78.473688141959250.226311858040754
268.78.312283561794270.387716438205733
278.68.019834683899980.580165316100019
288.57.752886929742730.747113070257266
298.37.560414716938520.739585283061476
3087.420458031343350.579541968656647
318.28.120949813410.0790501865899989
328.18.22151742432917-0.121517424329170
338.18.092378397261220.00762160273877814
3487.899092391579440.100907608420555
357.97.738342805169650.161657194830348
367.97.732381009761560.167618990238445
3787.839779892636020.160220107363980
3887.76654483673770.233455163262297
397.97.572637465342870.327362534657132
4087.228624686911570.771375313088429
417.76.964514795034630.735485204965369
427.26.931155513792770.268844486207234
437.57.74111518431416-0.241115184314158
447.37.86068793990322-0.560687939903218
4577.62483455741265-0.624834557412654
4677.39502623528864-0.395026235288645
4777.33103823897776-0.331038238977757
487.27.41719683610197-0.217196836101970
497.37.5655528945494-0.265552894549402
507.17.52992165446787-0.429921654467867
516.87.25226017634976-0.452260176349760
526.46.88124182764671-0.481241827646712
536.16.60952976933985-0.509529769339847
546.56.63064217297381-0.130642172973813
557.77.42374040393170.276259596068304
567.97.483703959835980.41629604016402
577.57.494523361916920.00547663808308477
586.97.21677593938503-0.316775939385026

\begin{tabular}{lllllllll}
\hline
Multiple Linear Regression - Actuals, Interpolation, and Residuals \tabularnewline
Time or Index & Actuals & InterpolationForecast & ResidualsPrediction Error \tabularnewline
1 & 8.9 & 8.9500707321233 & -0.0500707321232941 \tabularnewline
2 & 8.8 & 9.01123483184811 & -0.211234831848113 \tabularnewline
3 & 8.3 & 8.83704472759312 & -0.537044727593118 \tabularnewline
4 & 7.5 & 8.42271920707304 & -0.92271920707304 \tabularnewline
5 & 7.2 & 8.06196893456235 & -0.861968934562356 \tabularnewline
6 & 7.4 & 7.92411243392233 & -0.524112433922327 \tabularnewline
7 & 8.8 & 8.77768273855173 & 0.0223172614482707 \tabularnewline
8 & 9.3 & 8.95377113587553 & 0.346228864124469 \tabularnewline
9 & 9.3 & 8.71847906476528 & 0.581520935234717 \tabularnewline
10 & 8.7 & 8.2638083978102 & 0.436191602189792 \tabularnewline
11 & 8.2 & 8.155207150633 & 0.0447928493670056 \tabularnewline
12 & 8.3 & 8.37811739853015 & -0.0781173985301458 \tabularnewline
13 & 8.5 & 8.57090833873204 & -0.0709083387320373 \tabularnewline
14 & 8.6 & 8.58001511515205 & 0.01998488484795 \tabularnewline
15 & 8.5 & 8.41822294681427 & 0.0817770531857263 \tabularnewline
16 & 8.2 & 8.31452734862594 & -0.114527348625942 \tabularnewline
17 & 8.1 & 8.20357178412464 & -0.103571784124643 \tabularnewline
18 & 7.9 & 8.09363184796774 & -0.193631847967741 \tabularnewline
19 & 8.6 & 8.73651185979242 & -0.136511859792415 \tabularnewline
20 & 8.7 & 8.7803195400561 & -0.0803195400561012 \tabularnewline
21 & 8.7 & 8.66978461864393 & 0.0302153813560743 \tabularnewline
22 & 8.5 & 8.32529703593668 & 0.174702964063322 \tabularnewline
23 & 8.4 & 8.2754118052196 & 0.124588194780404 \tabularnewline
24 & 8.5 & 8.37230475560633 & 0.127695244393673 \tabularnewline
25 & 8.7 & 8.47368814195925 & 0.226311858040754 \tabularnewline
26 & 8.7 & 8.31228356179427 & 0.387716438205733 \tabularnewline
27 & 8.6 & 8.01983468389998 & 0.580165316100019 \tabularnewline
28 & 8.5 & 7.75288692974273 & 0.747113070257266 \tabularnewline
29 & 8.3 & 7.56041471693852 & 0.739585283061476 \tabularnewline
30 & 8 & 7.42045803134335 & 0.579541968656647 \tabularnewline
31 & 8.2 & 8.12094981341 & 0.0790501865899989 \tabularnewline
32 & 8.1 & 8.22151742432917 & -0.121517424329170 \tabularnewline
33 & 8.1 & 8.09237839726122 & 0.00762160273877814 \tabularnewline
34 & 8 & 7.89909239157944 & 0.100907608420555 \tabularnewline
35 & 7.9 & 7.73834280516965 & 0.161657194830348 \tabularnewline
36 & 7.9 & 7.73238100976156 & 0.167618990238445 \tabularnewline
37 & 8 & 7.83977989263602 & 0.160220107363980 \tabularnewline
38 & 8 & 7.7665448367377 & 0.233455163262297 \tabularnewline
39 & 7.9 & 7.57263746534287 & 0.327362534657132 \tabularnewline
40 & 8 & 7.22862468691157 & 0.771375313088429 \tabularnewline
41 & 7.7 & 6.96451479503463 & 0.735485204965369 \tabularnewline
42 & 7.2 & 6.93115551379277 & 0.268844486207234 \tabularnewline
43 & 7.5 & 7.74111518431416 & -0.241115184314158 \tabularnewline
44 & 7.3 & 7.86068793990322 & -0.560687939903218 \tabularnewline
45 & 7 & 7.62483455741265 & -0.624834557412654 \tabularnewline
46 & 7 & 7.39502623528864 & -0.395026235288645 \tabularnewline
47 & 7 & 7.33103823897776 & -0.331038238977757 \tabularnewline
48 & 7.2 & 7.41719683610197 & -0.217196836101970 \tabularnewline
49 & 7.3 & 7.5655528945494 & -0.265552894549402 \tabularnewline
50 & 7.1 & 7.52992165446787 & -0.429921654467867 \tabularnewline
51 & 6.8 & 7.25226017634976 & -0.452260176349760 \tabularnewline
52 & 6.4 & 6.88124182764671 & -0.481241827646712 \tabularnewline
53 & 6.1 & 6.60952976933985 & -0.509529769339847 \tabularnewline
54 & 6.5 & 6.63064217297381 & -0.130642172973813 \tabularnewline
55 & 7.7 & 7.4237404039317 & 0.276259596068304 \tabularnewline
56 & 7.9 & 7.48370395983598 & 0.41629604016402 \tabularnewline
57 & 7.5 & 7.49452336191692 & 0.00547663808308477 \tabularnewline
58 & 6.9 & 7.21677593938503 & -0.316775939385026 \tabularnewline
\hline
\end{tabular}
%Source: https://freestatistics.org/blog/index.php?pk=58437&T=4

[TABLE]
[ROW][C]Multiple Linear Regression - Actuals, Interpolation, and Residuals[/C][/ROW]
[ROW][C]Time or Index[/C][C]Actuals[/C][C]InterpolationForecast[/C][C]ResidualsPrediction Error[/C][/ROW]
[ROW][C]1[/C][C]8.9[/C][C]8.9500707321233[/C][C]-0.0500707321232941[/C][/ROW]
[ROW][C]2[/C][C]8.8[/C][C]9.01123483184811[/C][C]-0.211234831848113[/C][/ROW]
[ROW][C]3[/C][C]8.3[/C][C]8.83704472759312[/C][C]-0.537044727593118[/C][/ROW]
[ROW][C]4[/C][C]7.5[/C][C]8.42271920707304[/C][C]-0.92271920707304[/C][/ROW]
[ROW][C]5[/C][C]7.2[/C][C]8.06196893456235[/C][C]-0.861968934562356[/C][/ROW]
[ROW][C]6[/C][C]7.4[/C][C]7.92411243392233[/C][C]-0.524112433922327[/C][/ROW]
[ROW][C]7[/C][C]8.8[/C][C]8.77768273855173[/C][C]0.0223172614482707[/C][/ROW]
[ROW][C]8[/C][C]9.3[/C][C]8.95377113587553[/C][C]0.346228864124469[/C][/ROW]
[ROW][C]9[/C][C]9.3[/C][C]8.71847906476528[/C][C]0.581520935234717[/C][/ROW]
[ROW][C]10[/C][C]8.7[/C][C]8.2638083978102[/C][C]0.436191602189792[/C][/ROW]
[ROW][C]11[/C][C]8.2[/C][C]8.155207150633[/C][C]0.0447928493670056[/C][/ROW]
[ROW][C]12[/C][C]8.3[/C][C]8.37811739853015[/C][C]-0.0781173985301458[/C][/ROW]
[ROW][C]13[/C][C]8.5[/C][C]8.57090833873204[/C][C]-0.0709083387320373[/C][/ROW]
[ROW][C]14[/C][C]8.6[/C][C]8.58001511515205[/C][C]0.01998488484795[/C][/ROW]
[ROW][C]15[/C][C]8.5[/C][C]8.41822294681427[/C][C]0.0817770531857263[/C][/ROW]
[ROW][C]16[/C][C]8.2[/C][C]8.31452734862594[/C][C]-0.114527348625942[/C][/ROW]
[ROW][C]17[/C][C]8.1[/C][C]8.20357178412464[/C][C]-0.103571784124643[/C][/ROW]
[ROW][C]18[/C][C]7.9[/C][C]8.09363184796774[/C][C]-0.193631847967741[/C][/ROW]
[ROW][C]19[/C][C]8.6[/C][C]8.73651185979242[/C][C]-0.136511859792415[/C][/ROW]
[ROW][C]20[/C][C]8.7[/C][C]8.7803195400561[/C][C]-0.0803195400561012[/C][/ROW]
[ROW][C]21[/C][C]8.7[/C][C]8.66978461864393[/C][C]0.0302153813560743[/C][/ROW]
[ROW][C]22[/C][C]8.5[/C][C]8.32529703593668[/C][C]0.174702964063322[/C][/ROW]
[ROW][C]23[/C][C]8.4[/C][C]8.2754118052196[/C][C]0.124588194780404[/C][/ROW]
[ROW][C]24[/C][C]8.5[/C][C]8.37230475560633[/C][C]0.127695244393673[/C][/ROW]
[ROW][C]25[/C][C]8.7[/C][C]8.47368814195925[/C][C]0.226311858040754[/C][/ROW]
[ROW][C]26[/C][C]8.7[/C][C]8.31228356179427[/C][C]0.387716438205733[/C][/ROW]
[ROW][C]27[/C][C]8.6[/C][C]8.01983468389998[/C][C]0.580165316100019[/C][/ROW]
[ROW][C]28[/C][C]8.5[/C][C]7.75288692974273[/C][C]0.747113070257266[/C][/ROW]
[ROW][C]29[/C][C]8.3[/C][C]7.56041471693852[/C][C]0.739585283061476[/C][/ROW]
[ROW][C]30[/C][C]8[/C][C]7.42045803134335[/C][C]0.579541968656647[/C][/ROW]
[ROW][C]31[/C][C]8.2[/C][C]8.12094981341[/C][C]0.0790501865899989[/C][/ROW]
[ROW][C]32[/C][C]8.1[/C][C]8.22151742432917[/C][C]-0.121517424329170[/C][/ROW]
[ROW][C]33[/C][C]8.1[/C][C]8.09237839726122[/C][C]0.00762160273877814[/C][/ROW]
[ROW][C]34[/C][C]8[/C][C]7.89909239157944[/C][C]0.100907608420555[/C][/ROW]
[ROW][C]35[/C][C]7.9[/C][C]7.73834280516965[/C][C]0.161657194830348[/C][/ROW]
[ROW][C]36[/C][C]7.9[/C][C]7.73238100976156[/C][C]0.167618990238445[/C][/ROW]
[ROW][C]37[/C][C]8[/C][C]7.83977989263602[/C][C]0.160220107363980[/C][/ROW]
[ROW][C]38[/C][C]8[/C][C]7.7665448367377[/C][C]0.233455163262297[/C][/ROW]
[ROW][C]39[/C][C]7.9[/C][C]7.57263746534287[/C][C]0.327362534657132[/C][/ROW]
[ROW][C]40[/C][C]8[/C][C]7.22862468691157[/C][C]0.771375313088429[/C][/ROW]
[ROW][C]41[/C][C]7.7[/C][C]6.96451479503463[/C][C]0.735485204965369[/C][/ROW]
[ROW][C]42[/C][C]7.2[/C][C]6.93115551379277[/C][C]0.268844486207234[/C][/ROW]
[ROW][C]43[/C][C]7.5[/C][C]7.74111518431416[/C][C]-0.241115184314158[/C][/ROW]
[ROW][C]44[/C][C]7.3[/C][C]7.86068793990322[/C][C]-0.560687939903218[/C][/ROW]
[ROW][C]45[/C][C]7[/C][C]7.62483455741265[/C][C]-0.624834557412654[/C][/ROW]
[ROW][C]46[/C][C]7[/C][C]7.39502623528864[/C][C]-0.395026235288645[/C][/ROW]
[ROW][C]47[/C][C]7[/C][C]7.33103823897776[/C][C]-0.331038238977757[/C][/ROW]
[ROW][C]48[/C][C]7.2[/C][C]7.41719683610197[/C][C]-0.217196836101970[/C][/ROW]
[ROW][C]49[/C][C]7.3[/C][C]7.5655528945494[/C][C]-0.265552894549402[/C][/ROW]
[ROW][C]50[/C][C]7.1[/C][C]7.52992165446787[/C][C]-0.429921654467867[/C][/ROW]
[ROW][C]51[/C][C]6.8[/C][C]7.25226017634976[/C][C]-0.452260176349760[/C][/ROW]
[ROW][C]52[/C][C]6.4[/C][C]6.88124182764671[/C][C]-0.481241827646712[/C][/ROW]
[ROW][C]53[/C][C]6.1[/C][C]6.60952976933985[/C][C]-0.509529769339847[/C][/ROW]
[ROW][C]54[/C][C]6.5[/C][C]6.63064217297381[/C][C]-0.130642172973813[/C][/ROW]
[ROW][C]55[/C][C]7.7[/C][C]7.4237404039317[/C][C]0.276259596068304[/C][/ROW]
[ROW][C]56[/C][C]7.9[/C][C]7.48370395983598[/C][C]0.41629604016402[/C][/ROW]
[ROW][C]57[/C][C]7.5[/C][C]7.49452336191692[/C][C]0.00547663808308477[/C][/ROW]
[ROW][C]58[/C][C]6.9[/C][C]7.21677593938503[/C][C]-0.316775939385026[/C][/ROW]
[/TABLE]
Source: https://freestatistics.org/blog/index.php?pk=58437&T=4

Globally Unique Identifier (entire table): ba.freestatistics.org/blog/index.php?pk=58437&T=4

As an alternative you can also use a QR Code:  

The GUIDs for individual cells are displayed in the table below:

Multiple Linear Regression - Actuals, Interpolation, and Residuals
Time or IndexActualsInterpolationForecastResidualsPrediction Error
18.98.9500707321233-0.0500707321232941
28.89.01123483184811-0.211234831848113
38.38.83704472759312-0.537044727593118
47.58.42271920707304-0.92271920707304
57.28.06196893456235-0.861968934562356
67.47.92411243392233-0.524112433922327
78.88.777682738551730.0223172614482707
89.38.953771135875530.346228864124469
99.38.718479064765280.581520935234717
108.78.26380839781020.436191602189792
118.28.1552071506330.0447928493670056
128.38.37811739853015-0.0781173985301458
138.58.57090833873204-0.0709083387320373
148.68.580015115152050.01998488484795
158.58.418222946814270.0817770531857263
168.28.31452734862594-0.114527348625942
178.18.20357178412464-0.103571784124643
187.98.09363184796774-0.193631847967741
198.68.73651185979242-0.136511859792415
208.78.7803195400561-0.0803195400561012
218.78.669784618643930.0302153813560743
228.58.325297035936680.174702964063322
238.48.27541180521960.124588194780404
248.58.372304755606330.127695244393673
258.78.473688141959250.226311858040754
268.78.312283561794270.387716438205733
278.68.019834683899980.580165316100019
288.57.752886929742730.747113070257266
298.37.560414716938520.739585283061476
3087.420458031343350.579541968656647
318.28.120949813410.0790501865899989
328.18.22151742432917-0.121517424329170
338.18.092378397261220.00762160273877814
3487.899092391579440.100907608420555
357.97.738342805169650.161657194830348
367.97.732381009761560.167618990238445
3787.839779892636020.160220107363980
3887.76654483673770.233455163262297
397.97.572637465342870.327362534657132
4087.228624686911570.771375313088429
417.76.964514795034630.735485204965369
427.26.931155513792770.268844486207234
437.57.74111518431416-0.241115184314158
447.37.86068793990322-0.560687939903218
4577.62483455741265-0.624834557412654
4677.39502623528864-0.395026235288645
4777.33103823897776-0.331038238977757
487.27.41719683610197-0.217196836101970
497.37.5655528945494-0.265552894549402
507.17.52992165446787-0.429921654467867
516.87.25226017634976-0.452260176349760
526.46.88124182764671-0.481241827646712
536.16.60952976933985-0.509529769339847
546.56.63064217297381-0.130642172973813
557.77.42374040393170.276259596068304
567.97.483703959835980.41629604016402
577.57.494523361916920.00547663808308477
586.97.21677593938503-0.316775939385026


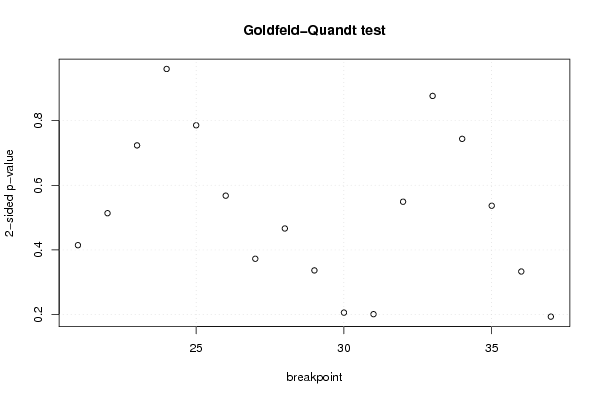
Goldfeld-Quandt test for Heteroskedasticity
p-valuesAlternative Hypothesis
breakpoint indexgreater2-sidedless
210.792711185267180.4145776294656390.207288814732819
220.7432179700524080.5135640598951840.256782029947592
230.6383026095452520.7233947809094960.361697390454748
240.5200612567258130.9598774865483730.479938743274187
250.3928041884052880.7856083768105760.607195811594712
260.2838800231028180.5677600462056370.716119976897182
270.1862919624364330.3725839248728670.813708037563567
280.2331327728899010.4662655457798020.766867227110099
290.1682801181717140.3365602363434290.831719881828286
300.1029826807975100.2059653615950210.89701731920249
310.100558547402140.201117094804280.89944145259786
320.2745399847652060.5490799695304110.725460015234795
330.4382129421654670.8764258843309350.561787057834533
340.3718212689255470.7436425378510950.628178731074453
350.2683523237232450.5367046474464890.731647676276755
360.1665771287612370.3331542575224740.833422871238763
370.09673590041526930.1934718008305390.90326409958473

\begin{tabular}{lllllllll}
\hline
Goldfeld-Quandt test for Heteroskedasticity \tabularnewline
p-values & Alternative Hypothesis \tabularnewline
breakpoint index & greater & 2-sided & less \tabularnewline
21 & 0.79271118526718 & 0.414577629465639 & 0.207288814732819 \tabularnewline
22 & 0.743217970052408 & 0.513564059895184 & 0.256782029947592 \tabularnewline
23 & 0.638302609545252 & 0.723394780909496 & 0.361697390454748 \tabularnewline
24 & 0.520061256725813 & 0.959877486548373 & 0.479938743274187 \tabularnewline
25 & 0.392804188405288 & 0.785608376810576 & 0.607195811594712 \tabularnewline
26 & 0.283880023102818 & 0.567760046205637 & 0.716119976897182 \tabularnewline
27 & 0.186291962436433 & 0.372583924872867 & 0.813708037563567 \tabularnewline
28 & 0.233132772889901 & 0.466265545779802 & 0.766867227110099 \tabularnewline
29 & 0.168280118171714 & 0.336560236343429 & 0.831719881828286 \tabularnewline
30 & 0.102982680797510 & 0.205965361595021 & 0.89701731920249 \tabularnewline
31 & 0.10055854740214 & 0.20111709480428 & 0.89944145259786 \tabularnewline
32 & 0.274539984765206 & 0.549079969530411 & 0.725460015234795 \tabularnewline
33 & 0.438212942165467 & 0.876425884330935 & 0.561787057834533 \tabularnewline
34 & 0.371821268925547 & 0.743642537851095 & 0.628178731074453 \tabularnewline
35 & 0.268352323723245 & 0.536704647446489 & 0.731647676276755 \tabularnewline
36 & 0.166577128761237 & 0.333154257522474 & 0.833422871238763 \tabularnewline
37 & 0.0967359004152693 & 0.193471800830539 & 0.90326409958473 \tabularnewline
\hline
\end{tabular}
%Source: https://freestatistics.org/blog/index.php?pk=58437&T=5

[TABLE]
[ROW][C]Goldfeld-Quandt test for Heteroskedasticity[/C][/ROW]
[ROW][C]p-values[/C][C]Alternative Hypothesis[/C][/ROW]
[ROW][C]breakpoint index[/C][C]greater[/C][C]2-sided[/C][C]less[/C][/ROW]
[ROW][C]21[/C][C]0.79271118526718[/C][C]0.414577629465639[/C][C]0.207288814732819[/C][/ROW]
[ROW][C]22[/C][C]0.743217970052408[/C][C]0.513564059895184[/C][C]0.256782029947592[/C][/ROW]
[ROW][C]23[/C][C]0.638302609545252[/C][C]0.723394780909496[/C][C]0.361697390454748[/C][/ROW]
[ROW][C]24[/C][C]0.520061256725813[/C][C]0.959877486548373[/C][C]0.479938743274187[/C][/ROW]
[ROW][C]25[/C][C]0.392804188405288[/C][C]0.785608376810576[/C][C]0.607195811594712[/C][/ROW]
[ROW][C]26[/C][C]0.283880023102818[/C][C]0.567760046205637[/C][C]0.716119976897182[/C][/ROW]
[ROW][C]27[/C][C]0.186291962436433[/C][C]0.372583924872867[/C][C]0.813708037563567[/C][/ROW]
[ROW][C]28[/C][C]0.233132772889901[/C][C]0.466265545779802[/C][C]0.766867227110099[/C][/ROW]
[ROW][C]29[/C][C]0.168280118171714[/C][C]0.336560236343429[/C][C]0.831719881828286[/C][/ROW]
[ROW][C]30[/C][C]0.102982680797510[/C][C]0.205965361595021[/C][C]0.89701731920249[/C][/ROW]
[ROW][C]31[/C][C]0.10055854740214[/C][C]0.20111709480428[/C][C]0.89944145259786[/C][/ROW]
[ROW][C]32[/C][C]0.274539984765206[/C][C]0.549079969530411[/C][C]0.725460015234795[/C][/ROW]
[ROW][C]33[/C][C]0.438212942165467[/C][C]0.876425884330935[/C][C]0.561787057834533[/C][/ROW]
[ROW][C]34[/C][C]0.371821268925547[/C][C]0.743642537851095[/C][C]0.628178731074453[/C][/ROW]
[ROW][C]35[/C][C]0.268352323723245[/C][C]0.536704647446489[/C][C]0.731647676276755[/C][/ROW]
[ROW][C]36[/C][C]0.166577128761237[/C][C]0.333154257522474[/C][C]0.833422871238763[/C][/ROW]
[ROW][C]37[/C][C]0.0967359004152693[/C][C]0.193471800830539[/C][C]0.90326409958473[/C][/ROW]
[/TABLE]
Source: https://freestatistics.org/blog/index.php?pk=58437&T=5

Globally Unique Identifier (entire table): ba.freestatistics.org/blog/index.php?pk=58437&T=5

As an alternative you can also use a QR Code:  

The GUIDs for individual cells are displayed in the table below:

Goldfeld-Quandt test for Heteroskedasticity
p-valuesAlternative Hypothesis
breakpoint indexgreater2-sidedless
210.792711185267180.4145776294656390.207288814732819
220.7432179700524080.5135640598951840.256782029947592
230.6383026095452520.7233947809094960.361697390454748
240.5200612567258130.9598774865483730.479938743274187
250.3928041884052880.7856083768105760.607195811594712
260.2838800231028180.5677600462056370.716119976897182
270.1862919624364330.3725839248728670.813708037563567
280.2331327728899010.4662655457798020.766867227110099
290.1682801181717140.3365602363434290.831719881828286
300.1029826807975100.2059653615950210.89701731920249
310.100558547402140.201117094804280.89944145259786
320.2745399847652060.5490799695304110.725460015234795
330.4382129421654670.8764258843309350.561787057834533
340.3718212689255470.7436425378510950.628178731074453
350.2683523237232450.5367046474464890.731647676276755
360.1665771287612370.3331542575224740.833422871238763
370.09673590041526930.1934718008305390.90326409958473


Meta Analysis of Goldfeld-Quandt test for Heteroskedasticity
Description# significant tests% significant testsOK/NOK
1% type I error level00OK
5% type I error level00OK
10% type I error level00OK

\begin{tabular}{lllllllll}
\hline
Meta Analysis of Goldfeld-Quandt test for Heteroskedasticity \tabularnewline
Description & # significant tests & % significant tests & OK/NOK \tabularnewline
1% type I error level & 0 & 0 & OK \tabularnewline
5% type I error level & 0 & 0 & OK \tabularnewline
10% type I error level & 0 & 0 & OK \tabularnewline
\hline
\end{tabular}
%Source: https://freestatistics.org/blog/index.php?pk=58437&T=6

[TABLE]
[ROW][C]Meta Analysis of Goldfeld-Quandt test for Heteroskedasticity[/C][/ROW]
[ROW][C]Description[/C][C]# significant tests[/C][C]% significant tests[/C][C]OK/NOK[/C][/ROW]
[ROW][C]1% type I error level[/C][C]0[/C][C]0[/C][C]OK[/C][/ROW]
[ROW][C]5% type I error level[/C][C]0[/C][C]0[/C][C]OK[/C][/ROW]
[ROW][C]10% type I error level[/C][C]0[/C][C]0[/C][C]OK[/C][/ROW]
[/TABLE]
Source: https://freestatistics.org/blog/index.php?pk=58437&T=6

Globally Unique Identifier (entire table): ba.freestatistics.org/blog/index.php?pk=58437&T=6

As an alternative you can also use a QR Code:  

The GUIDs for individual cells are displayed in the table below:

Meta Analysis of Goldfeld-Quandt test for Heteroskedasticity
Description# significant tests% significant testsOK/NOK
1% type I error level00OK
5% type I error level00OK
10% type I error level00OK


Parameters (Session):
par1 = 2 ; par2 = Include Monthly Dummies ; par3 = Linear Trend ;
Parameters (R input):
par1 = 2 ; par2 = Include Monthly Dummies ; par3 = Linear Trend ;
R code (references can be found in the software module):
library(lattice)
library(lmtest)
n25 <- 25 #minimum number of obs. for Goldfeld-Quandt test
par1 <- as.numeric(par1)
x <- t(y)
k <- length(x[1,])
n <- length(x[,1])
x1 <- cbind(x[,par1], x[,1:k!=par1])
mycolnames <- c(colnames(x)[par1], colnames(x)[1:k!=par1])
colnames(x1) <- mycolnames #colnames(x)[par1]
x <- x1
if (par3 == 'First Differences'){
x2 <- array(0, dim=c(n-1,k), dimnames=list(1:(n-1), paste('(1-B)',colnames(x),sep='')))
for (i in 1:n-1) {
for (j in 1:k) {
x2[i,j] <- x[i+1,j] - x[i,j]
}
}
x <- x2
}
if (par2 == 'Include Monthly Dummies'){
x2 <- array(0, dim=c(n,11), dimnames=list(1:n, paste('M', seq(1:11), sep ='')))
for (i in 1:11){
x2[seq(i,n,12),i] <- 1
}
x <- cbind(x, x2)
}
if (par2 == 'Include Quarterly Dummies'){
x2 <- array(0, dim=c(n,3), dimnames=list(1:n, paste('Q', seq(1:3), sep ='')))
for (i in 1:3){
x2[seq(i,n,4),i] <- 1
}
x <- cbind(x, x2)
}
k <- length(x[1,])
if (par3 == 'Linear Trend'){
x <- cbind(x, c(1:n))
colnames(x)[k+1] <- 't'
}
x
k <- length(x[1,])
df <- as.data.frame(x)
(mylm <- lm(df))
(mysum <- summary(mylm))
if (n > n25) {
kp3 <- k + 3
nmkm3 <- n - k - 3
gqarr <- array(NA, dim=c(nmkm3-kp3+1,3))
numgqtests <- 0
numsignificant1 <- 0
numsignificant5 <- 0
numsignificant10 <- 0
for (mypoint in kp3:nmkm3) {
j <- 0
numgqtests <- numgqtests + 1
for (myalt in c('greater', 'two.sided', 'less')) {
j <- j + 1
gqarr[mypoint-kp3+1,j] <- gqtest(mylm, point=mypoint, alternative=myalt)$p.value
}
if (gqarr[mypoint-kp3+1,2] < 0.01) numsignificant1 <- numsignificant1 + 1
if (gqarr[mypoint-kp3+1,2] < 0.05) numsignificant5 <- numsignificant5 + 1
if (gqarr[mypoint-kp3+1,2] < 0.10) numsignificant10 <- numsignificant10 + 1
}
gqarr
}
bitmap(file='test0.png')
plot(x[,1], type='l', main='Actuals and Interpolation', ylab='value of Actuals and Interpolation (dots)', xlab='time or index')
points(x[,1]-mysum$resid)
grid()
dev.off()
bitmap(file='test1.png')
plot(mysum$resid, type='b', pch=19, main='Residuals', ylab='value of Residuals', xlab='time or index')
grid()
dev.off()
bitmap(file='test2.png')
hist(mysum$resid, main='Residual Histogram', xlab='values of Residuals')
grid()
dev.off()
bitmap(file='test3.png')
densityplot(~mysum$resid,col='black',main='Residual Density Plot', xlab='values of Residuals')
dev.off()
bitmap(file='test4.png')
qqnorm(mysum$resid, main='Residual Normal Q-Q Plot')
qqline(mysum$resid)
grid()
dev.off()
(myerror <- as.ts(mysum$resid))
bitmap(file='test5.png')
dum <- cbind(lag(myerror,k=1),myerror)
dum
dum1 <- dum[2:length(myerror),]
dum1
z <- as.data.frame(dum1)
z
plot(z,main=paste('Residual Lag plot, lowess, and regression line'), ylab='values of Residuals', xlab='lagged values of Residuals')
lines(lowess(z))
abline(lm(z))
grid()
dev.off()
bitmap(file='test6.png')
acf(mysum$resid, lag.max=length(mysum$resid)/2, main='Residual Autocorrelation Function')
grid()
dev.off()
bitmap(file='test7.png')
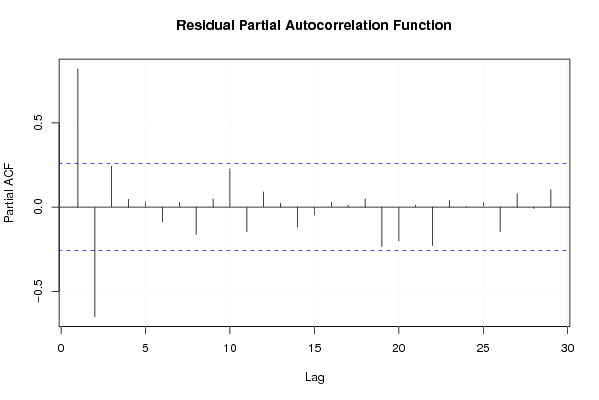
pacf(mysum$resid, lag.max=length(mysum$resid)/2, main='Residual Partial Autocorrelation Function')
grid()
dev.off()
bitmap(file='test8.png')
opar <- par(mfrow = c(2,2), oma = c(0, 0, 1.1, 0))
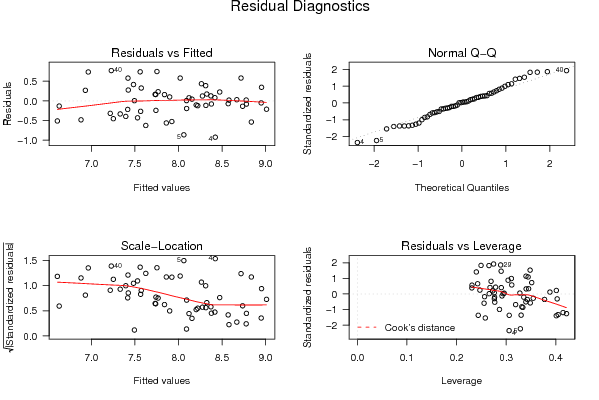
plot(mylm, las = 1, sub='Residual Diagnostics')
par(opar)
dev.off()
if (n > n25) {
bitmap(file='test9.png')
plot(kp3:nmkm3,gqarr[,2], main='Goldfeld-Quandt test',ylab='2-sided p-value',xlab='breakpoint')
grid()
dev.off()
}
load(file='createtable')
a<-table.start()
a<-table.row.start(a)
a<-table.element(a, 'Multiple Linear Regression - Estimated Regression Equation', 1, TRUE)
a<-table.row.end(a)
myeq <- colnames(x)[1]
myeq <- paste(myeq, '[t] = ', sep='')
for (i in 1:k){
if (mysum$coefficients[i,1] > 0) myeq <- paste(myeq, '+', '')
myeq <- paste(myeq, mysum$coefficients[i,1], sep=' ')
if (rownames(mysum$coefficients)[i] != '(Intercept)') {
myeq <- paste(myeq, rownames(mysum$coefficients)[i], sep='')
if (rownames(mysum$coefficients)[i] != 't') myeq <- paste(myeq, '[t]', sep='')
}
}
myeq <- paste(myeq, ' + e[t]')
a<-table.row.start(a)
a<-table.element(a, myeq)
a<-table.row.end(a)
a<-table.end(a)
table.save(a,file='mytable1.tab')
a<-table.start()
a<-table.row.start(a)
a<-table.element(a,hyperlink('ols1.htm','Multiple Linear Regression - Ordinary Least Squares',''), 6, TRUE)
a<-table.row.end(a)
a<-table.row.start(a)
a<-table.element(a,'Variable',header=TRUE)
a<-table.element(a,'Parameter',header=TRUE)
a<-table.element(a,'S.D.',header=TRUE)
a<-table.element(a,'T-STAT
H0: parameter = 0',header=TRUE)
a<-table.element(a,'2-tail p-value',header=TRUE)
a<-table.element(a,'1-tail p-value',header=TRUE)
a<-table.row.end(a)
for (i in 1:k){
a<-table.row.start(a)
a<-table.element(a,rownames(mysum$coefficients)[i],header=TRUE)
a<-table.element(a,mysum$coefficients[i,1])
a<-table.element(a, round(mysum$coefficients[i,2],6))
a<-table.element(a, round(mysum$coefficients[i,3],4))
a<-table.element(a, round(mysum$coefficients[i,4],6))
a<-table.element(a, round(mysum$coefficients[i,4]/2,6))
a<-table.row.end(a)
}
a<-table.end(a)
table.save(a,file='mytable2.tab')
a<-table.start()
a<-table.row.start(a)
a<-table.element(a, 'Multiple Linear Regression - Regression Statistics', 2, TRUE)
a<-table.row.end(a)
a<-table.row.start(a)
a<-table.element(a, 'Multiple R',1,TRUE)
a<-table.element(a, sqrt(mysum$r.squared))
a<-table.row.end(a)
a<-table.row.start(a)
a<-table.element(a, 'R-squared',1,TRUE)
a<-table.element(a, mysum$r.squared)
a<-table.row.end(a)
a<-table.row.start(a)
a<-table.element(a, 'Adjusted R-squared',1,TRUE)
a<-table.element(a, mysum$adj.r.squared)
a<-table.row.end(a)
a<-table.row.start(a)
a<-table.element(a, 'F-TEST (value)',1,TRUE)
a<-table.element(a, mysum$fstatistic[1])
a<-table.row.end(a)
a<-table.row.start(a)
a<-table.element(a, 'F-TEST (DF numerator)',1,TRUE)
a<-table.element(a, mysum$fstatistic[2])
a<-table.row.end(a)
a<-table.row.start(a)
a<-table.element(a, 'F-TEST (DF denominator)',1,TRUE)
a<-table.element(a, mysum$fstatistic[3])
a<-table.row.end(a)
a<-table.row.start(a)
a<-table.element(a, 'p-value',1,TRUE)
a<-table.element(a, 1-pf(mysum$fstatistic[1],mysum$fstatistic[2],mysum$fstatistic[3]))
a<-table.row.end(a)
a<-table.row.start(a)
a<-table.element(a, 'Multiple Linear Regression - Residual Statistics', 2, TRUE)
a<-table.row.end(a)
a<-table.row.start(a)
a<-table.element(a, 'Residual Standard Deviation',1,TRUE)
a<-table.element(a, mysum$sigma)
a<-table.row.end(a)
a<-table.row.start(a)
a<-table.element(a, 'Sum Squared Residuals',1,TRUE)
a<-table.element(a, sum(myerror*myerror))
a<-table.row.end(a)
a<-table.end(a)
table.save(a,file='mytable3.tab')
a<-table.start()
a<-table.row.start(a)
a<-table.element(a, 'Multiple Linear Regression - Actuals, Interpolation, and Residuals', 4, TRUE)
a<-table.row.end(a)
a<-table.row.start(a)
a<-table.element(a, 'Time or Index', 1, TRUE)
a<-table.element(a, 'Actuals', 1, TRUE)
a<-table.element(a, 'Interpolation
Forecast', 1, TRUE)
a<-table.element(a, 'Residuals
Prediction Error', 1, TRUE)
a<-table.row.end(a)
for (i in 1:n) {
a<-table.row.start(a)
a<-table.element(a,i, 1, TRUE)
a<-table.element(a,x[i])
a<-table.element(a,x[i]-mysum$resid[i])
a<-table.element(a,mysum$resid[i])
a<-table.row.end(a)
}
a<-table.end(a)
table.save(a,file='mytable4.tab')
if (n > n25) {
a<-table.start()
a<-table.row.start(a)
a<-table.element(a,'Goldfeld-Quandt test for Heteroskedasticity',4,TRUE)
a<-table.row.end(a)
a<-table.row.start(a)
a<-table.element(a,'p-values',header=TRUE)
a<-table.element(a,'Alternative Hypothesis',3,header=TRUE)
a<-table.row.end(a)
a<-table.row.start(a)
a<-table.element(a,'breakpoint index',header=TRUE)
a<-table.element(a,'greater',header=TRUE)
a<-table.element(a,'2-sided',header=TRUE)
a<-table.element(a,'less',header=TRUE)
a<-table.row.end(a)
for (mypoint in kp3:nmkm3) {
a<-table.row.start(a)
a<-table.element(a,mypoint,header=TRUE)
a<-table.element(a,gqarr[mypoint-kp3+1,1])
a<-table.element(a,gqarr[mypoint-kp3+1,2])
a<-table.element(a,gqarr[mypoint-kp3+1,3])
a<-table.row.end(a)
}
a<-table.end(a)
table.save(a,file='mytable5.tab')
a<-table.start()
a<-table.row.start(a)
a<-table.element(a,'Meta Analysis of Goldfeld-Quandt test for Heteroskedasticity',4,TRUE)
a<-table.row.end(a)
a<-table.row.start(a)
a<-table.element(a,'Description',header=TRUE)
a<-table.element(a,'# significant tests',header=TRUE)
a<-table.element(a,'% significant tests',header=TRUE)
a<-table.element(a,'OK/NOK',header=TRUE)
a<-table.row.end(a)
a<-table.row.start(a)
a<-table.element(a,'1% type I error level',header=TRUE)
a<-table.element(a,numsignificant1)
a<-table.element(a,numsignificant1/numgqtests)
if (numsignificant1/numgqtests < 0.01) dum <- 'OK' else dum <- 'NOK'
a<-table.element(a,dum)
a<-table.row.end(a)
a<-table.row.start(a)
a<-table.element(a,'5% type I error level',header=TRUE)
a<-table.element(a,numsignificant5)
a<-table.element(a,numsignificant5/numgqtests)
if (numsignificant5/numgqtests < 0.05) dum <- 'OK' else dum <- 'NOK'
a<-table.element(a,dum)
a<-table.row.end(a)
a<-table.row.start(a)
a<-table.element(a,'10% type I error level',header=TRUE)
a<-table.element(a,numsignificant10)
a<-table.element(a,numsignificant10/numgqtests)
if (numsignificant10/numgqtests < 0.1) dum <- 'OK' else dum <- 'NOK'
a<-table.element(a,dum)
a<-table.row.end(a)
a<-table.end(a)
table.save(a,file='mytable6.tab')
}