| Multiple Linear Regression - Estimated Regression Equation |
| Y[t] = + 1908.34256423337 -146.923839541267X[t] + 0.132370309355343Y1[t] + 0.298920931577709Y2[t] + 0.197607377657591Y3[t] + 0.0461259926980141Y4[t] -39.7638045813893M1[t] + 341.294589822638M2[t] -112.553653072054M3[t] -273.955286043913M4[t] -182.808803643698M5[t] + 122.834621812756M6[t] -212.273440315729M7[t] -9.44724396122535M8[t] + 216.52380839182M9[t] -57.7434273672878M10[t] + 97.313934049114M11[t] + 0.83515439869592t + e[t] |
| Multiple Linear Regression - Ordinary Least Squares | |||||
| Variable | Parameter | S.D. | T-STAT H0: parameter = 0 | 2-tail p-value | 1-tail p-value |
| (Intercept) | 1908.34256423337 | 640.878246 | 2.9777 | 0.004664 | 0.002332 |
| X | -146.923839541267 | 75.029451 | -1.9582 | 0.056421 | 0.028211 |
| Y1 | 0.132370309355343 | 0.144059 | 0.9189 | 0.363067 | 0.181534 |
| Y2 | 0.298920931577709 | 0.143257 | 2.0866 | 0.04262 | 0.02131 |
| Y3 | 0.197607377657591 | 0.143743 | 1.3747 | 0.176023 | 0.088012 |
| Y4 | 0.0461259926980141 | 0.142682 | 0.3233 | 0.747983 | 0.373991 |
| M1 | -39.7638045813893 | 162.334696 | -0.2449 | 0.807609 | 0.403805 |
| M2 | 341.294589822638 | 159.34315 | 2.1419 | 0.037651 | 0.018826 |
| M3 | -112.553653072054 | 163.535033 | -0.6883 | 0.494826 | 0.247413 |
| M4 | -273.955286043913 | 173.849323 | -1.5758 | 0.122072 | 0.061036 |
| M5 | -182.808803643698 | 173.783676 | -1.0519 | 0.298446 | 0.149223 |
| M6 | 122.834621812756 | 182.522511 | 0.673 | 0.504399 | 0.2522 |
| M7 | -212.273440315729 | 167.680618 | -1.2659 | 0.21205 | 0.106025 |
| M8 | -9.44724396122535 | 177.975635 | -0.0531 | 0.957902 | 0.478951 |
| M9 | 216.52380839182 | 169.471884 | 1.2776 | 0.207929 | 0.103965 |
| M10 | -57.7434273672878 | 170.39645 | -0.3389 | 0.736279 | 0.368139 |
| M11 | 97.313934049114 | 165.836684 | 0.5868 | 0.560267 | 0.280133 |
| t | 0.83515439869592 | 3.149202 | 0.2652 | 0.79207 | 0.396035 |
| Multiple Linear Regression - Regression Statistics | |
| Multiple R | 0.770206437096738 |
| R-squared | 0.593217955745252 |
| Adjusted R-squared | 0.439544739026792 |
| F-TEST (value) | 3.86025599263707 |
| F-TEST (DF numerator) | 17 |
| F-TEST (DF denominator) | 45 |
| p-value | 0.000144256639657669 |
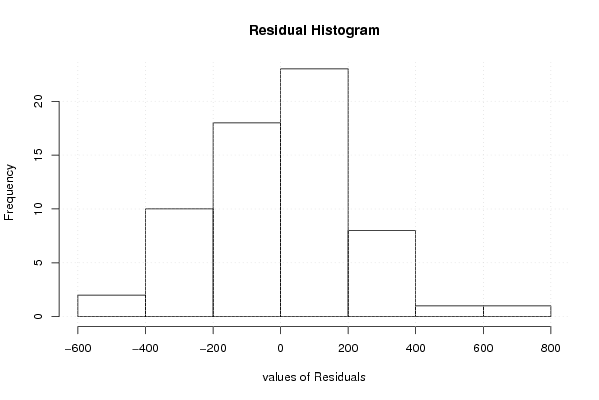
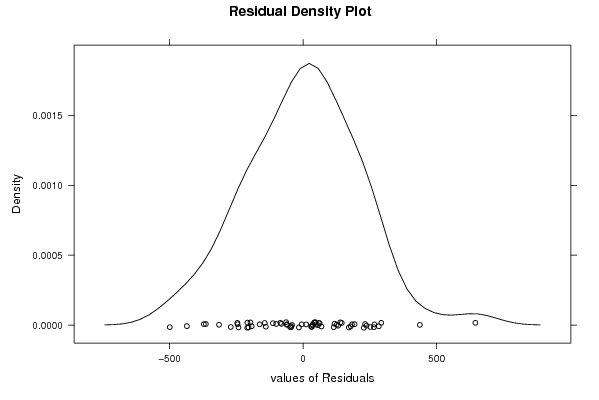
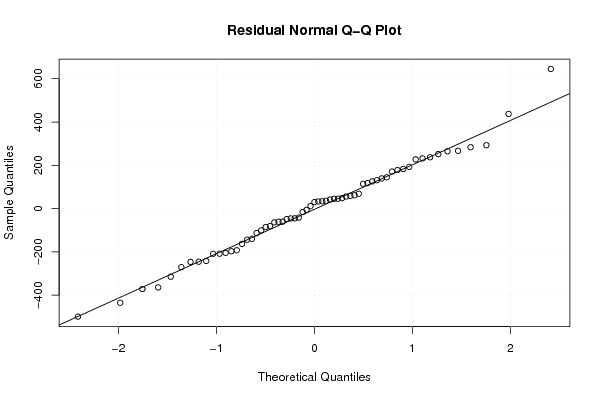
| Multiple Linear Regression - Residual Statistics | |
| Residual Standard Deviation | 248.870481174304 |
| Sum Squared Residuals | 2787143.23799682 |
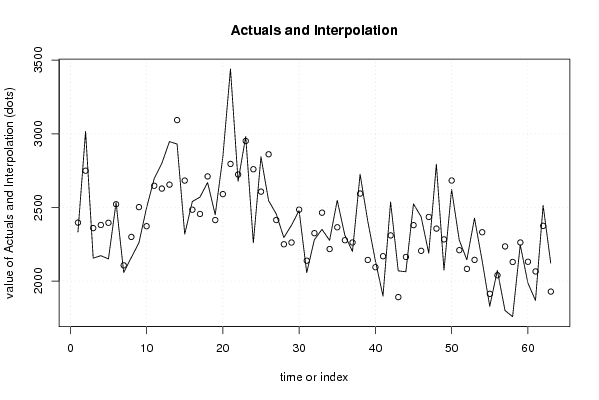
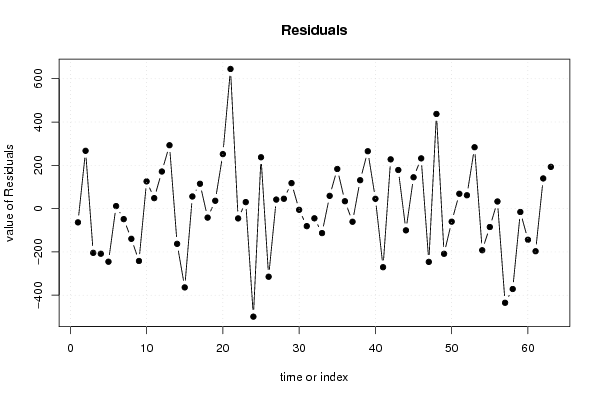
| Multiple Linear Regression - Actuals, Interpolation, and Residuals | |||
| Time or Index | Actuals | Interpolation Forecast | Residuals Prediction Error |
| 1 | 2333 | 2396.56698486062 | -63.5669848606249 |
| 2 | 3016 | 2749.05926183088 | 266.940738169117 |
| 3 | 2155 | 2359.26350003168 | -204.263500031677 |
| 4 | 2172 | 2380.40167412762 | -208.401674127618 |
| 5 | 2150 | 2395.29090306032 | -245.290903060322 |
| 6 | 2533 | 2521.22594093365 | 11.7740590663476 |
| 7 | 2058 | 2106.56514317468 | -48.5651431746786 |
| 8 | 2160 | 2299.50455752925 | -139.504557529245 |
| 9 | 2260 | 2501.87871504757 | -241.878715047574 |
| 10 | 2498 | 2372.28495790913 | 125.715042090873 |
| 11 | 2695 | 2646.58934231459 | 48.4106576854081 |
| 12 | 2799 | 2627.71913248125 | 171.280867518752 |
| 13 | 2947 | 2654.31803732812 | 292.68196267188 |
| 14 | 2930 | 3092.71965659781 | -162.719656597808 |
| 15 | 2318 | 2681.94979064592 | -363.949790645917 |
| 16 | 2540 | 2484.02640599851 | 55.9735940014934 |
| 17 | 2570 | 2455.30673075613 | 114.693269243873 |
| 18 | 2669 | 2710.39700969988 | -41.3970096998761 |
| 19 | 2450 | 2413.8361208524 | 36.1638791476022 |
| 20 | 2842 | 2590.19258592928 | 251.807414070723 |
| 21 | 3440 | 2794.98641219358 | 645.013587806417 |
| 22 | 2678 | 2723.2563904386 | -45.2563904385997 |
| 23 | 2981 | 2950.93602747867 | 30.0639725213271 |
| 24 | 2260 | 2758.96115081519 | -498.96115081519 |
| 25 | 2844 | 2606.86545566779 | 237.134544332205 |
| 26 | 2546 | 2860.57591850675 | -314.575918506747 |
| 27 | 2456 | 2414.18755836062 | 41.8124416393841 |
| 28 | 2295 | 2249.46756610621 | 45.5324338937941 |
| 29 | 2379 | 2261.28528045059 | 117.714719549409 |
| 30 | 2479 | 2484.53410254026 | -5.53410254026057 |
| 31 | 2057 | 2137.94907289871 | -80.9490728987129 |
| 32 | 2280 | 2324.81498116059 | -44.8149811605859 |
| 33 | 2351 | 2463.93807097104 | -112.938070971041 |
| 34 | 2276 | 2217.17070312324 | 58.8292968767611 |
| 35 | 2548 | 2364.88295631540 | 183.117043684596 |
| 36 | 2311 | 2276.92128321840 | 34.0787167815963 |
| 37 | 2201 | 2261.68937131074 | -60.6893713107438 |
| 38 | 2725 | 2593.77529861685 | 131.224701383151 |
| 39 | 2408 | 2142.95627125852 | 265.043728741484 |
| 40 | 2139 | 2093.77906886292 | 45.2209311370826 |
| 41 | 1898 | 2168.55994778503 | -270.559947785030 |
| 42 | 2537 | 2309.56364999331 | 227.436350006685 |
| 43 | 2069 | 1890.67233324795 | 178.327666752054 |
| 44 | 2063 | 2163.36358444976 | -100.363584449756 |
| 45 | 2524 | 2379.32770740410 | 144.672292595896 |
| 46 | 2437 | 2204.96575733620 | 232.034242663796 |
| 47 | 2189 | 2434.98722893784 | -245.987228937841 |
| 48 | 2793 | 2355.80235270987 | 437.197647290128 |
| 49 | 2074 | 2282.68806726173 | -208.688067261728 |
| 50 | 2622 | 2682.24363133296 | -60.2436313329591 |
| 51 | 2278 | 2209.45331642952 | 68.5466835704769 |
| 52 | 2144 | 2082.32528490475 | 61.6747150952481 |
| 53 | 2427 | 2143.55713794793 | 283.44286205207 |
| 54 | 2139 | 2331.27929683290 | -192.279296832896 |
| 55 | 1828 | 1912.97732982626 | -84.9773298262642 |
| 56 | 2072 | 2039.12429093114 | 32.8757090688638 |
| 57 | 1800 | 2234.8690943837 | -434.869094383699 |
| 58 | 1758 | 2129.32219119283 | -371.32219119283 |
| 59 | 2246 | 2261.60444495349 | -15.6044449534901 |
| 60 | 1987 | 2130.59608077529 | -143.596080775286 |
| 61 | 1868 | 2064.87208357099 | -196.872083570988 |
| 62 | 2514 | 2374.62623311475 | 139.373766885247 |
| 63 | 2121 | 1928.18956327375 | 192.810436726250 |
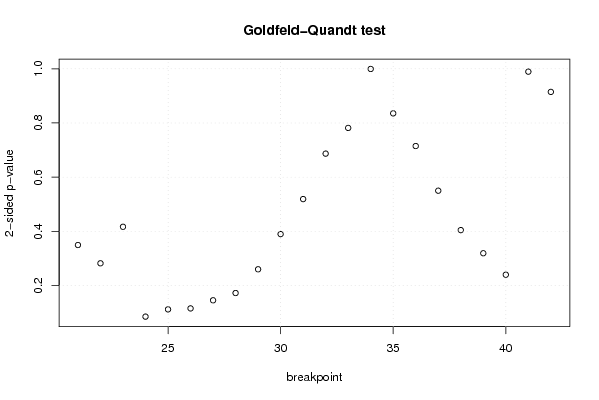
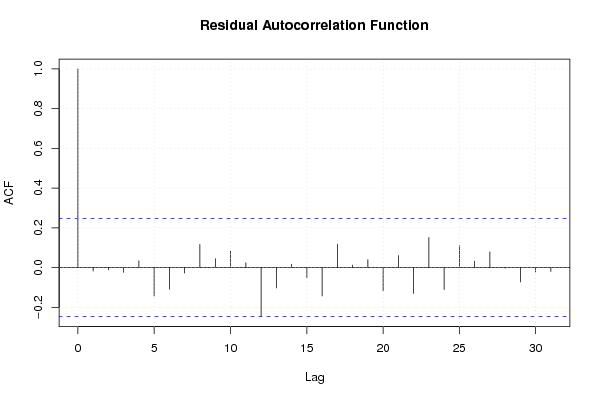
| Goldfeld-Quandt test for Heteroskedasticity | |||
| p-values | Alternative Hypothesis | ||
| breakpoint index | greater | 2-sided | less |
| 21 | 0.825212355021587 | 0.349575289956825 | 0.174787644978413 |
| 22 | 0.858949441711827 | 0.282101116576346 | 0.141050558288173 |
| 23 | 0.791595928389769 | 0.416808143220462 | 0.208404071610231 |
| 24 | 0.957406188576975 | 0.0851876228460509 | 0.0425938114230255 |
| 25 | 0.94395716842698 | 0.112085663146038 | 0.0560428315730191 |
| 26 | 0.94216959952776 | 0.115660800944479 | 0.0578304004722397 |
| 27 | 0.927210191384536 | 0.145579617230928 | 0.0727898086154642 |
| 28 | 0.913818671917258 | 0.172362656165484 | 0.086181328082742 |
| 29 | 0.869985179722445 | 0.260029640555111 | 0.130014820277555 |
| 30 | 0.805110141942565 | 0.38977971611487 | 0.194889858057435 |
| 31 | 0.740417138613688 | 0.519165722772624 | 0.259582861386312 |
| 32 | 0.656559372640131 | 0.686881254719738 | 0.343440627359869 |
| 33 | 0.609160999899182 | 0.781678000201637 | 0.390839000100818 |
| 34 | 0.499708933842118 | 0.999417867684236 | 0.500291066157882 |
| 35 | 0.417785875573437 | 0.835571751146873 | 0.582214124426563 |
| 36 | 0.357424181810451 | 0.714848363620902 | 0.642575818189549 |
| 37 | 0.275019319611941 | 0.550038639223881 | 0.72498068038806 |
| 38 | 0.202309510750471 | 0.404619021500942 | 0.797690489249529 |
| 39 | 0.159617082590241 | 0.319234165180482 | 0.84038291740976 |
| 40 | 0.119956850214705 | 0.23991370042941 | 0.880043149785295 |
| 41 | 0.494708392647941 | 0.989416785295883 | 0.505291607352059 |
| 42 | 0.542633875165045 | 0.91473224966991 | 0.457366124834955 |
| Meta Analysis of Goldfeld-Quandt test for Heteroskedasticity | |||
| Description | # significant tests | % significant tests | OK/NOK |
| 1% type I error level | 0 | 0 | OK |
| 5% type I error level | 0 | 0 | OK |
| 10% type I error level | 1 | 0.0454545454545455 | OK |