Free Statistics

of Irreproducible Research!

Author's title

Author*The author of this computation has been verified*
R Software Modulerwasp_multipleregression.wasp
Title produced by softwareMultiple Regression
Date of computationFri, 20 Nov 2009 12:02:41 -0700
Cite this page as followsStatistical Computations at FreeStatistics.org, Office for Research Development and Education, URL https://freestatistics.org/blog/index.php?v=date/2009/Nov/20/t1258743799y36iobykno4khnh.htm/, Retrieved Tue, 23 Apr 2024 23:07:44 +0000
Statistical Computations at FreeStatistics.org, Office for Research Development and Education, URL https://freestatistics.org/blog/index.php?pk=58425, Retrieved Tue, 23 Apr 2024 23:07:44 +0000
QR Codes:

Original text written by user:
IsPrivate?No (this computation is public)
User-defined keywords
Estimated Impact133
Family? (F = Feedback message, R = changed R code, M = changed R Module, P = changed Parameters, D = changed Data)
-     [Multiple Regression] [Q1 The Seatbeltlaw] [2007-11-14 19:27:43] [8cd6641b921d30ebe00b648d1481bba0]
- RM D  [Multiple Regression] [Seatbelt] [2009-11-12 14:10:54] [b98453cac15ba1066b407e146608df68]
-    D      [Multiple Regression] [ws7 4] [2009-11-20 19:02:41] [d41d8cd98f00b204e9800998ecf8427e] [Current]
Feedback Forum

Post a new message
Dataseries X:
2333	8	2355	2825	2214	2360
3016	8	2333	2355	2825	2214
2155	7.7	3016	2333	2355	2825
2172	6.9	2155	3016	2333	2355
2150	6.6	2172	2155	3016	2333
2533	6.9	2150	2172	2155	3016
2058	7.5	2533	2150	2172	2155
2160	7.9	2058	2533	2150	2172
2260	7.7	2160	2058	2533	2150
2498	6.5	2260	2160	2058	2533
2695	6.1	2498	2260	2160	2058
2799	6.4	2695	2498	2260	2160
2947	6.8	2799	2695	2498	2260
2930	7.1	2947	2799	2695	2498
2318	7.3	2930	2947	2799	2695
2540	7.2	2318	2930	2947	2799
2570	7	2540	2318	2930	2947
2669	7	2570	2540	2318	2930
2450	7	2669	2570	2540	2318
2842	7.3	2450	2669	2570	2540
3440	7.5	2842	2450	2669	2570
2678	7.2	3440	2842	2450	2669
2981	7.7	2678	3440	2842	2450
2260	8	2981	2678	3440	2842
2844	7.9	2260	2981	2678	3440
2546	8	2844	2260	2981	2678
2456	8	2546	2844	2260	2981
2295	7.9	2456	2546	2844	2260
2379	7.9	2295	2456	2546	2844
2479	8	2379	2295	2456	2546
2057	8.1	2479	2379	2295	2456
2280	8.1	2057	2479	2379	2295
2351	8.2	2280	2057	2479	2379
2276	8	2351	2280	2057	2479
2548	8.3	2276	2351	2280	2057
2311	8.5	2548	2276	2351	2280
2201	8.6	2311	2548	2276	2351
2725	8.7	2201	2311	2548	2276
2408	8.7	2725	2201	2311	2548
2139	8.5	2408	2725	2201	2311
1898	8.4	2139	2408	2725	2201
2537	8.5	1898	2139	2408	2725
2069	8.7	2537	1898	2139	2408
2063	8.7	2069	2537	1898	2139
2524	8.6	2063	2069	2537	1898
2437	7.9	2524	2063	2069	2537
2189	8.1	2437	2524	2063	2069
2793	8.2	2189	2437	2524	2063
2074	8.5	2793	2189	2437	2524
2622	8.6	2074	2793	2189	2437
2278	8.5	2622	2074	2793	2189
2144	8.3	2278	2622	2074	2793
2427	8.2	2144	2278	2622	2074
2139	8.7	2427	2144	2278	2622
1828	9.3	2139	2427	2144	2278
2072	9.3	1828	2139	2427	2144
1800	8.8	2072	1828	2139	2427
1758	7.4	1800	2072	1828	2139
2246	7.2	1758	1800	2072	1828
1987	7.5	2246	1758	1800	2072
1868	8.3	1987	2246	1758	1800
2514	8.8	1868	1987	2246	1758
2121	8.9	2514	1868	1987	2246


Summary of computational transaction
Raw Inputview raw input (R code)
Raw Outputview raw output of R engine
Computing time3 seconds
R Server'Gwilym Jenkins' @ 72.249.127.135

\begin{tabular}{lllllllll}
\hline
Summary of computational transaction \tabularnewline
Raw Input & view raw input (R code)  \tabularnewline
Raw Output & view raw output of R engine  \tabularnewline
Computing time & 3 seconds \tabularnewline
R Server & 'Gwilym Jenkins' @ 72.249.127.135 \tabularnewline
\hline
\end{tabular}
%Source: https://freestatistics.org/blog/index.php?pk=58425&T=0

[TABLE]
[ROW][C]Summary of computational transaction[/C][/ROW]
[ROW][C]Raw Input[/C][C]view raw input (R code) [/C][/ROW]
[ROW][C]Raw Output[/C][C]view raw output of R engine [/C][/ROW]
[ROW][C]Computing time[/C][C]3 seconds[/C][/ROW]
[ROW][C]R Server[/C][C]'Gwilym Jenkins' @ 72.249.127.135[/C][/ROW]
[/TABLE]
Source: https://freestatistics.org/blog/index.php?pk=58425&T=0

Globally Unique Identifier (entire table): ba.freestatistics.org/blog/index.php?pk=58425&T=0

As an alternative you can also use a QR Code:  

The GUIDs for individual cells are displayed in the table below:

Summary of computational transaction
Raw Inputview raw input (R code)
Raw Outputview raw output of R engine
Computing time3 seconds
R Server'Gwilym Jenkins' @ 72.249.127.135


Multiple Linear Regression - Estimated Regression Equation
Y[t] = + 1908.34256423337 -146.923839541267X[t] + 0.132370309355343Y1[t] + 0.298920931577709Y2[t] + 0.197607377657591Y3[t] + 0.0461259926980141Y4[t] -39.7638045813893M1[t] + 341.294589822638M2[t] -112.553653072054M3[t] -273.955286043913M4[t] -182.808803643698M5[t] + 122.834621812756M6[t] -212.273440315729M7[t] -9.44724396122535M8[t] + 216.52380839182M9[t] -57.7434273672878M10[t] + 97.313934049114M11[t] + 0.83515439869592t + e[t]

\begin{tabular}{lllllllll}
\hline
Multiple Linear Regression - Estimated Regression Equation \tabularnewline
Y[t] =  +  1908.34256423337 -146.923839541267X[t] +  0.132370309355343Y1[t] +  0.298920931577709Y2[t] +  0.197607377657591Y3[t] +  0.0461259926980141Y4[t] -39.7638045813893M1[t] +  341.294589822638M2[t] -112.553653072054M3[t] -273.955286043913M4[t] -182.808803643698M5[t] +  122.834621812756M6[t] -212.273440315729M7[t] -9.44724396122535M8[t] +  216.52380839182M9[t] -57.7434273672878M10[t] +  97.313934049114M11[t] +  0.83515439869592t  + e[t] \tabularnewline
\hline
\end{tabular}
%Source: https://freestatistics.org/blog/index.php?pk=58425&T=1

[TABLE]
[ROW][C]Multiple Linear Regression - Estimated Regression Equation[/C][/ROW]
[ROW][C]Y[t] =  +  1908.34256423337 -146.923839541267X[t] +  0.132370309355343Y1[t] +  0.298920931577709Y2[t] +  0.197607377657591Y3[t] +  0.0461259926980141Y4[t] -39.7638045813893M1[t] +  341.294589822638M2[t] -112.553653072054M3[t] -273.955286043913M4[t] -182.808803643698M5[t] +  122.834621812756M6[t] -212.273440315729M7[t] -9.44724396122535M8[t] +  216.52380839182M9[t] -57.7434273672878M10[t] +  97.313934049114M11[t] +  0.83515439869592t  + e[t][/C][/ROW]
[/TABLE]
Source: https://freestatistics.org/blog/index.php?pk=58425&T=1

Globally Unique Identifier (entire table): ba.freestatistics.org/blog/index.php?pk=58425&T=1

As an alternative you can also use a QR Code:  

The GUIDs for individual cells are displayed in the table below:

Multiple Linear Regression - Estimated Regression Equation
Y[t] = + 1908.34256423337 -146.923839541267X[t] + 0.132370309355343Y1[t] + 0.298920931577709Y2[t] + 0.197607377657591Y3[t] + 0.0461259926980141Y4[t] -39.7638045813893M1[t] + 341.294589822638M2[t] -112.553653072054M3[t] -273.955286043913M4[t] -182.808803643698M5[t] + 122.834621812756M6[t] -212.273440315729M7[t] -9.44724396122535M8[t] + 216.52380839182M9[t] -57.7434273672878M10[t] + 97.313934049114M11[t] + 0.83515439869592t + e[t]


Multiple Linear Regression - Ordinary Least Squares
VariableParameterS.D.T-STATH0: parameter = 02-tail p-value1-tail p-value
(Intercept)1908.34256423337640.8782462.97770.0046640.002332
X-146.92383954126775.029451-1.95820.0564210.028211
Y10.1323703093553430.1440590.91890.3630670.181534
Y20.2989209315777090.1432572.08660.042620.02131
Y30.1976073776575910.1437431.37470.1760230.088012
Y40.04612599269801410.1426820.32330.7479830.373991
M1-39.7638045813893162.334696-0.24490.8076090.403805
M2341.294589822638159.343152.14190.0376510.018826
M3-112.553653072054163.535033-0.68830.4948260.247413
M4-273.955286043913173.849323-1.57580.1220720.061036
M5-182.808803643698173.783676-1.05190.2984460.149223
M6122.834621812756182.5225110.6730.5043990.2522
M7-212.273440315729167.680618-1.26590.212050.106025
M8-9.44724396122535177.975635-0.05310.9579020.478951
M9216.52380839182169.4718841.27760.2079290.103965
M10-57.7434273672878170.39645-0.33890.7362790.368139
M1197.313934049114165.8366840.58680.5602670.280133
t0.835154398695923.1492020.26520.792070.396035

\begin{tabular}{lllllllll}
\hline
Multiple Linear Regression - Ordinary Least Squares \tabularnewline
Variable & Parameter & S.D. & T-STATH0: parameter = 0 & 2-tail p-value & 1-tail p-value \tabularnewline
(Intercept) & 1908.34256423337 & 640.878246 & 2.9777 & 0.004664 & 0.002332 \tabularnewline
X & -146.923839541267 & 75.029451 & -1.9582 & 0.056421 & 0.028211 \tabularnewline
Y1 & 0.132370309355343 & 0.144059 & 0.9189 & 0.363067 & 0.181534 \tabularnewline
Y2 & 0.298920931577709 & 0.143257 & 2.0866 & 0.04262 & 0.02131 \tabularnewline
Y3 & 0.197607377657591 & 0.143743 & 1.3747 & 0.176023 & 0.088012 \tabularnewline
Y4 & 0.0461259926980141 & 0.142682 & 0.3233 & 0.747983 & 0.373991 \tabularnewline
M1 & -39.7638045813893 & 162.334696 & -0.2449 & 0.807609 & 0.403805 \tabularnewline
M2 & 341.294589822638 & 159.34315 & 2.1419 & 0.037651 & 0.018826 \tabularnewline
M3 & -112.553653072054 & 163.535033 & -0.6883 & 0.494826 & 0.247413 \tabularnewline
M4 & -273.955286043913 & 173.849323 & -1.5758 & 0.122072 & 0.061036 \tabularnewline
M5 & -182.808803643698 & 173.783676 & -1.0519 & 0.298446 & 0.149223 \tabularnewline
M6 & 122.834621812756 & 182.522511 & 0.673 & 0.504399 & 0.2522 \tabularnewline
M7 & -212.273440315729 & 167.680618 & -1.2659 & 0.21205 & 0.106025 \tabularnewline
M8 & -9.44724396122535 & 177.975635 & -0.0531 & 0.957902 & 0.478951 \tabularnewline
M9 & 216.52380839182 & 169.471884 & 1.2776 & 0.207929 & 0.103965 \tabularnewline
M10 & -57.7434273672878 & 170.39645 & -0.3389 & 0.736279 & 0.368139 \tabularnewline
M11 & 97.313934049114 & 165.836684 & 0.5868 & 0.560267 & 0.280133 \tabularnewline
t & 0.83515439869592 & 3.149202 & 0.2652 & 0.79207 & 0.396035 \tabularnewline
\hline
\end{tabular}
%Source: https://freestatistics.org/blog/index.php?pk=58425&T=2

[TABLE]
[ROW][C]Multiple Linear Regression - Ordinary Least Squares[/C][/ROW]
[ROW][C]Variable[/C][C]Parameter[/C][C]S.D.[/C][C]T-STATH0: parameter = 0[/C][C]2-tail p-value[/C][C]1-tail p-value[/C][/ROW]
[ROW][C](Intercept)[/C][C]1908.34256423337[/C][C]640.878246[/C][C]2.9777[/C][C]0.004664[/C][C]0.002332[/C][/ROW]
[ROW][C]X[/C][C]-146.923839541267[/C][C]75.029451[/C][C]-1.9582[/C][C]0.056421[/C][C]0.028211[/C][/ROW]
[ROW][C]Y1[/C][C]0.132370309355343[/C][C]0.144059[/C][C]0.9189[/C][C]0.363067[/C][C]0.181534[/C][/ROW]
[ROW][C]Y2[/C][C]0.298920931577709[/C][C]0.143257[/C][C]2.0866[/C][C]0.04262[/C][C]0.02131[/C][/ROW]
[ROW][C]Y3[/C][C]0.197607377657591[/C][C]0.143743[/C][C]1.3747[/C][C]0.176023[/C][C]0.088012[/C][/ROW]
[ROW][C]Y4[/C][C]0.0461259926980141[/C][C]0.142682[/C][C]0.3233[/C][C]0.747983[/C][C]0.373991[/C][/ROW]
[ROW][C]M1[/C][C]-39.7638045813893[/C][C]162.334696[/C][C]-0.2449[/C][C]0.807609[/C][C]0.403805[/C][/ROW]
[ROW][C]M2[/C][C]341.294589822638[/C][C]159.34315[/C][C]2.1419[/C][C]0.037651[/C][C]0.018826[/C][/ROW]
[ROW][C]M3[/C][C]-112.553653072054[/C][C]163.535033[/C][C]-0.6883[/C][C]0.494826[/C][C]0.247413[/C][/ROW]
[ROW][C]M4[/C][C]-273.955286043913[/C][C]173.849323[/C][C]-1.5758[/C][C]0.122072[/C][C]0.061036[/C][/ROW]
[ROW][C]M5[/C][C]-182.808803643698[/C][C]173.783676[/C][C]-1.0519[/C][C]0.298446[/C][C]0.149223[/C][/ROW]
[ROW][C]M6[/C][C]122.834621812756[/C][C]182.522511[/C][C]0.673[/C][C]0.504399[/C][C]0.2522[/C][/ROW]
[ROW][C]M7[/C][C]-212.273440315729[/C][C]167.680618[/C][C]-1.2659[/C][C]0.21205[/C][C]0.106025[/C][/ROW]
[ROW][C]M8[/C][C]-9.44724396122535[/C][C]177.975635[/C][C]-0.0531[/C][C]0.957902[/C][C]0.478951[/C][/ROW]
[ROW][C]M9[/C][C]216.52380839182[/C][C]169.471884[/C][C]1.2776[/C][C]0.207929[/C][C]0.103965[/C][/ROW]
[ROW][C]M10[/C][C]-57.7434273672878[/C][C]170.39645[/C][C]-0.3389[/C][C]0.736279[/C][C]0.368139[/C][/ROW]
[ROW][C]M11[/C][C]97.313934049114[/C][C]165.836684[/C][C]0.5868[/C][C]0.560267[/C][C]0.280133[/C][/ROW]
[ROW][C]t[/C][C]0.83515439869592[/C][C]3.149202[/C][C]0.2652[/C][C]0.79207[/C][C]0.396035[/C][/ROW]
[/TABLE]
Source: https://freestatistics.org/blog/index.php?pk=58425&T=2

Globally Unique Identifier (entire table): ba.freestatistics.org/blog/index.php?pk=58425&T=2

As an alternative you can also use a QR Code:  

The GUIDs for individual cells are displayed in the table below:

Multiple Linear Regression - Ordinary Least Squares
VariableParameterS.D.T-STATH0: parameter = 02-tail p-value1-tail p-value
(Intercept)1908.34256423337640.8782462.97770.0046640.002332
X-146.92383954126775.029451-1.95820.0564210.028211
Y10.1323703093553430.1440590.91890.3630670.181534
Y20.2989209315777090.1432572.08660.042620.02131
Y30.1976073776575910.1437431.37470.1760230.088012
Y40.04612599269801410.1426820.32330.7479830.373991
M1-39.7638045813893162.334696-0.24490.8076090.403805
M2341.294589822638159.343152.14190.0376510.018826
M3-112.553653072054163.535033-0.68830.4948260.247413
M4-273.955286043913173.849323-1.57580.1220720.061036
M5-182.808803643698173.783676-1.05190.2984460.149223
M6122.834621812756182.5225110.6730.5043990.2522
M7-212.273440315729167.680618-1.26590.212050.106025
M8-9.44724396122535177.975635-0.05310.9579020.478951
M9216.52380839182169.4718841.27760.2079290.103965
M10-57.7434273672878170.39645-0.33890.7362790.368139
M1197.313934049114165.8366840.58680.5602670.280133
t0.835154398695923.1492020.26520.792070.396035


Multiple Linear Regression - Regression Statistics
Multiple R0.770206437096738
R-squared0.593217955745252
Adjusted R-squared0.439544739026792
F-TEST (value)3.86025599263707
F-TEST (DF numerator)17
F-TEST (DF denominator)45
p-value0.000144256639657669
Multiple Linear Regression - Residual Statistics
Residual Standard Deviation248.870481174304
Sum Squared Residuals2787143.23799682

\begin{tabular}{lllllllll}
\hline
Multiple Linear Regression - Regression Statistics \tabularnewline
Multiple R & 0.770206437096738 \tabularnewline
R-squared & 0.593217955745252 \tabularnewline
Adjusted R-squared & 0.439544739026792 \tabularnewline
F-TEST (value) & 3.86025599263707 \tabularnewline
F-TEST (DF numerator) & 17 \tabularnewline
F-TEST (DF denominator) & 45 \tabularnewline
p-value & 0.000144256639657669 \tabularnewline
Multiple Linear Regression - Residual Statistics \tabularnewline
Residual Standard Deviation & 248.870481174304 \tabularnewline
Sum Squared Residuals & 2787143.23799682 \tabularnewline
\hline
\end{tabular}
%Source: https://freestatistics.org/blog/index.php?pk=58425&T=3

[TABLE]
[ROW][C]Multiple Linear Regression - Regression Statistics[/C][/ROW]
[ROW][C]Multiple R[/C][C]0.770206437096738[/C][/ROW]
[ROW][C]R-squared[/C][C]0.593217955745252[/C][/ROW]
[ROW][C]Adjusted R-squared[/C][C]0.439544739026792[/C][/ROW]
[ROW][C]F-TEST (value)[/C][C]3.86025599263707[/C][/ROW]
[ROW][C]F-TEST (DF numerator)[/C][C]17[/C][/ROW]
[ROW][C]F-TEST (DF denominator)[/C][C]45[/C][/ROW]
[ROW][C]p-value[/C][C]0.000144256639657669[/C][/ROW]
[ROW][C]Multiple Linear Regression - Residual Statistics[/C][/ROW]
[ROW][C]Residual Standard Deviation[/C][C]248.870481174304[/C][/ROW]
[ROW][C]Sum Squared Residuals[/C][C]2787143.23799682[/C][/ROW]
[/TABLE]
Source: https://freestatistics.org/blog/index.php?pk=58425&T=3

Globally Unique Identifier (entire table): ba.freestatistics.org/blog/index.php?pk=58425&T=3

As an alternative you can also use a QR Code:  

The GUIDs for individual cells are displayed in the table below:

Multiple Linear Regression - Regression Statistics
Multiple R0.770206437096738
R-squared0.593217955745252
Adjusted R-squared0.439544739026792
F-TEST (value)3.86025599263707
F-TEST (DF numerator)17
F-TEST (DF denominator)45
p-value0.000144256639657669
Multiple Linear Regression - Residual Statistics
Residual Standard Deviation248.870481174304
Sum Squared Residuals2787143.23799682


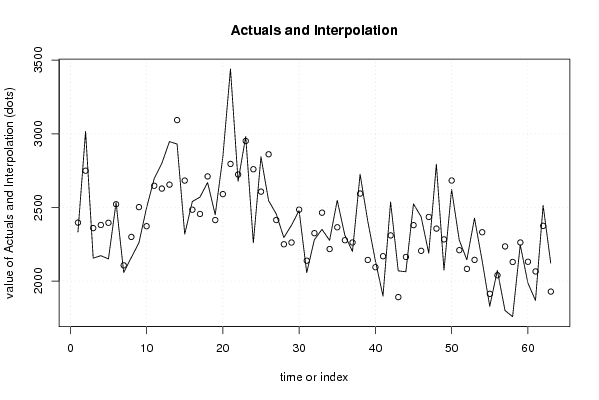
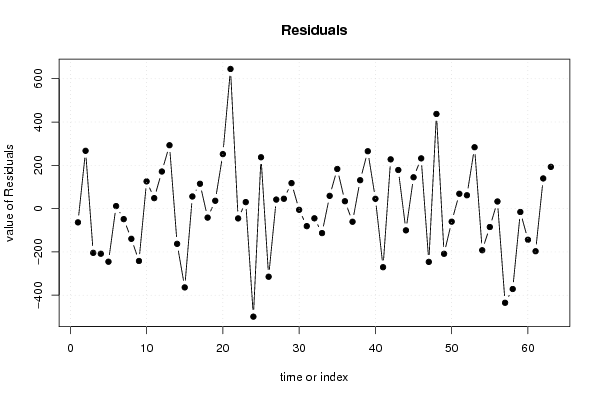
Multiple Linear Regression - Actuals, Interpolation, and Residuals
Time or IndexActualsInterpolationForecastResidualsPrediction Error
123332396.56698486062-63.5669848606249
230162749.05926183088266.940738169117
321552359.26350003168-204.263500031677
421722380.40167412762-208.401674127618
521502395.29090306032-245.290903060322
625332521.2259409336511.7740590663476
720582106.56514317468-48.5651431746786
821602299.50455752925-139.504557529245
922602501.87871504757-241.878715047574
1024982372.28495790913125.715042090873
1126952646.5893423145948.4106576854081
1227992627.71913248125171.280867518752
1329472654.31803732812292.68196267188
1429303092.71965659781-162.719656597808
1523182681.94979064592-363.949790645917
1625402484.0264059985155.9735940014934
1725702455.30673075613114.693269243873
1826692710.39700969988-41.3970096998761
1924502413.836120852436.1638791476022
2028422590.19258592928251.807414070723
2134402794.98641219358645.013587806417
2226782723.2563904386-45.2563904385997
2329812950.9360274786730.0639725213271
2422602758.96115081519-498.96115081519
2528442606.86545566779237.134544332205
2625462860.57591850675-314.575918506747
2724562414.1875583606241.8124416393841
2822952249.4675661062145.5324338937941
2923792261.28528045059117.714719549409
3024792484.53410254026-5.53410254026057
3120572137.94907289871-80.9490728987129
3222802324.81498116059-44.8149811605859
3323512463.93807097104-112.938070971041
3422762217.1707031232458.8292968767611
3525482364.88295631540183.117043684596
3623112276.9212832184034.0787167815963
3722012261.68937131074-60.6893713107438
3827252593.77529861685131.224701383151
3924082142.95627125852265.043728741484
4021392093.7790688629245.2209311370826
4118982168.55994778503-270.559947785030
4225372309.56364999331227.436350006685
4320691890.67233324795178.327666752054
4420632163.36358444976-100.363584449756
4525242379.32770740410144.672292595896
4624372204.96575733620232.034242663796
4721892434.98722893784-245.987228937841
4827932355.80235270987437.197647290128
4920742282.68806726173-208.688067261728
5026222682.24363133296-60.2436313329591
5122782209.4533164295268.5466835704769
5221442082.3252849047561.6747150952481
5324272143.55713794793283.44286205207
5421392331.27929683290-192.279296832896
5518281912.97732982626-84.9773298262642
5620722039.1242909311432.8757090688638
5718002234.8690943837-434.869094383699
5817582129.32219119283-371.32219119283
5922462261.60444495349-15.6044449534901
6019872130.59608077529-143.596080775286
6118682064.87208357099-196.872083570988
6225142374.62623311475139.373766885247
6321211928.18956327375192.810436726250

\begin{tabular}{lllllllll}
\hline
Multiple Linear Regression - Actuals, Interpolation, and Residuals \tabularnewline
Time or Index & Actuals & InterpolationForecast & ResidualsPrediction Error \tabularnewline
1 & 2333 & 2396.56698486062 & -63.5669848606249 \tabularnewline
2 & 3016 & 2749.05926183088 & 266.940738169117 \tabularnewline
3 & 2155 & 2359.26350003168 & -204.263500031677 \tabularnewline
4 & 2172 & 2380.40167412762 & -208.401674127618 \tabularnewline
5 & 2150 & 2395.29090306032 & -245.290903060322 \tabularnewline
6 & 2533 & 2521.22594093365 & 11.7740590663476 \tabularnewline
7 & 2058 & 2106.56514317468 & -48.5651431746786 \tabularnewline
8 & 2160 & 2299.50455752925 & -139.504557529245 \tabularnewline
9 & 2260 & 2501.87871504757 & -241.878715047574 \tabularnewline
10 & 2498 & 2372.28495790913 & 125.715042090873 \tabularnewline
11 & 2695 & 2646.58934231459 & 48.4106576854081 \tabularnewline
12 & 2799 & 2627.71913248125 & 171.280867518752 \tabularnewline
13 & 2947 & 2654.31803732812 & 292.68196267188 \tabularnewline
14 & 2930 & 3092.71965659781 & -162.719656597808 \tabularnewline
15 & 2318 & 2681.94979064592 & -363.949790645917 \tabularnewline
16 & 2540 & 2484.02640599851 & 55.9735940014934 \tabularnewline
17 & 2570 & 2455.30673075613 & 114.693269243873 \tabularnewline
18 & 2669 & 2710.39700969988 & -41.3970096998761 \tabularnewline
19 & 2450 & 2413.8361208524 & 36.1638791476022 \tabularnewline
20 & 2842 & 2590.19258592928 & 251.807414070723 \tabularnewline
21 & 3440 & 2794.98641219358 & 645.013587806417 \tabularnewline
22 & 2678 & 2723.2563904386 & -45.2563904385997 \tabularnewline
23 & 2981 & 2950.93602747867 & 30.0639725213271 \tabularnewline
24 & 2260 & 2758.96115081519 & -498.96115081519 \tabularnewline
25 & 2844 & 2606.86545566779 & 237.134544332205 \tabularnewline
26 & 2546 & 2860.57591850675 & -314.575918506747 \tabularnewline
27 & 2456 & 2414.18755836062 & 41.8124416393841 \tabularnewline
28 & 2295 & 2249.46756610621 & 45.5324338937941 \tabularnewline
29 & 2379 & 2261.28528045059 & 117.714719549409 \tabularnewline
30 & 2479 & 2484.53410254026 & -5.53410254026057 \tabularnewline
31 & 2057 & 2137.94907289871 & -80.9490728987129 \tabularnewline
32 & 2280 & 2324.81498116059 & -44.8149811605859 \tabularnewline
33 & 2351 & 2463.93807097104 & -112.938070971041 \tabularnewline
34 & 2276 & 2217.17070312324 & 58.8292968767611 \tabularnewline
35 & 2548 & 2364.88295631540 & 183.117043684596 \tabularnewline
36 & 2311 & 2276.92128321840 & 34.0787167815963 \tabularnewline
37 & 2201 & 2261.68937131074 & -60.6893713107438 \tabularnewline
38 & 2725 & 2593.77529861685 & 131.224701383151 \tabularnewline
39 & 2408 & 2142.95627125852 & 265.043728741484 \tabularnewline
40 & 2139 & 2093.77906886292 & 45.2209311370826 \tabularnewline
41 & 1898 & 2168.55994778503 & -270.559947785030 \tabularnewline
42 & 2537 & 2309.56364999331 & 227.436350006685 \tabularnewline
43 & 2069 & 1890.67233324795 & 178.327666752054 \tabularnewline
44 & 2063 & 2163.36358444976 & -100.363584449756 \tabularnewline
45 & 2524 & 2379.32770740410 & 144.672292595896 \tabularnewline
46 & 2437 & 2204.96575733620 & 232.034242663796 \tabularnewline
47 & 2189 & 2434.98722893784 & -245.987228937841 \tabularnewline
48 & 2793 & 2355.80235270987 & 437.197647290128 \tabularnewline
49 & 2074 & 2282.68806726173 & -208.688067261728 \tabularnewline
50 & 2622 & 2682.24363133296 & -60.2436313329591 \tabularnewline
51 & 2278 & 2209.45331642952 & 68.5466835704769 \tabularnewline
52 & 2144 & 2082.32528490475 & 61.6747150952481 \tabularnewline
53 & 2427 & 2143.55713794793 & 283.44286205207 \tabularnewline
54 & 2139 & 2331.27929683290 & -192.279296832896 \tabularnewline
55 & 1828 & 1912.97732982626 & -84.9773298262642 \tabularnewline
56 & 2072 & 2039.12429093114 & 32.8757090688638 \tabularnewline
57 & 1800 & 2234.8690943837 & -434.869094383699 \tabularnewline
58 & 1758 & 2129.32219119283 & -371.32219119283 \tabularnewline
59 & 2246 & 2261.60444495349 & -15.6044449534901 \tabularnewline
60 & 1987 & 2130.59608077529 & -143.596080775286 \tabularnewline
61 & 1868 & 2064.87208357099 & -196.872083570988 \tabularnewline
62 & 2514 & 2374.62623311475 & 139.373766885247 \tabularnewline
63 & 2121 & 1928.18956327375 & 192.810436726250 \tabularnewline
\hline
\end{tabular}
%Source: https://freestatistics.org/blog/index.php?pk=58425&T=4

[TABLE]
[ROW][C]Multiple Linear Regression - Actuals, Interpolation, and Residuals[/C][/ROW]
[ROW][C]Time or Index[/C][C]Actuals[/C][C]InterpolationForecast[/C][C]ResidualsPrediction Error[/C][/ROW]
[ROW][C]1[/C][C]2333[/C][C]2396.56698486062[/C][C]-63.5669848606249[/C][/ROW]
[ROW][C]2[/C][C]3016[/C][C]2749.05926183088[/C][C]266.940738169117[/C][/ROW]
[ROW][C]3[/C][C]2155[/C][C]2359.26350003168[/C][C]-204.263500031677[/C][/ROW]
[ROW][C]4[/C][C]2172[/C][C]2380.40167412762[/C][C]-208.401674127618[/C][/ROW]
[ROW][C]5[/C][C]2150[/C][C]2395.29090306032[/C][C]-245.290903060322[/C][/ROW]
[ROW][C]6[/C][C]2533[/C][C]2521.22594093365[/C][C]11.7740590663476[/C][/ROW]
[ROW][C]7[/C][C]2058[/C][C]2106.56514317468[/C][C]-48.5651431746786[/C][/ROW]
[ROW][C]8[/C][C]2160[/C][C]2299.50455752925[/C][C]-139.504557529245[/C][/ROW]
[ROW][C]9[/C][C]2260[/C][C]2501.87871504757[/C][C]-241.878715047574[/C][/ROW]
[ROW][C]10[/C][C]2498[/C][C]2372.28495790913[/C][C]125.715042090873[/C][/ROW]
[ROW][C]11[/C][C]2695[/C][C]2646.58934231459[/C][C]48.4106576854081[/C][/ROW]
[ROW][C]12[/C][C]2799[/C][C]2627.71913248125[/C][C]171.280867518752[/C][/ROW]
[ROW][C]13[/C][C]2947[/C][C]2654.31803732812[/C][C]292.68196267188[/C][/ROW]
[ROW][C]14[/C][C]2930[/C][C]3092.71965659781[/C][C]-162.719656597808[/C][/ROW]
[ROW][C]15[/C][C]2318[/C][C]2681.94979064592[/C][C]-363.949790645917[/C][/ROW]
[ROW][C]16[/C][C]2540[/C][C]2484.02640599851[/C][C]55.9735940014934[/C][/ROW]
[ROW][C]17[/C][C]2570[/C][C]2455.30673075613[/C][C]114.693269243873[/C][/ROW]
[ROW][C]18[/C][C]2669[/C][C]2710.39700969988[/C][C]-41.3970096998761[/C][/ROW]
[ROW][C]19[/C][C]2450[/C][C]2413.8361208524[/C][C]36.1638791476022[/C][/ROW]
[ROW][C]20[/C][C]2842[/C][C]2590.19258592928[/C][C]251.807414070723[/C][/ROW]
[ROW][C]21[/C][C]3440[/C][C]2794.98641219358[/C][C]645.013587806417[/C][/ROW]
[ROW][C]22[/C][C]2678[/C][C]2723.2563904386[/C][C]-45.2563904385997[/C][/ROW]
[ROW][C]23[/C][C]2981[/C][C]2950.93602747867[/C][C]30.0639725213271[/C][/ROW]
[ROW][C]24[/C][C]2260[/C][C]2758.96115081519[/C][C]-498.96115081519[/C][/ROW]
[ROW][C]25[/C][C]2844[/C][C]2606.86545566779[/C][C]237.134544332205[/C][/ROW]
[ROW][C]26[/C][C]2546[/C][C]2860.57591850675[/C][C]-314.575918506747[/C][/ROW]
[ROW][C]27[/C][C]2456[/C][C]2414.18755836062[/C][C]41.8124416393841[/C][/ROW]
[ROW][C]28[/C][C]2295[/C][C]2249.46756610621[/C][C]45.5324338937941[/C][/ROW]
[ROW][C]29[/C][C]2379[/C][C]2261.28528045059[/C][C]117.714719549409[/C][/ROW]
[ROW][C]30[/C][C]2479[/C][C]2484.53410254026[/C][C]-5.53410254026057[/C][/ROW]
[ROW][C]31[/C][C]2057[/C][C]2137.94907289871[/C][C]-80.9490728987129[/C][/ROW]
[ROW][C]32[/C][C]2280[/C][C]2324.81498116059[/C][C]-44.8149811605859[/C][/ROW]
[ROW][C]33[/C][C]2351[/C][C]2463.93807097104[/C][C]-112.938070971041[/C][/ROW]
[ROW][C]34[/C][C]2276[/C][C]2217.17070312324[/C][C]58.8292968767611[/C][/ROW]
[ROW][C]35[/C][C]2548[/C][C]2364.88295631540[/C][C]183.117043684596[/C][/ROW]
[ROW][C]36[/C][C]2311[/C][C]2276.92128321840[/C][C]34.0787167815963[/C][/ROW]
[ROW][C]37[/C][C]2201[/C][C]2261.68937131074[/C][C]-60.6893713107438[/C][/ROW]
[ROW][C]38[/C][C]2725[/C][C]2593.77529861685[/C][C]131.224701383151[/C][/ROW]
[ROW][C]39[/C][C]2408[/C][C]2142.95627125852[/C][C]265.043728741484[/C][/ROW]
[ROW][C]40[/C][C]2139[/C][C]2093.77906886292[/C][C]45.2209311370826[/C][/ROW]
[ROW][C]41[/C][C]1898[/C][C]2168.55994778503[/C][C]-270.559947785030[/C][/ROW]
[ROW][C]42[/C][C]2537[/C][C]2309.56364999331[/C][C]227.436350006685[/C][/ROW]
[ROW][C]43[/C][C]2069[/C][C]1890.67233324795[/C][C]178.327666752054[/C][/ROW]
[ROW][C]44[/C][C]2063[/C][C]2163.36358444976[/C][C]-100.363584449756[/C][/ROW]
[ROW][C]45[/C][C]2524[/C][C]2379.32770740410[/C][C]144.672292595896[/C][/ROW]
[ROW][C]46[/C][C]2437[/C][C]2204.96575733620[/C][C]232.034242663796[/C][/ROW]
[ROW][C]47[/C][C]2189[/C][C]2434.98722893784[/C][C]-245.987228937841[/C][/ROW]
[ROW][C]48[/C][C]2793[/C][C]2355.80235270987[/C][C]437.197647290128[/C][/ROW]
[ROW][C]49[/C][C]2074[/C][C]2282.68806726173[/C][C]-208.688067261728[/C][/ROW]
[ROW][C]50[/C][C]2622[/C][C]2682.24363133296[/C][C]-60.2436313329591[/C][/ROW]
[ROW][C]51[/C][C]2278[/C][C]2209.45331642952[/C][C]68.5466835704769[/C][/ROW]
[ROW][C]52[/C][C]2144[/C][C]2082.32528490475[/C][C]61.6747150952481[/C][/ROW]
[ROW][C]53[/C][C]2427[/C][C]2143.55713794793[/C][C]283.44286205207[/C][/ROW]
[ROW][C]54[/C][C]2139[/C][C]2331.27929683290[/C][C]-192.279296832896[/C][/ROW]
[ROW][C]55[/C][C]1828[/C][C]1912.97732982626[/C][C]-84.9773298262642[/C][/ROW]
[ROW][C]56[/C][C]2072[/C][C]2039.12429093114[/C][C]32.8757090688638[/C][/ROW]
[ROW][C]57[/C][C]1800[/C][C]2234.8690943837[/C][C]-434.869094383699[/C][/ROW]
[ROW][C]58[/C][C]1758[/C][C]2129.32219119283[/C][C]-371.32219119283[/C][/ROW]
[ROW][C]59[/C][C]2246[/C][C]2261.60444495349[/C][C]-15.6044449534901[/C][/ROW]
[ROW][C]60[/C][C]1987[/C][C]2130.59608077529[/C][C]-143.596080775286[/C][/ROW]
[ROW][C]61[/C][C]1868[/C][C]2064.87208357099[/C][C]-196.872083570988[/C][/ROW]
[ROW][C]62[/C][C]2514[/C][C]2374.62623311475[/C][C]139.373766885247[/C][/ROW]
[ROW][C]63[/C][C]2121[/C][C]1928.18956327375[/C][C]192.810436726250[/C][/ROW]
[/TABLE]
Source: https://freestatistics.org/blog/index.php?pk=58425&T=4

Globally Unique Identifier (entire table): ba.freestatistics.org/blog/index.php?pk=58425&T=4

As an alternative you can also use a QR Code:  

The GUIDs for individual cells are displayed in the table below:

Multiple Linear Regression - Actuals, Interpolation, and Residuals
Time or IndexActualsInterpolationForecastResidualsPrediction Error
123332396.56698486062-63.5669848606249
230162749.05926183088266.940738169117
321552359.26350003168-204.263500031677
421722380.40167412762-208.401674127618
521502395.29090306032-245.290903060322
625332521.2259409336511.7740590663476
720582106.56514317468-48.5651431746786
821602299.50455752925-139.504557529245
922602501.87871504757-241.878715047574
1024982372.28495790913125.715042090873
1126952646.5893423145948.4106576854081
1227992627.71913248125171.280867518752
1329472654.31803732812292.68196267188
1429303092.71965659781-162.719656597808
1523182681.94979064592-363.949790645917
1625402484.0264059985155.9735940014934
1725702455.30673075613114.693269243873
1826692710.39700969988-41.3970096998761
1924502413.836120852436.1638791476022
2028422590.19258592928251.807414070723
2134402794.98641219358645.013587806417
2226782723.2563904386-45.2563904385997
2329812950.9360274786730.0639725213271
2422602758.96115081519-498.96115081519
2528442606.86545566779237.134544332205
2625462860.57591850675-314.575918506747
2724562414.1875583606241.8124416393841
2822952249.4675661062145.5324338937941
2923792261.28528045059117.714719549409
3024792484.53410254026-5.53410254026057
3120572137.94907289871-80.9490728987129
3222802324.81498116059-44.8149811605859
3323512463.93807097104-112.938070971041
3422762217.1707031232458.8292968767611
3525482364.88295631540183.117043684596
3623112276.9212832184034.0787167815963
3722012261.68937131074-60.6893713107438
3827252593.77529861685131.224701383151
3924082142.95627125852265.043728741484
4021392093.7790688629245.2209311370826
4118982168.55994778503-270.559947785030
4225372309.56364999331227.436350006685
4320691890.67233324795178.327666752054
4420632163.36358444976-100.363584449756
4525242379.32770740410144.672292595896
4624372204.96575733620232.034242663796
4721892434.98722893784-245.987228937841
4827932355.80235270987437.197647290128
4920742282.68806726173-208.688067261728
5026222682.24363133296-60.2436313329591
5122782209.4533164295268.5466835704769
5221442082.3252849047561.6747150952481
5324272143.55713794793283.44286205207
5421392331.27929683290-192.279296832896
5518281912.97732982626-84.9773298262642
5620722039.1242909311432.8757090688638
5718002234.8690943837-434.869094383699
5817582129.32219119283-371.32219119283
5922462261.60444495349-15.6044449534901
6019872130.59608077529-143.596080775286
6118682064.87208357099-196.872083570988
6225142374.62623311475139.373766885247
6321211928.18956327375192.810436726250


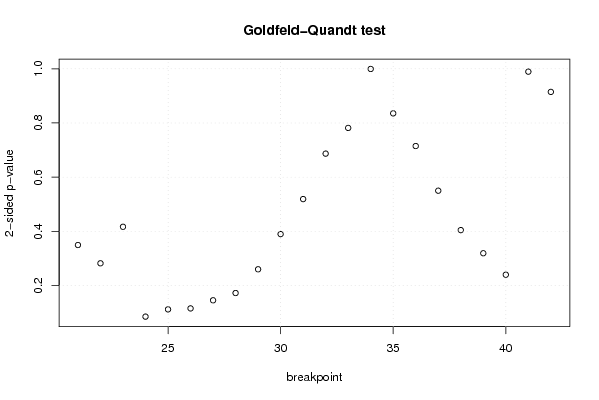
Goldfeld-Quandt test for Heteroskedasticity
p-valuesAlternative Hypothesis
breakpoint indexgreater2-sidedless
210.8252123550215870.3495752899568250.174787644978413
220.8589494417118270.2821011165763460.141050558288173
230.7915959283897690.4168081432204620.208404071610231
240.9574061885769750.08518762284605090.0425938114230255
250.943957168426980.1120856631460380.0560428315730191
260.942169599527760.1156608009444790.0578304004722397
270.9272101913845360.1455796172309280.0727898086154642
280.9138186719172580.1723626561654840.086181328082742
290.8699851797224450.2600296405551110.130014820277555
300.8051101419425650.389779716114870.194889858057435
310.7404171386136880.5191657227726240.259582861386312
320.6565593726401310.6868812547197380.343440627359869
330.6091609998991820.7816780002016370.390839000100818
340.4997089338421180.9994178676842360.500291066157882
350.4177858755734370.8355717511468730.582214124426563
360.3574241818104510.7148483636209020.642575818189549
370.2750193196119410.5500386392238810.72498068038806
380.2023095107504710.4046190215009420.797690489249529
390.1596170825902410.3192341651804820.84038291740976
400.1199568502147050.239913700429410.880043149785295
410.4947083926479410.9894167852958830.505291607352059
420.5426338751650450.914732249669910.457366124834955

\begin{tabular}{lllllllll}
\hline
Goldfeld-Quandt test for Heteroskedasticity \tabularnewline
p-values & Alternative Hypothesis \tabularnewline
breakpoint index & greater & 2-sided & less \tabularnewline
21 & 0.825212355021587 & 0.349575289956825 & 0.174787644978413 \tabularnewline
22 & 0.858949441711827 & 0.282101116576346 & 0.141050558288173 \tabularnewline
23 & 0.791595928389769 & 0.416808143220462 & 0.208404071610231 \tabularnewline
24 & 0.957406188576975 & 0.0851876228460509 & 0.0425938114230255 \tabularnewline
25 & 0.94395716842698 & 0.112085663146038 & 0.0560428315730191 \tabularnewline
26 & 0.94216959952776 & 0.115660800944479 & 0.0578304004722397 \tabularnewline
27 & 0.927210191384536 & 0.145579617230928 & 0.0727898086154642 \tabularnewline
28 & 0.913818671917258 & 0.172362656165484 & 0.086181328082742 \tabularnewline
29 & 0.869985179722445 & 0.260029640555111 & 0.130014820277555 \tabularnewline
30 & 0.805110141942565 & 0.38977971611487 & 0.194889858057435 \tabularnewline
31 & 0.740417138613688 & 0.519165722772624 & 0.259582861386312 \tabularnewline
32 & 0.656559372640131 & 0.686881254719738 & 0.343440627359869 \tabularnewline
33 & 0.609160999899182 & 0.781678000201637 & 0.390839000100818 \tabularnewline
34 & 0.499708933842118 & 0.999417867684236 & 0.500291066157882 \tabularnewline
35 & 0.417785875573437 & 0.835571751146873 & 0.582214124426563 \tabularnewline
36 & 0.357424181810451 & 0.714848363620902 & 0.642575818189549 \tabularnewline
37 & 0.275019319611941 & 0.550038639223881 & 0.72498068038806 \tabularnewline
38 & 0.202309510750471 & 0.404619021500942 & 0.797690489249529 \tabularnewline
39 & 0.159617082590241 & 0.319234165180482 & 0.84038291740976 \tabularnewline
40 & 0.119956850214705 & 0.23991370042941 & 0.880043149785295 \tabularnewline
41 & 0.494708392647941 & 0.989416785295883 & 0.505291607352059 \tabularnewline
42 & 0.542633875165045 & 0.91473224966991 & 0.457366124834955 \tabularnewline
\hline
\end{tabular}
%Source: https://freestatistics.org/blog/index.php?pk=58425&T=5

[TABLE]
[ROW][C]Goldfeld-Quandt test for Heteroskedasticity[/C][/ROW]
[ROW][C]p-values[/C][C]Alternative Hypothesis[/C][/ROW]
[ROW][C]breakpoint index[/C][C]greater[/C][C]2-sided[/C][C]less[/C][/ROW]
[ROW][C]21[/C][C]0.825212355021587[/C][C]0.349575289956825[/C][C]0.174787644978413[/C][/ROW]
[ROW][C]22[/C][C]0.858949441711827[/C][C]0.282101116576346[/C][C]0.141050558288173[/C][/ROW]
[ROW][C]23[/C][C]0.791595928389769[/C][C]0.416808143220462[/C][C]0.208404071610231[/C][/ROW]
[ROW][C]24[/C][C]0.957406188576975[/C][C]0.0851876228460509[/C][C]0.0425938114230255[/C][/ROW]
[ROW][C]25[/C][C]0.94395716842698[/C][C]0.112085663146038[/C][C]0.0560428315730191[/C][/ROW]
[ROW][C]26[/C][C]0.94216959952776[/C][C]0.115660800944479[/C][C]0.0578304004722397[/C][/ROW]
[ROW][C]27[/C][C]0.927210191384536[/C][C]0.145579617230928[/C][C]0.0727898086154642[/C][/ROW]
[ROW][C]28[/C][C]0.913818671917258[/C][C]0.172362656165484[/C][C]0.086181328082742[/C][/ROW]
[ROW][C]29[/C][C]0.869985179722445[/C][C]0.260029640555111[/C][C]0.130014820277555[/C][/ROW]
[ROW][C]30[/C][C]0.805110141942565[/C][C]0.38977971611487[/C][C]0.194889858057435[/C][/ROW]
[ROW][C]31[/C][C]0.740417138613688[/C][C]0.519165722772624[/C][C]0.259582861386312[/C][/ROW]
[ROW][C]32[/C][C]0.656559372640131[/C][C]0.686881254719738[/C][C]0.343440627359869[/C][/ROW]
[ROW][C]33[/C][C]0.609160999899182[/C][C]0.781678000201637[/C][C]0.390839000100818[/C][/ROW]
[ROW][C]34[/C][C]0.499708933842118[/C][C]0.999417867684236[/C][C]0.500291066157882[/C][/ROW]
[ROW][C]35[/C][C]0.417785875573437[/C][C]0.835571751146873[/C][C]0.582214124426563[/C][/ROW]
[ROW][C]36[/C][C]0.357424181810451[/C][C]0.714848363620902[/C][C]0.642575818189549[/C][/ROW]
[ROW][C]37[/C][C]0.275019319611941[/C][C]0.550038639223881[/C][C]0.72498068038806[/C][/ROW]
[ROW][C]38[/C][C]0.202309510750471[/C][C]0.404619021500942[/C][C]0.797690489249529[/C][/ROW]
[ROW][C]39[/C][C]0.159617082590241[/C][C]0.319234165180482[/C][C]0.84038291740976[/C][/ROW]
[ROW][C]40[/C][C]0.119956850214705[/C][C]0.23991370042941[/C][C]0.880043149785295[/C][/ROW]
[ROW][C]41[/C][C]0.494708392647941[/C][C]0.989416785295883[/C][C]0.505291607352059[/C][/ROW]
[ROW][C]42[/C][C]0.542633875165045[/C][C]0.91473224966991[/C][C]0.457366124834955[/C][/ROW]
[/TABLE]
Source: https://freestatistics.org/blog/index.php?pk=58425&T=5

Globally Unique Identifier (entire table): ba.freestatistics.org/blog/index.php?pk=58425&T=5

As an alternative you can also use a QR Code:  

The GUIDs for individual cells are displayed in the table below:

Goldfeld-Quandt test for Heteroskedasticity
p-valuesAlternative Hypothesis
breakpoint indexgreater2-sidedless
210.8252123550215870.3495752899568250.174787644978413
220.8589494417118270.2821011165763460.141050558288173
230.7915959283897690.4168081432204620.208404071610231
240.9574061885769750.08518762284605090.0425938114230255
250.943957168426980.1120856631460380.0560428315730191
260.942169599527760.1156608009444790.0578304004722397
270.9272101913845360.1455796172309280.0727898086154642
280.9138186719172580.1723626561654840.086181328082742
290.8699851797224450.2600296405551110.130014820277555
300.8051101419425650.389779716114870.194889858057435
310.7404171386136880.5191657227726240.259582861386312
320.6565593726401310.6868812547197380.343440627359869
330.6091609998991820.7816780002016370.390839000100818
340.4997089338421180.9994178676842360.500291066157882
350.4177858755734370.8355717511468730.582214124426563
360.3574241818104510.7148483636209020.642575818189549
370.2750193196119410.5500386392238810.72498068038806
380.2023095107504710.4046190215009420.797690489249529
390.1596170825902410.3192341651804820.84038291740976
400.1199568502147050.239913700429410.880043149785295
410.4947083926479410.9894167852958830.505291607352059
420.5426338751650450.914732249669910.457366124834955


Meta Analysis of Goldfeld-Quandt test for Heteroskedasticity
Description# significant tests% significant testsOK/NOK
1% type I error level00OK
5% type I error level00OK
10% type I error level10.0454545454545455OK

\begin{tabular}{lllllllll}
\hline
Meta Analysis of Goldfeld-Quandt test for Heteroskedasticity \tabularnewline
Description & # significant tests & % significant tests & OK/NOK \tabularnewline
1% type I error level & 0 & 0 & OK \tabularnewline
5% type I error level & 0 & 0 & OK \tabularnewline
10% type I error level & 1 & 0.0454545454545455 & OK \tabularnewline
\hline
\end{tabular}
%Source: https://freestatistics.org/blog/index.php?pk=58425&T=6

[TABLE]
[ROW][C]Meta Analysis of Goldfeld-Quandt test for Heteroskedasticity[/C][/ROW]
[ROW][C]Description[/C][C]# significant tests[/C][C]% significant tests[/C][C]OK/NOK[/C][/ROW]
[ROW][C]1% type I error level[/C][C]0[/C][C]0[/C][C]OK[/C][/ROW]
[ROW][C]5% type I error level[/C][C]0[/C][C]0[/C][C]OK[/C][/ROW]
[ROW][C]10% type I error level[/C][C]1[/C][C]0.0454545454545455[/C][C]OK[/C][/ROW]
[/TABLE]
Source: https://freestatistics.org/blog/index.php?pk=58425&T=6

Globally Unique Identifier (entire table): ba.freestatistics.org/blog/index.php?pk=58425&T=6

As an alternative you can also use a QR Code:  

The GUIDs for individual cells are displayed in the table below:

Meta Analysis of Goldfeld-Quandt test for Heteroskedasticity
Description# significant tests% significant testsOK/NOK
1% type I error level00OK
5% type I error level00OK
10% type I error level10.0454545454545455OK


Parameters (Session):
par1 = 1 ; par2 = Include Monthly Dummies ; par3 = Linear Trend ;
Parameters (R input):
par1 = 1 ; par2 = Include Monthly Dummies ; par3 = Linear Trend ;
R code (references can be found in the software module):
library(lattice)
library(lmtest)
n25 <- 25 #minimum number of obs. for Goldfeld-Quandt test
par1 <- as.numeric(par1)
x <- t(y)
k <- length(x[1,])
n <- length(x[,1])
x1 <- cbind(x[,par1], x[,1:k!=par1])
mycolnames <- c(colnames(x)[par1], colnames(x)[1:k!=par1])
colnames(x1) <- mycolnames #colnames(x)[par1]
x <- x1
if (par3 == 'First Differences'){
x2 <- array(0, dim=c(n-1,k), dimnames=list(1:(n-1), paste('(1-B)',colnames(x),sep='')))
for (i in 1:n-1) {
for (j in 1:k) {
x2[i,j] <- x[i+1,j] - x[i,j]
}
}
x <- x2
}
if (par2 == 'Include Monthly Dummies'){
x2 <- array(0, dim=c(n,11), dimnames=list(1:n, paste('M', seq(1:11), sep ='')))
for (i in 1:11){
x2[seq(i,n,12),i] <- 1
}
x <- cbind(x, x2)
}
if (par2 == 'Include Quarterly Dummies'){
x2 <- array(0, dim=c(n,3), dimnames=list(1:n, paste('Q', seq(1:3), sep ='')))
for (i in 1:3){
x2[seq(i,n,4),i] <- 1
}
x <- cbind(x, x2)
}
k <- length(x[1,])
if (par3 == 'Linear Trend'){
x <- cbind(x, c(1:n))
colnames(x)[k+1] <- 't'
}
x
k <- length(x[1,])
df <- as.data.frame(x)
(mylm <- lm(df))
(mysum <- summary(mylm))
if (n > n25) {
kp3 <- k + 3
nmkm3 <- n - k - 3
gqarr <- array(NA, dim=c(nmkm3-kp3+1,3))
numgqtests <- 0
numsignificant1 <- 0
numsignificant5 <- 0
numsignificant10 <- 0
for (mypoint in kp3:nmkm3) {
j <- 0
numgqtests <- numgqtests + 1
for (myalt in c('greater', 'two.sided', 'less')) {
j <- j + 1
gqarr[mypoint-kp3+1,j] <- gqtest(mylm, point=mypoint, alternative=myalt)$p.value
}
if (gqarr[mypoint-kp3+1,2] < 0.01) numsignificant1 <- numsignificant1 + 1
if (gqarr[mypoint-kp3+1,2] < 0.05) numsignificant5 <- numsignificant5 + 1
if (gqarr[mypoint-kp3+1,2] < 0.10) numsignificant10 <- numsignificant10 + 1
}
gqarr
}
bitmap(file='test0.png')
plot(x[,1], type='l', main='Actuals and Interpolation', ylab='value of Actuals and Interpolation (dots)', xlab='time or index')
points(x[,1]-mysum$resid)
grid()
dev.off()
bitmap(file='test1.png')
plot(mysum$resid, type='b', pch=19, main='Residuals', ylab='value of Residuals', xlab='time or index')
grid()
dev.off()
bitmap(file='test2.png')
hist(mysum$resid, main='Residual Histogram', xlab='values of Residuals')
grid()
dev.off()
bitmap(file='test3.png')
densityplot(~mysum$resid,col='black',main='Residual Density Plot', xlab='values of Residuals')
dev.off()
bitmap(file='test4.png')
qqnorm(mysum$resid, main='Residual Normal Q-Q Plot')
qqline(mysum$resid)
grid()
dev.off()
(myerror <- as.ts(mysum$resid))
bitmap(file='test5.png')
dum <- cbind(lag(myerror,k=1),myerror)
dum
dum1 <- dum[2:length(myerror),]
dum1
z <- as.data.frame(dum1)
z
plot(z,main=paste('Residual Lag plot, lowess, and regression line'), ylab='values of Residuals', xlab='lagged values of Residuals')
lines(lowess(z))
abline(lm(z))
grid()
dev.off()
bitmap(file='test6.png')
acf(mysum$resid, lag.max=length(mysum$resid)/2, main='Residual Autocorrelation Function')
grid()
dev.off()
bitmap(file='test7.png')
pacf(mysum$resid, lag.max=length(mysum$resid)/2, main='Residual Partial Autocorrelation Function')
grid()
dev.off()
bitmap(file='test8.png')
opar <- par(mfrow = c(2,2), oma = c(0, 0, 1.1, 0))
plot(mylm, las = 1, sub='Residual Diagnostics')
par(opar)
dev.off()
if (n > n25) {
bitmap(file='test9.png')
plot(kp3:nmkm3,gqarr[,2], main='Goldfeld-Quandt test',ylab='2-sided p-value',xlab='breakpoint')
grid()
dev.off()
}
load(file='createtable')
a<-table.start()
a<-table.row.start(a)
a<-table.element(a, 'Multiple Linear Regression - Estimated Regression Equation', 1, TRUE)
a<-table.row.end(a)
myeq <- colnames(x)[1]
myeq <- paste(myeq, '[t] = ', sep='')
for (i in 1:k){
if (mysum$coefficients[i,1] > 0) myeq <- paste(myeq, '+', '')
myeq <- paste(myeq, mysum$coefficients[i,1], sep=' ')
if (rownames(mysum$coefficients)[i] != '(Intercept)') {
myeq <- paste(myeq, rownames(mysum$coefficients)[i], sep='')
if (rownames(mysum$coefficients)[i] != 't') myeq <- paste(myeq, '[t]', sep='')
}
}
myeq <- paste(myeq, ' + e[t]')
a<-table.row.start(a)
a<-table.element(a, myeq)
a<-table.row.end(a)
a<-table.end(a)
table.save(a,file='mytable1.tab')
a<-table.start()
a<-table.row.start(a)
a<-table.element(a,hyperlink('ols1.htm','Multiple Linear Regression - Ordinary Least Squares',''), 6, TRUE)
a<-table.row.end(a)
a<-table.row.start(a)
a<-table.element(a,'Variable',header=TRUE)
a<-table.element(a,'Parameter',header=TRUE)
a<-table.element(a,'S.D.',header=TRUE)
a<-table.element(a,'T-STAT
H0: parameter = 0',header=TRUE)
a<-table.element(a,'2-tail p-value',header=TRUE)
a<-table.element(a,'1-tail p-value',header=TRUE)
a<-table.row.end(a)
for (i in 1:k){
a<-table.row.start(a)
a<-table.element(a,rownames(mysum$coefficients)[i],header=TRUE)
a<-table.element(a,mysum$coefficients[i,1])
a<-table.element(a, round(mysum$coefficients[i,2],6))
a<-table.element(a, round(mysum$coefficients[i,3],4))
a<-table.element(a, round(mysum$coefficients[i,4],6))
a<-table.element(a, round(mysum$coefficients[i,4]/2,6))
a<-table.row.end(a)
}
a<-table.end(a)
table.save(a,file='mytable2.tab')
a<-table.start()
a<-table.row.start(a)
a<-table.element(a, 'Multiple Linear Regression - Regression Statistics', 2, TRUE)
a<-table.row.end(a)
a<-table.row.start(a)
a<-table.element(a, 'Multiple R',1,TRUE)
a<-table.element(a, sqrt(mysum$r.squared))
a<-table.row.end(a)
a<-table.row.start(a)
a<-table.element(a, 'R-squared',1,TRUE)
a<-table.element(a, mysum$r.squared)
a<-table.row.end(a)
a<-table.row.start(a)
a<-table.element(a, 'Adjusted R-squared',1,TRUE)
a<-table.element(a, mysum$adj.r.squared)
a<-table.row.end(a)
a<-table.row.start(a)
a<-table.element(a, 'F-TEST (value)',1,TRUE)
a<-table.element(a, mysum$fstatistic[1])
a<-table.row.end(a)
a<-table.row.start(a)
a<-table.element(a, 'F-TEST (DF numerator)',1,TRUE)
a<-table.element(a, mysum$fstatistic[2])
a<-table.row.end(a)
a<-table.row.start(a)
a<-table.element(a, 'F-TEST (DF denominator)',1,TRUE)
a<-table.element(a, mysum$fstatistic[3])
a<-table.row.end(a)
a<-table.row.start(a)
a<-table.element(a, 'p-value',1,TRUE)
a<-table.element(a, 1-pf(mysum$fstatistic[1],mysum$fstatistic[2],mysum$fstatistic[3]))
a<-table.row.end(a)
a<-table.row.start(a)
a<-table.element(a, 'Multiple Linear Regression - Residual Statistics', 2, TRUE)
a<-table.row.end(a)
a<-table.row.start(a)
a<-table.element(a, 'Residual Standard Deviation',1,TRUE)
a<-table.element(a, mysum$sigma)
a<-table.row.end(a)
a<-table.row.start(a)
a<-table.element(a, 'Sum Squared Residuals',1,TRUE)
a<-table.element(a, sum(myerror*myerror))
a<-table.row.end(a)
a<-table.end(a)
table.save(a,file='mytable3.tab')
a<-table.start()
a<-table.row.start(a)
a<-table.element(a, 'Multiple Linear Regression - Actuals, Interpolation, and Residuals', 4, TRUE)
a<-table.row.end(a)
a<-table.row.start(a)
a<-table.element(a, 'Time or Index', 1, TRUE)
a<-table.element(a, 'Actuals', 1, TRUE)
a<-table.element(a, 'Interpolation
Forecast', 1, TRUE)
a<-table.element(a, 'Residuals
Prediction Error', 1, TRUE)
a<-table.row.end(a)
for (i in 1:n) {
a<-table.row.start(a)
a<-table.element(a,i, 1, TRUE)
a<-table.element(a,x[i])
a<-table.element(a,x[i]-mysum$resid[i])
a<-table.element(a,mysum$resid[i])
a<-table.row.end(a)
}
a<-table.end(a)
table.save(a,file='mytable4.tab')
if (n > n25) {
a<-table.start()
a<-table.row.start(a)
a<-table.element(a,'Goldfeld-Quandt test for Heteroskedasticity',4,TRUE)
a<-table.row.end(a)
a<-table.row.start(a)
a<-table.element(a,'p-values',header=TRUE)
a<-table.element(a,'Alternative Hypothesis',3,header=TRUE)
a<-table.row.end(a)
a<-table.row.start(a)
a<-table.element(a,'breakpoint index',header=TRUE)
a<-table.element(a,'greater',header=TRUE)
a<-table.element(a,'2-sided',header=TRUE)
a<-table.element(a,'less',header=TRUE)
a<-table.row.end(a)
for (mypoint in kp3:nmkm3) {
a<-table.row.start(a)
a<-table.element(a,mypoint,header=TRUE)
a<-table.element(a,gqarr[mypoint-kp3+1,1])
a<-table.element(a,gqarr[mypoint-kp3+1,2])
a<-table.element(a,gqarr[mypoint-kp3+1,3])
a<-table.row.end(a)
}
a<-table.end(a)
table.save(a,file='mytable5.tab')
a<-table.start()
a<-table.row.start(a)
a<-table.element(a,'Meta Analysis of Goldfeld-Quandt test for Heteroskedasticity',4,TRUE)
a<-table.row.end(a)
a<-table.row.start(a)
a<-table.element(a,'Description',header=TRUE)
a<-table.element(a,'# significant tests',header=TRUE)
a<-table.element(a,'% significant tests',header=TRUE)
a<-table.element(a,'OK/NOK',header=TRUE)
a<-table.row.end(a)
a<-table.row.start(a)
a<-table.element(a,'1% type I error level',header=TRUE)
a<-table.element(a,numsignificant1)
a<-table.element(a,numsignificant1/numgqtests)
if (numsignificant1/numgqtests < 0.01) dum <- 'OK' else dum <- 'NOK'
a<-table.element(a,dum)
a<-table.row.end(a)
a<-table.row.start(a)
a<-table.element(a,'5% type I error level',header=TRUE)
a<-table.element(a,numsignificant5)
a<-table.element(a,numsignificant5/numgqtests)
if (numsignificant5/numgqtests < 0.05) dum <- 'OK' else dum <- 'NOK'
a<-table.element(a,dum)
a<-table.row.end(a)
a<-table.row.start(a)
a<-table.element(a,'10% type I error level',header=TRUE)
a<-table.element(a,numsignificant10)
a<-table.element(a,numsignificant10/numgqtests)
if (numsignificant10/numgqtests < 0.1) dum <- 'OK' else dum <- 'NOK'
a<-table.element(a,dum)
a<-table.row.end(a)
a<-table.end(a)
table.save(a,file='mytable6.tab')
}