| Multiple Linear Regression - Estimated Regression Equation |
| Y[t] = + 27.2884150780906 + 7.47895824192816X[t] + 1.07957881958415Y1[t] + 0.0219700856362730Y2[t] -0.140078156472438Y3[t] -18.6096792509571M1[t] -17.3675468737958M2[t] -14.4556056693470M3[t] + 3.85191565250290M4[t] + 1.81841815303683M5[t] -6.79023110683807M6[t] -10.5917907190378M7[t] -5.5146948443727M8[t] -13.0312279400098M9[t] + 0.313573448969398M10[t] + 49.1524062059444M11[t] -0.176355958412839t + e[t] |
| Multiple Linear Regression - Ordinary Least Squares | |||||
| Variable | Parameter | S.D. | T-STAT H0: parameter = 0 | 2-tail p-value | 1-tail p-value |
| (Intercept) | 27.2884150780906 | 32.454672 | 0.8408 | 0.405328 | 0.202664 |
| X | 7.47895824192816 | 3.932394 | 1.9019 | 0.064228 | 0.032114 |
| Y1 | 1.07957881958415 | 0.159332 | 6.7757 | 0 | 0 |
| Y2 | 0.0219700856362730 | 0.235354 | 0.0933 | 0.926081 | 0.46304 |
| Y3 | -0.140078156472438 | 0.16043 | -0.8731 | 0.38767 | 0.193835 |
| M1 | -18.6096792509571 | 12.046999 | -1.5448 | 0.13009 | 0.065045 |
| M2 | -17.3675468737958 | 10.959982 | -1.5846 | 0.120734 | 0.060367 |
| M3 | -14.4556056693470 | 11.530624 | -1.2537 | 0.217063 | 0.108532 |
| M4 | 3.85191565250290 | 11.502559 | 0.3349 | 0.739427 | 0.369713 |
| M5 | 1.81841815303683 | 9.083038 | 0.2002 | 0.842314 | 0.421157 |
| M6 | -6.79023110683807 | 9.113171 | -0.7451 | 0.460461 | 0.23023 |
| M7 | -10.5917907190378 | 9.953327 | -1.0641 | 0.29349 | 0.146745 |
| M8 | -5.5146948443727 | 10.450702 | -0.5277 | 0.600561 | 0.300281 |
| M9 | -13.0312279400098 | 10.161493 | -1.2824 | 0.206901 | 0.103451 |
| M10 | 0.313573448969398 | 11.010339 | 0.0285 | 0.977418 | 0.488709 |
| M11 | 49.1524062059444 | 9.593202 | 5.1237 | 8e-06 | 4e-06 |
| t | -0.176355958412839 | 0.13019 | -1.3546 | 0.182962 | 0.091481 |
| Multiple Linear Regression - Regression Statistics | |
| Multiple R | 0.989562151332385 |
| R-squared | 0.979233251349577 |
| Adjusted R-squared | 0.971129154315266 |
| F-TEST (value) | 120.831876420492 |
| F-TEST (DF numerator) | 16 |
| F-TEST (DF denominator) | 41 |
| p-value | 0 |
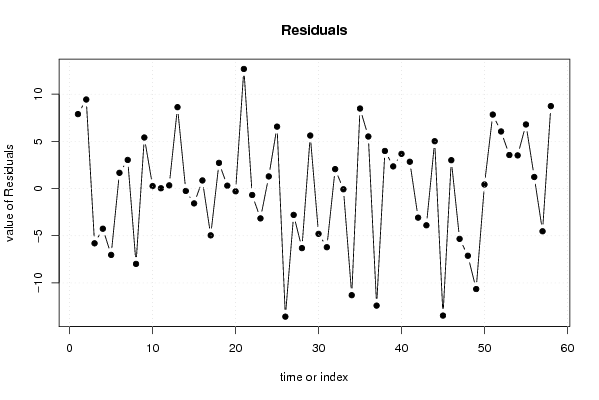
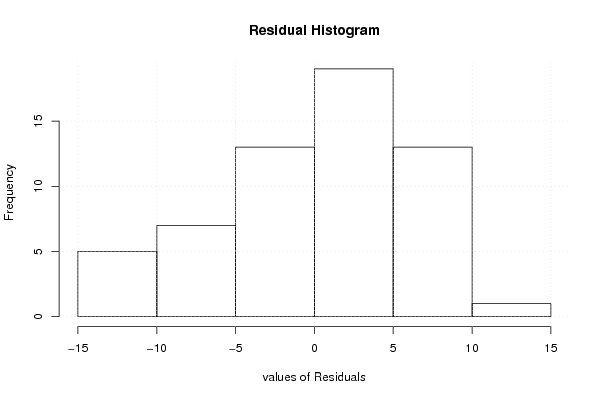
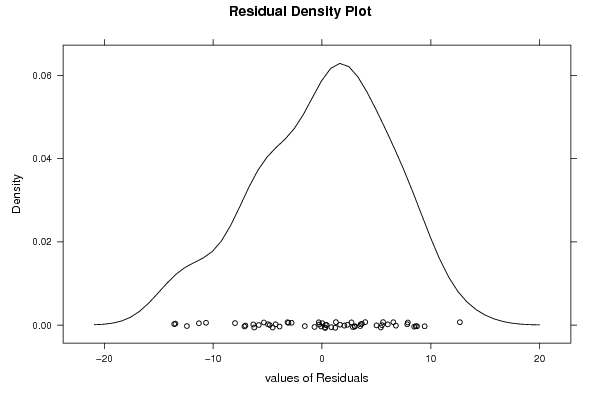
| Multiple Linear Regression - Residual Statistics | |
| Residual Standard Deviation | 7.2247844893341 |
| Sum Squared Residuals | 2140.09794761022 |
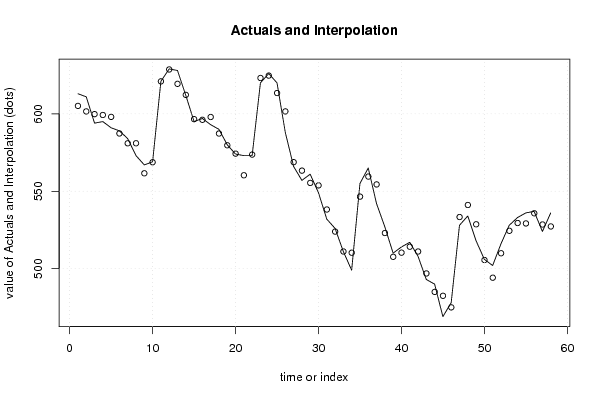
| Multiple Linear Regression - Actuals, Interpolation, and Residuals | |||
| Time or Index | Actuals | Interpolation Forecast | Residuals Prediction Error |
| 1 | 613 | 605.112830538047 | 7.88716946195325 |
| 2 | 611 | 601.567270071685 | 9.43272992831453 |
| 3 | 594 | 599.806309189794 | -5.80630918979425 |
| 4 | 595 | 599.260538136083 | -4.26053813608336 |
| 5 | 591 | 598.036928354917 | -7.03692835491685 |
| 6 | 589 | 587.33690660396 | 1.66309339603974 |
| 7 | 584 | 580.971874895162 | 3.02812510483808 |
| 8 | 573 | 580.99109316811 | -7.99109316811058 |
| 9 | 567 | 561.593142983399 | 5.40685701660145 |
| 10 | 569 | 568.742835336823 | 0.257164663176796 |
| 11 | 621 | 620.973508981933 | 0.0264910180672184 |
| 12 | 629 | 628.667254546058 | 0.332745453941555 |
| 13 | 628 | 619.380138033503 | 8.61986196649697 |
| 14 | 612 | 612.258032181191 | -0.258032181190727 |
| 15 | 595 | 596.577760976465 | -1.57776097646458 |
| 16 | 597 | 596.144643193263 | 0.85535680673684 |
| 17 | 593 | 597.961706422295 | -4.96170642229492 |
| 18 | 590 | 587.283654756975 | 2.71634524302540 |
| 19 | 580 | 579.69896607212 | 0.301033927880349 |
| 20 | 574 | 574.298320161511 | -0.298320161511326 |
| 21 | 573 | 560.328491803011 | 12.6715081969889 |
| 22 | 573 | 573.6863194649 | -0.686319464900039 |
| 23 | 620 | 623.167295116661 | -3.16729511666052 |
| 24 | 626 | 624.718815629231 | 1.28118437076930 |
| 25 | 620 | 613.44284736227 | 6.55715263772948 |
| 26 | 588 | 601.579298023127 | -13.5792980231271 |
| 27 | 566 | 568.796071589818 | -2.7960715898181 |
| 28 | 557 | 563.313929120878 | -6.31392912087777 |
| 29 | 561 | 555.387025409862 | 5.61297459013844 |
| 30 | 549 | 553.804324141578 | -4.80432414157761 |
| 31 | 532 | 538.220046486752 | -6.22004648675236 |
| 32 | 526 | 523.943992816549 | 2.05600718345097 |
| 33 | 511 | 511.081077266847 | -0.0810772668468236 |
| 34 | 499 | 510.305348549865 | -11.3053485498648 |
| 35 | 555 | 546.523797167708 | 8.47620283229231 |
| 36 | 565 | 559.488980219514 | 5.51101978048596 |
| 37 | 542 | 554.409995879286 | -12.4099958792862 |
| 38 | 527 | 523.020783541505 | 3.97921645849463 |
| 39 | 510 | 507.65659295942 | 2.3434070405795 |
| 40 | 514 | 510.327164704249 | 3.67283529575101 |
| 41 | 517 | 514.163307415977 | 2.83669258402338 |
| 42 | 508 | 511.086247659018 | -3.08624765901787 |
| 43 | 493 | 496.897720343167 | -3.89772034316707 |
| 44 | 490 | 484.986812725513 | 5.01318727448669 |
| 45 | 469 | 482.465297578347 | -13.4652975783470 |
| 46 | 478 | 474.997849887824 | 3.00215011217601 |
| 47 | 528 | 533.335398733699 | -5.33539873369901 |
| 48 | 534 | 541.124949605197 | -7.12494960519685 |
| 49 | 518 | 528.654188186894 | -10.6541881868935 |
| 50 | 506 | 505.574616182491 | 0.425383817508676 |
| 51 | 502 | 494.163265284503 | 7.83673471549744 |
| 52 | 516 | 509.953724845527 | 6.04627515447328 |
| 53 | 528 | 524.45103239695 | 3.54896760304995 |
| 54 | 533 | 529.48886683847 | 3.51113316153034 |
| 55 | 536 | 529.211392202799 | 6.788607797201 |
| 56 | 537 | 535.779781128316 | 1.22021887168424 |
| 57 | 524 | 528.531990368397 | -4.53199036839658 |
| 58 | 536 | 527.267646760588 | 8.73235323941201 |
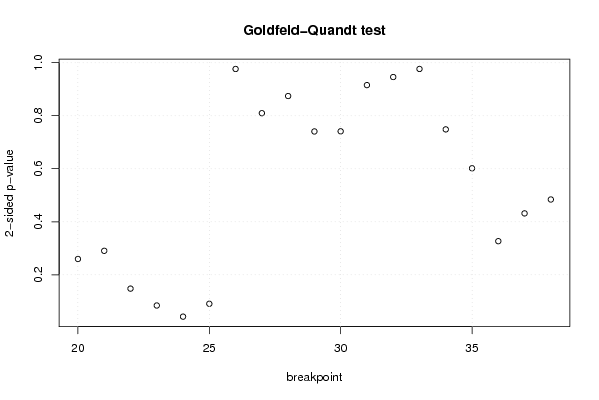
| Goldfeld-Quandt test for Heteroskedasticity | |||
| p-values | Alternative Hypothesis | ||
| breakpoint index | greater | 2-sided | less |
| 20 | 0.129758041783772 | 0.259516083567544 | 0.870241958216228 |
| 21 | 0.145175921385500 | 0.290351842771001 | 0.8548240786145 |
| 22 | 0.0738035900525588 | 0.147607180105118 | 0.926196409947441 |
| 23 | 0.0419930714755745 | 0.083986142951149 | 0.958006928524425 |
| 24 | 0.0209600806215535 | 0.0419201612431069 | 0.979039919378446 |
| 25 | 0.0452541040056122 | 0.0905082080112245 | 0.954745895994388 |
| 26 | 0.511750230933191 | 0.976499538133619 | 0.488249769066809 |
| 27 | 0.40477671669805 | 0.8095534333961 | 0.59522328330195 |
| 28 | 0.437175126404128 | 0.874350252808255 | 0.562824873595872 |
| 29 | 0.370362468609078 | 0.740724937218156 | 0.629637531390922 |
| 30 | 0.370612393317022 | 0.741224786634045 | 0.629387606682978 |
| 31 | 0.457810856798340 | 0.915621713596679 | 0.54218914320166 |
| 32 | 0.473001017566528 | 0.946002035133055 | 0.526998982433472 |
| 33 | 0.488265684686765 | 0.97653136937353 | 0.511734315313235 |
| 34 | 0.625760518948731 | 0.748478962102537 | 0.374239481051269 |
| 35 | 0.699142712998317 | 0.601714574003367 | 0.300857287001683 |
| 36 | 0.836655049040567 | 0.326689901918867 | 0.163344950959433 |
| 37 | 0.784191066276361 | 0.431617867447278 | 0.215808933723639 |
| 38 | 0.758015362251213 | 0.483969275497573 | 0.241984637748787 |
| Meta Analysis of Goldfeld-Quandt test for Heteroskedasticity | |||
| Description | # significant tests | % significant tests | OK/NOK |
| 1% type I error level | 0 | 0 | OK |
| 5% type I error level | 1 | 0.0526315789473684 | NOK |
| 10% type I error level | 3 | 0.157894736842105 | NOK |