| Multiple Linear Regression - Estimated Regression Equation |
| y[t] = + 21386.0345240392 + 4570.5834593585x[t] + 0.937414189322683y1[t] + 0.134008529853577y2[t] + 0.126857011464927y3[t] -0.259803480419487y4[t] + 0.00246372856114373y5[t] -3682.13734938526M1[t] -8617.31854672714M2[t] -7066.4047264724M3[t] -9287.79908724293M4[t] -5147.02671990541M5[t] + 17983.3445346842M6[t] + 782.48771753359M7[t] -6645.70370737072M8[t] -15236.7700945788M9[t] -10308.5541016025M10[t] -1107.26843820283M11[t] -68.7912791567189t + e[t] |
| Multiple Linear Regression - Ordinary Least Squares | |||||
| Variable | Parameter | S.D. | T-STAT H0: parameter = 0 | 2-tail p-value | 1-tail p-value |
| (Intercept) | 21386.0345240392 | 10753.816064 | 1.9887 | 0.052452 | 0.026226 |
| x | 4570.5834593585 | 2098.741718 | 2.1778 | 0.034369 | 0.017184 |
| y1 | 0.937414189322683 | 0.142928 | 6.5586 | 0 | 0 |
| y2 | 0.134008529853577 | 0.194882 | 0.6876 | 0.494989 | 0.247494 |
| y3 | 0.126857011464927 | 0.198556 | 0.6389 | 0.525927 | 0.262963 |
| y4 | -0.259803480419487 | 0.198715 | -1.3074 | 0.197298 | 0.098649 |
| y5 | 0.00246372856114373 | 0.149128 | 0.0165 | 0.986887 | 0.493444 |
| M1 | -3682.13734938526 | 2465.403429 | -1.4935 | 0.141845 | 0.070923 |
| M2 | -8617.31854672714 | 2763.500072 | -3.1183 | 0.003072 | 0.001536 |
| M3 | -7066.4047264724 | 2705.339604 | -2.612 | 0.011979 | 0.00599 |
| M4 | -9287.79908724293 | 2398.918476 | -3.8717 | 0.000326 | 0.000163 |
| M5 | -5147.02671990541 | 2443.087351 | -2.1068 | 0.040389 | 0.020195 |
| M6 | 17983.3445346842 | 2229.790985 | 8.065 | 0 | 0 |
| M7 | 782.48771753359 | 3408.61334 | 0.2296 | 0.819408 | 0.409704 |
| M8 | -6645.70370737072 | 4500.77405 | -1.4766 | 0.146322 | 0.073161 |
| M9 | -15236.7700945788 | 4515.96289 | -3.374 | 0.001474 | 0.000737 |
| M10 | -10308.5541016025 | 4463.807728 | -2.3094 | 0.025271 | 0.012636 |
| M11 | -1107.26843820283 | 2654.333191 | -0.4172 | 0.678425 | 0.339212 |
| t | -68.7912791567189 | 36.037059 | -1.9089 | 0.062263 | 0.031132 |
| Multiple Linear Regression - Regression Statistics | |
| Multiple R | 0.986093368796538 |
| R-squared | 0.972380131984505 |
| Adjusted R-squared | 0.962022681478694 |
| F-TEST (value) | 93.8821895831396 |
| F-TEST (DF numerator) | 18 |
| F-TEST (DF denominator) | 48 |
| p-value | 0 |
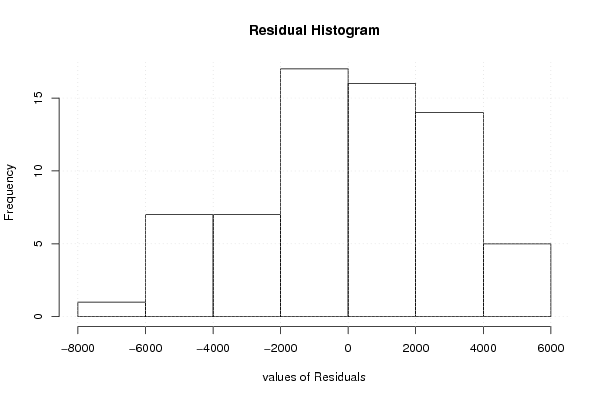
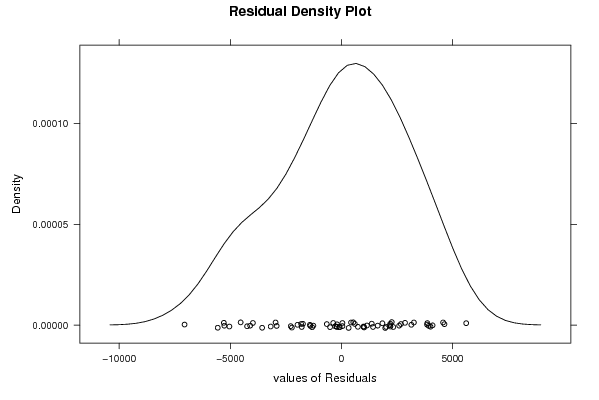
| Multiple Linear Regression - Residual Statistics | |
| Residual Standard Deviation | 3381.62366621292 |
| Sum Squared Residuals | 548898173.754784 |
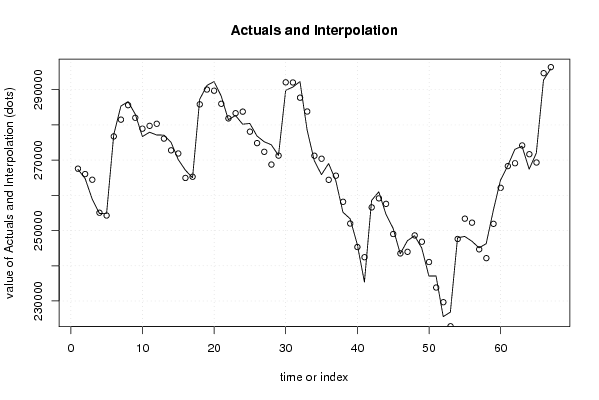
| Multiple Linear Regression - Actuals, Interpolation, and Residuals | |||
| Time or Index | Actuals | Interpolation Forecast | Residuals Prediction Error |
| 1 | 267366 | 267561.66414859 | -195.664148589884 |
| 2 | 264777 | 266038.361251580 | -1261.36125158039 |
| 3 | 258863 | 264427.699636706 | -5564.69963670626 |
| 4 | 254844 | 255057.219632103 | -213.219632102641 |
| 5 | 254868 | 254264.31776012 | 603.682239880169 |
| 6 | 277267 | 276732.098444375 | 534.901555624953 |
| 7 | 285351 | 281483.067840301 | 3867.93215969854 |
| 8 | 286602 | 285598.422768286 | 1003.57723171426 |
| 9 | 283042 | 282019.928399285 | 1022.07160071451 |
| 10 | 276687 | 278916.036322215 | -2229.03632221504 |
| 11 | 277915 | 279727.825008706 | -1812.82500870615 |
| 12 | 277128 | 280309.114251889 | -3181.11425188940 |
| 13 | 277103 | 276106.809337874 | 996.19066212559 |
| 14 | 275037 | 272771.997448115 | 2265.00255188492 |
| 15 | 270150 | 271879.539923842 | -1729.53992384200 |
| 16 | 267140 | 264935.668890494 | 2204.33110950609 |
| 17 | 264993 | 265273.603130365 | -280.603130365346 |
| 18 | 287259 | 285835.931348767 | 1423.06865123332 |
| 19 | 291186 | 290033.761219416 | 1152.23878058413 |
| 20 | 292300 | 289699.444193514 | 2600.55580648610 |
| 21 | 288186 | 285985.097897559 | 2200.90210244081 |
| 22 | 281477 | 281845.379702544 | -368.37970254389 |
| 23 | 282656 | 283313.379022110 | -657.379022110357 |
| 24 | 280190 | 283756.368523286 | -3566.36852328586 |
| 25 | 280408 | 278072.264982716 | 2335.73501728379 |
| 26 | 276836 | 274824.633952222 | 2011.36604777802 |
| 27 | 275216 | 272351.860019964 | 2864.13998003634 |
| 28 | 274352 | 268735.619871884 | 5616.38012811592 |
| 29 | 271311 | 271264.735323811 | 46.2646761886604 |
| 30 | 289802 | 292082.902146032 | -2280.90214603200 |
| 31 | 290726 | 292041.936627159 | -1315.93662715915 |
| 32 | 292300 | 287723.783154503 | 4576.21684549669 |
| 33 | 278506 | 283796.886025194 | -5290.88602519388 |
| 34 | 269826 | 271242.246361088 | -1416.24636108839 |
| 35 | 265861 | 270394.643246172 | -4533.64324617248 |
| 36 | 269034 | 264396.559296288 | 4637.44070371187 |
| 37 | 264176 | 265575.190327744 | -1399.19032774368 |
| 38 | 255198 | 258160.590272551 | -2962.59027255119 |
| 39 | 253353 | 251986.847717212 | 1366.15228278776 |
| 40 | 246057 | 245313.607828147 | 743.392171853363 |
| 41 | 235372 | 242429.989723120 | -7057.98972311957 |
| 42 | 258556 | 256584.068519531 | 1971.93148046879 |
| 43 | 260993 | 259147.219157699 | 1845.78084230060 |
| 44 | 254663 | 257577.082035586 | -2914.0820355856 |
| 45 | 250643 | 249009.049116564 | 1633.95088343566 |
| 46 | 243422 | 243511.336502552 | -89.3365025524604 |
| 47 | 247105 | 243957.021854291 | 3147.9781457088 |
| 48 | 248541 | 248620.91483001 | -79.9148300099232 |
| 49 | 245039 | 246822.446502492 | -1783.44650249211 |
| 50 | 237080 | 241061.436900374 | -3981.43690037385 |
| 51 | 237085 | 233820.901903244 | 3264.09809675594 |
| 52 | 225554 | 229660.572305417 | -4106.57230541694 |
| 53 | 226839 | 222827.615167561 | 4011.38483243935 |
| 54 | 247934 | 247608.302226826 | 325.69777317352 |
| 55 | 248333 | 253372.494842279 | -5039.49484227919 |
| 56 | 246969 | 252235.267848111 | -5266.26784811145 |
| 57 | 245098 | 244664.038561397 | 433.961438602899 |
| 58 | 246263 | 242160.0011116 | 4102.99888839978 |
| 59 | 255765 | 251909.13086872 | 3855.86913128019 |
| 60 | 264319 | 262129.043098527 | 2189.95690147333 |
| 61 | 268347 | 268300.624700584 | 46.3752994162896 |
| 62 | 273046 | 269116.980175157 | 3929.01982484249 |
| 63 | 273963 | 274163.150799032 | -200.150799031771 |
| 64 | 267430 | 271674.311471956 | -4244.31147195579 |
| 65 | 271993 | 269315.738895023 | 2677.26110497673 |
| 66 | 292710 | 294684.697314469 | -1974.69731446858 |
| 67 | 295881 | 296391.520313145 | -510.520313144927 |
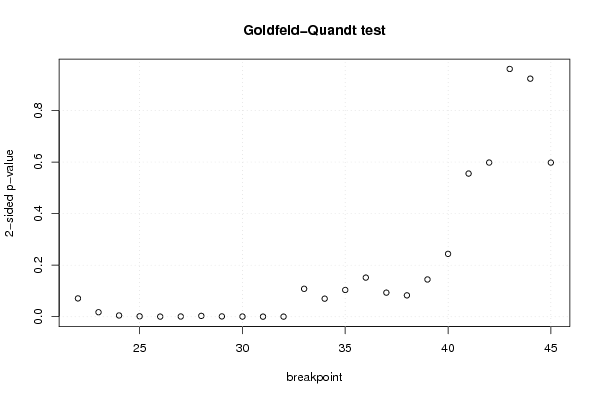
| Goldfeld-Quandt test for Heteroskedasticity | |||
| p-values | Alternative Hypothesis | ||
| breakpoint index | greater | 2-sided | less |
| 22 | 0.0355083895027452 | 0.0710167790054903 | 0.964491610497255 |
| 23 | 0.00871887752105566 | 0.0174377550421113 | 0.991281122478944 |
| 24 | 0.00239835073951609 | 0.00479670147903218 | 0.997601649260484 |
| 25 | 0.000774647317205566 | 0.00154929463441113 | 0.999225352682794 |
| 26 | 0.000195390925715357 | 0.000390781851430714 | 0.999804609074285 |
| 27 | 0.00042512727670525 | 0.0008502545534105 | 0.999574872723295 |
| 28 | 0.00162283619066268 | 0.00324567238132536 | 0.998377163809337 |
| 29 | 0.000566561545307381 | 0.00113312309061476 | 0.999433438454693 |
| 30 | 0.000281215838677075 | 0.00056243167735415 | 0.999718784161323 |
| 31 | 0.000101699601654305 | 0.000203399203308610 | 0.999898300398346 |
| 32 | 0.000128346068149485 | 0.00025669213629897 | 0.99987165393185 |
| 33 | 0.0541125428396283 | 0.108225085679257 | 0.945887457160372 |
| 34 | 0.0349889020746427 | 0.0699778041492854 | 0.965011097925357 |
| 35 | 0.0518788321108202 | 0.103757664221640 | 0.94812116788918 |
| 36 | 0.0758682111566794 | 0.151736422313359 | 0.92413178884332 |
| 37 | 0.0466920185122089 | 0.0933840370244178 | 0.953307981487791 |
| 38 | 0.0414070404918526 | 0.0828140809837051 | 0.958592959508147 |
| 39 | 0.0722440452516329 | 0.144488090503266 | 0.927755954748367 |
| 40 | 0.121866685817795 | 0.243733371635591 | 0.878133314182205 |
| 41 | 0.277673246387021 | 0.555346492774041 | 0.72232675361298 |
| 42 | 0.299025501317978 | 0.598051002635956 | 0.700974498682022 |
| 43 | 0.519371598375563 | 0.961256803248873 | 0.480628401624437 |
| 44 | 0.461766495812319 | 0.923532991624639 | 0.538233504187681 |
| 45 | 0.70105208786846 | 0.59789582426308 | 0.29894791213154 |
| Meta Analysis of Goldfeld-Quandt test for Heteroskedasticity | |||
| Description | # significant tests | % significant tests | OK/NOK |
| 1% type I error level | 9 | 0.375 | NOK |
| 5% type I error level | 10 | 0.416666666666667 | NOK |
| 10% type I error level | 14 | 0.583333333333333 | NOK |