| Multiple Linear Regression - Estimated Regression Equation |
| Zichtrekeningen[t] = + 2943.37797804525 + 0.0683218595762599`Bel20 `[t] -94.2882744750586M1[t] + 40.5455669616858M2[t] -11.2127651932675M3[t] + 34.0636735807399M4[t] + 45.0719224853597M5[t] + 61.357970088517M6[t] + 105.682285287828M7[t] + 272.128981094533M8[t] + 296.062320766578M9[t] + 141.266497108976M10[t] + 72.3889677968816M11[t] + 8.48262743431114t + e[t] |
| Multiple Linear Regression - Ordinary Least Squares | |||||
| Variable | Parameter | S.D. | T-STAT H0: parameter = 0 | 2-tail p-value | 1-tail p-value |
| (Intercept) | 2943.37797804525 | 133.930697 | 21.9769 | 0 | 0 |
| `Bel20 ` | 0.0683218595762599 | 0.025232 | 2.7078 | 0.009542 | 0.004771 |
| M1 | -94.2882744750586 | 103.144258 | -0.9141 | 0.365516 | 0.182758 |
| M2 | 40.5455669616858 | 103.176576 | 0.393 | 0.696195 | 0.348098 |
| M3 | -11.2127651932675 | 103.023002 | -0.1088 | 0.913815 | 0.456908 |
| M4 | 34.0636735807399 | 102.895519 | 0.3311 | 0.742143 | 0.371071 |
| M5 | 45.0719224853597 | 102.817848 | 0.4384 | 0.663218 | 0.331609 |
| M6 | 61.357970088517 | 102.851013 | 0.5966 | 0.553783 | 0.276892 |
| M7 | 105.682285287828 | 102.677205 | 1.0293 | 0.308855 | 0.154427 |
| M8 | 272.128981094533 | 102.671439 | 2.6505 | 0.011054 | 0.005527 |
| M9 | 296.062320766578 | 102.807401 | 2.8798 | 0.006073 | 0.003036 |
| M10 | 141.266497108976 | 102.916341 | 1.3726 | 0.176669 | 0.088334 |
| M11 | 72.3889677968816 | 102.916029 | 0.7034 | 0.485443 | 0.242722 |
| t | 8.48262743431114 | 1.259542 | 6.7347 | 0 | 0 |
| Multiple Linear Regression - Regression Statistics | |
| Multiple R | 0.81148330821063 |
| R-squared | 0.658505159504467 |
| Adjusted R-squared | 0.559851094472425 |
| F-TEST (value) | 6.67489129100342 |
| F-TEST (DF numerator) | 13 |
| F-TEST (DF denominator) | 45 |
| p-value | 7.13518564787741e-07 |
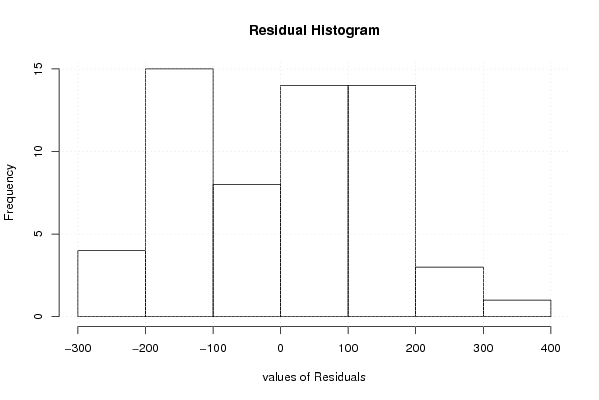
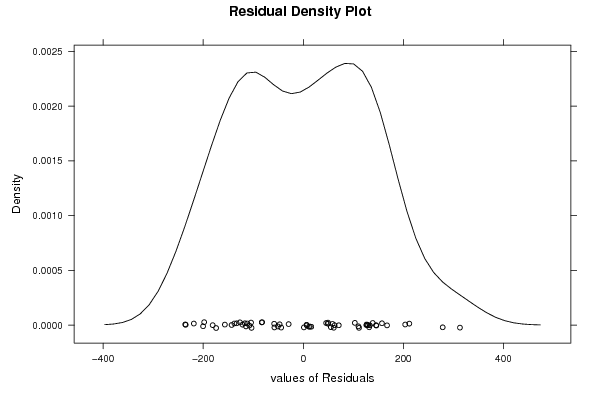
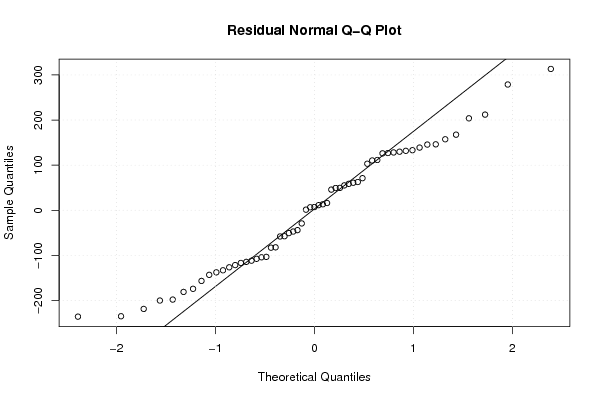
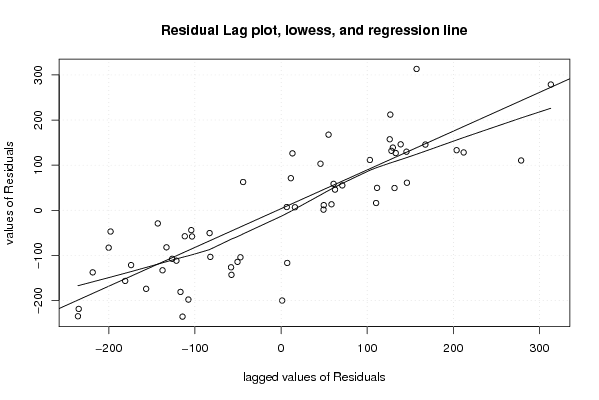
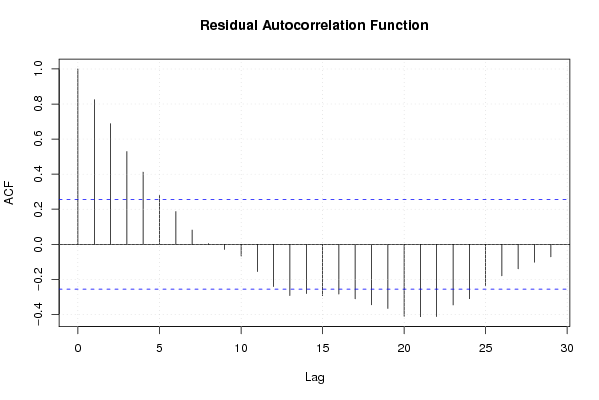
| Multiple Linear Regression - Residual Statistics | |
| Residual Standard Deviation | 152.955565226744 |
| Sum Squared Residuals | 1052793.22202247 |
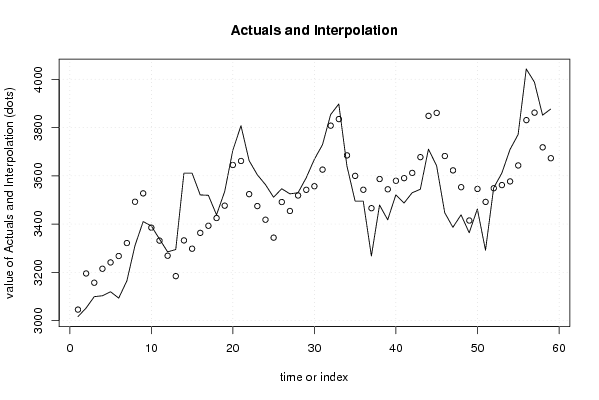
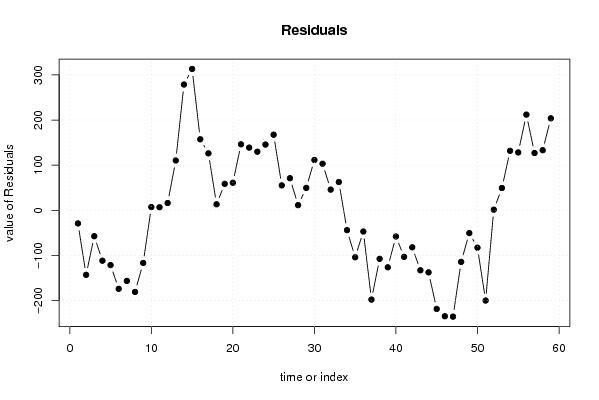
| Multiple Linear Regression - Actuals, Interpolation, and Residuals | |||
| Time or Index | Actuals | Interpolation Forecast | Residuals Prediction Error |
| 1 | 3016.7 | 3045.91930060995 | -29.2193006099471 |
| 2 | 3052.4 | 3195.55622471041 | -143.156224710411 |
| 3 | 3099.6 | 3157.21130859539 | -57.6113085953879 |
| 4 | 3103.3 | 3215.09769834071 | -111.797698340707 |
| 5 | 3119.8 | 3241.3339918756 | -121.533991875603 |
| 6 | 3093.7 | 3267.85443939261 | -174.154439392607 |
| 7 | 3164.9 | 3321.55571516808 | -156.655715168082 |
| 8 | 3311.5 | 3492.51895446070 | -181.018954460697 |
| 9 | 3410.6 | 3527.39792460478 | -116.797924604777 |
| 10 | 3392.6 | 3385.48328970101 | 7.11671029899395 |
| 11 | 3338.2 | 3331.61107575697 | 6.58892424303202 |
| 12 | 3285.1 | 3269.06092430699 | 16.0390756930139 |
| 13 | 3294.8 | 3184.50625051508 | 110.293749484920 |
| 14 | 3611.2 | 3332.51438148324 | 278.685618516763 |
| 15 | 3611.3 | 3298.13281644223 | 313.167183557767 |
| 16 | 3521 | 3363.70199929690 | 157.298000703097 |
| 17 | 3519.3 | 3393.16991678976 | 126.130083210245 |
| 18 | 3438.3 | 3425.10555489677 | 13.1944451032266 |
| 19 | 3534.9 | 3476.37867178291 | 58.5213282170912 |
| 20 | 3705.8 | 3644.85499538695 | 60.9450046130524 |
| 21 | 3807.6 | 3661.49271224276 | 146.107287757238 |
| 22 | 3663 | 3524.16315733515 | 138.836842664846 |
| 23 | 3604.5 | 3474.74484541689 | 129.755154583108 |
| 24 | 3563.8 | 3418.20565117243 | 145.594348827570 |
| 25 | 3511.4 | 3343.90677172152 | 167.493228278484 |
| 26 | 3546.5 | 3491.40658805443 | 55.0934119455739 |
| 27 | 3525.4 | 3454.35773761556 | 71.0422623844358 |
| 28 | 3529.9 | 3518.57141477624 | 11.3285852237581 |
| 29 | 3591.6 | 3542.07483392809 | 49.5251660719132 |
| 30 | 3668.3 | 3556.89174689968 | 111.408253100323 |
| 31 | 3728.8 | 3625.70581801342 | 103.094181986579 |
| 32 | 3853.6 | 3807.85607859305 | 45.7439214069471 |
| 33 | 3897.7 | 3835.10964598983 | 62.5903540101733 |
| 34 | 3640.7 | 3684.79552166975 | -44.0955216697502 |
| 35 | 3495.5 | 3599.78288734945 | -104.282887349448 |
| 36 | 3495.1 | 3542.29675213126 | -47.1967521312591 |
| 37 | 3268 | 3465.97007988812 | -197.970079888122 |
| 38 | 3479.1 | 3586.73691900603 | -107.636919006033 |
| 39 | 3417.8 | 3544.24691567052 | -126.446915670517 |
| 40 | 3521.3 | 3579.40945492077 | -58.1094549207738 |
| 41 | 3487.1 | 3590.46189838344 | -103.361898383441 |
| 42 | 3529.9 | 3612.04814120185 | -82.1481412018471 |
| 43 | 3544.3 | 3677.37301494703 | -133.073014947032 |
| 44 | 3710.8 | 3848.43805381042 | -137.638053810415 |
| 45 | 3641.9 | 3860.58360839909 | -218.683608399091 |
| 46 | 3447.1 | 3682.03820848351 | -234.938208483508 |
| 47 | 3386.8 | 3622.62919103941 | -235.829191039409 |
| 48 | 3438.5 | 3552.93667238933 | -114.436672389325 |
| 49 | 3364.3 | 3414.89759726534 | -50.5975972653355 |
| 50 | 3462.7 | 3545.68588674589 | -82.9858867458928 |
| 51 | 3291.9 | 3492.0512216763 | -200.151221676298 |
| 52 | 3550 | 3548.71943266537 | 1.28056733462649 |
| 53 | 3611 | 3561.75935902311 | 49.240640976886 |
| 54 | 3708.6 | 3576.90011760910 | 131.699882390904 |
| 55 | 3771.1 | 3642.98678008856 | 128.113219911444 |
| 56 | 4042.7 | 3830.73191774889 | 211.968082251113 |
| 57 | 3988.4 | 3861.61610876354 | 126.783891236457 |
| 58 | 3851.2 | 3718.11982281058 | 133.080177189418 |
| 59 | 3876.7 | 3672.93200043728 | 203.767999562718 |
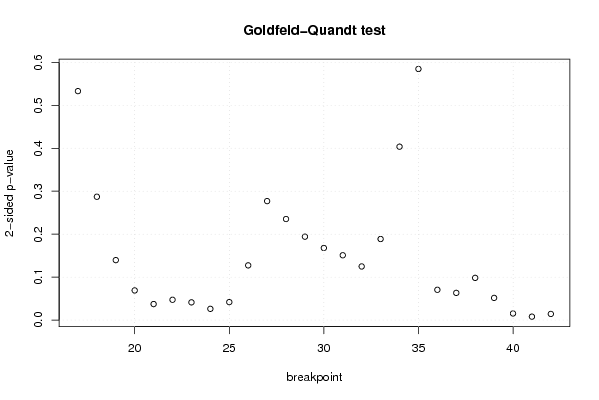
| Goldfeld-Quandt test for Heteroskedasticity | |||
| p-values | Alternative Hypothesis | ||
| breakpoint index | greater | 2-sided | less |
| 17 | 0.26656486185633 | 0.53312972371266 | 0.73343513814367 |
| 18 | 0.143584059405276 | 0.287168118810551 | 0.856415940594724 |
| 19 | 0.0698116322527439 | 0.139623264505488 | 0.930188367747256 |
| 20 | 0.0345302262187998 | 0.0690604524375996 | 0.9654697737812 |
| 21 | 0.01866116669697 | 0.03732233339394 | 0.98133883330303 |
| 22 | 0.0236714714494563 | 0.0473429428989125 | 0.976328528550544 |
| 23 | 0.0206699324676816 | 0.0413398649353632 | 0.979330067532318 |
| 24 | 0.0131216663814902 | 0.0262433327629803 | 0.98687833361851 |
| 25 | 0.0209264043802624 | 0.0418528087605247 | 0.979073595619738 |
| 26 | 0.0637220751920967 | 0.127444150384193 | 0.936277924807903 |
| 27 | 0.138518077589591 | 0.277036155179182 | 0.861481922410409 |
| 28 | 0.117665006867943 | 0.235330013735885 | 0.882334993132057 |
| 29 | 0.0971145027717917 | 0.194229005543583 | 0.902885497228208 |
| 30 | 0.0839443225765095 | 0.167888645153019 | 0.91605567742349 |
| 31 | 0.075473550188365 | 0.15094710037673 | 0.924526449811635 |
| 32 | 0.0624453554020166 | 0.124890710804033 | 0.937554644597983 |
| 33 | 0.0943920232853623 | 0.188784046570725 | 0.905607976714638 |
| 34 | 0.201855059328963 | 0.403710118657926 | 0.798144940671037 |
| 35 | 0.707644009845512 | 0.584711980308975 | 0.292355990154488 |
| 36 | 0.964720567444756 | 0.0705588651104884 | 0.0352794325552442 |
| 37 | 0.968315898551286 | 0.0633682028974274 | 0.0316841014487137 |
| 38 | 0.950833004342556 | 0.0983339913148873 | 0.0491669956574436 |
| 39 | 0.974155432234907 | 0.0516891355301868 | 0.0258445677650934 |
| 40 | 0.99227258050098 | 0.0154548389980412 | 0.00772741949902059 |
| 41 | 0.99598503365077 | 0.0080299326984592 | 0.0040149663492296 |
| 42 | 0.992824708361972 | 0.0143505832760563 | 0.00717529163802814 |
| Meta Analysis of Goldfeld-Quandt test for Heteroskedasticity | |||
| Description | # significant tests | % significant tests | OK/NOK |
| 1% type I error level | 1 | 0.0384615384615385 | NOK |
| 5% type I error level | 8 | 0.307692307692308 | NOK |
| 10% type I error level | 13 | 0.5 | NOK |